Volume 28, Number 1, 2013, 115 – 131
PROSPECTOR-DEFENDER STRATEGY,
AUDITOR INDUSTRY SPECIALIZATION,
EARNINGS MANAGEMENT THROUGH REAL ACTIVITIES,
AND EARNINGS QUALITY
Wuryan Andayani
Ph.D. Student at Universitas Gadjah Mada, Yogyakarta Brawijaya University, Malang
Sony Warsono
Faculty of Economics and Business Universitas Gadjah Mada
ABSTRACT
This study observed the influence of the company prospector-defender strategy and auditor industry specialization toward the earnings management through real activities and earnings quality. An important finding in this study confirmed that the auditor industry specialization could not restrict the earnings management and the company‘s prospector strategy could restrict the earnings management. On the contrary, defender strategy could not restrict the earnings management. Another finding proved that the auditor industry specialization influence the earnings response coefficient (ERC) and investors’ response. Besides the auditor industry specialization, as well as the prospector and defender strate-gies, other factors also affected influence ERC are leverage, company size, stock return, beta and market return. The interaction among the prospector and defender strategies and unexpected earnings neither influence the CAR nor the investors’ response. This was probably because the investors pay attention to the strategy used by the company. How-ever, there were any interaction variables: industry specialization auditor, leverage, stock return, beta and market return influence the CAR and investors’ response.
Keywords: auditor industry specialization, prospector-defender strategy, earnings response coefficient, earnings quality.
INTRODUCTION
Research about factors affecting earnings quality is very important to do since earnings quality mechanism can bound managers’ abil-ity to alter their accounting data. In the real world, accounting system provides a space for manager to influence the financial statement data. As a result, outcome on firm’s financial statement information are noisy and bias.
in-curred. Obviously, some research expenditures have future value while others do not. Second, the source of noise arises from forecast error on credit trade prediction, where managers cannot predict future cost of current transac-tions. Manager estimates account receivables that cannot be collected and this failure in customer’s payment resulted in an error pre-diction. Third, manager’s accounting choice included accounting based on debt covenants, management compensation, tax consideration, rule consideration, stock exchange considera-tion, shareholders consideraconsidera-tion, as well as business competition consideration.
Besides earnings quality factors, audit factor is also capable to increase earnings quality and to bind earnings management. Auditor who has a comprehensive under-standing of industry characteristics is more effective in auditing compared to those with-out knowledge of industry characteristics (Maletta & Wright, 1996); Becker (1998) stated that earnings management rate is higher for client with non Big Six auditor. Solomon
et al. (1999) found that specialist auditor is
more accurate in auditing and does not per-form an error audit. Client of non specialist auditor reported a higher discretionary accrual than those reported by a client of specialist auditor (Krishnan, 2003), which by then sup-ported Johnson et al. (1991), O’Keefe et al.
(1994), Becker (1998) and Solomon (1999).
Furthermore, researches on auditor spe-cialization with earnings response coefficient (ERC) which are conducted by Teoh & Wong (1993) and Mayangsari (2003). Teoh & Wong (1993) reported that client with a big six auditor has a high ERC. In Indonesia, while Mayangsari (2003) found a proof that auditor specialization correlated positively with financial report integrity, and corporate gover-nance correlated negatively with financial report. Furthermore, Mayangsari (2004) proved that auditor specialization influenced ERC.
Earnings management can also be con-ducted by firm which competes in an industry that finally influences the policy option of financial statement(Healy & Palepu, 2004). In a highly competitive business world, firm is challenged to conduct the right business strat-egy. Therefore, firm is able to compete and go over its competitor in gaining earnings and chances to grow. There are four firm’s com-petition typologies: prospector, defender, analyzer, and reactor (Miles & Snow, 1978; Habbe & Hartono, 2001); prospector, ana-lyzer, low cost defender, and differential de-fender (Olson, 2005).
Miles & Snow (1978) and Olson et al.
(2005) stated that prospector has competitive characteristics to offer product that differs with its competitor, where in other word it is unique (differentiation strategy). Defender has a competitive characteristic by offering a cheaper product (cost leadership strategy). Besides Miles & Snow (1978) and Habbe & Hartono (2001), a research on prospector and defender organizational strategy was done by Porter (1980); Anthony & Ramesh (1992), Woodside et al. (1999); Olson et al. (2005). The result of Habbe & Hartono (2001) and Saraswati & Atmini (2007) on association between stock price and prospector and defender firm are not significant.
This research differs from the previous re-searches. This research is associated with the possibility of prospector and defender’s audi-tor specialization to limit earnings manage-ment and also to get information on prospector and defender’s earnings quality.
LITERATURE REVIEW AND HYPOTHESES DEVELOPMENT
Prospector and Defender Organizational Strategy and Earnings Management
prospector, defender, analyzer, and reaction. Olson (2005) pointed out that firm strategy consist of prospector, analyzer, low cost de-fender, and differentiated defender. Prospector is always observing market opportunity and doing product innovation, while defender has a narrow product domain and does not inno-vate on technology, structure, and operational method, but only increases operational effi-ciency. Analyzer, operates in a stable market-product domain, gives attention to competi-tor’s new ideas. Reactors, does not response changes and environment instability, and con-sistent with strategy and structure.
Porter (1980) stated that firm in growth phase has a higher margin and profit than that in maturity phase. This is because the growing firm is still in its developing phase and also doing a lot of investment so thus its ROI is still low compared to a mature firm. In addi-tion, Anthony & Ramesh (1992) also found that in growth phase, the growing of sales is higher than in maturity and decline phase. In this phase, the dividend payout is lower than that in maturity phase. It means that prospector firm gives a small small dividend to share-holders. Subsequently, Ittner, et al. (1997) found that in a competition, a prospector firm gives more weight on product innovation as a competitive advantage. Therefore, a prospec-tor firm tends to invest in form of R&D and has a bigger capital expenditure than a de-fender firm.
In Indonesia, Habbe & Hartono (2001) examined the association between stock price and accounting performance measurement for prospector and defender firm. Habbe & Hartono (2001) did not find any empirical evidence of relationship between stock price and prospector and defender strategy. Saras-wati & Atmini (2007) examined market re-action to prospector and defender accounting performance measurement after crisis period. The result proved that prospector firm has a higher growth rate of earnings and sales than defender firm (insignificant), dividend payout
ratio of defender firm is higher than that of prospector firm, and last, market reaction of prospector is higher than defender’s (also in-significant).
Earnings management is a choice of ac-counting policy for manager to achieve several particular objectives (Scott, 2006). Healy & Palepu (2004) said that there are three sources of noise and bias in accounting data which are noisy in accounting rule, error prediction, and manager’s accounting policy choice which includes business competition. Thus, earnings management can emerge from business com-petition between firms. Next, Burgstahler & Emas (1998) in Aljifri (2007) stated that earnings management can be developed from actual operation, investment, and funding which can influence the size of accounting earnings. This is in accordance with Roy-chowdurry (2006) who argued that earnings management through real activity is indicated with low abnormal discretionarycost and high abnormal production cost.
Discretionary cost expenditure includes research and development (R&D), as well as advertising, maintenance, sales, general and administration costs. Firm reduces reported cost and increases the sales by selecting dis-cretionary cost expenditure to increase earn-ings. Manager selects discretionary cost to achieve earnings target, showing that discre-tionary cost is low.
opera-tional cash flow is lower than given normal sales rate.
Audit Industry Specialization
Agency theory and contracting theory are developed to explain audit brand name and industry specialization as a function to reduce agency cost (Craswell, et al., 1995). Audit quality can reduce agency problem that occurs between management as the agent and stock-holder as the principal (Jensen & Meckling, 1976). Audit quality also can reduce contracting problem and reduce monitoring cost (Watts & Zimmerman, 1986). Hogan & Jeter (1996) stated that auditor who has industry specialization gives a better audit quality than a non-specialist one. According to Hogan & Jeter (1996), auditor specialization is required and increasing due to the expanding target market and competition between accounting firms. Auditor concentration in-creases in an unregulated industry with a low claim.
Auditor reputation is related with how the auditor can create useful information for fi-nancial users. Jensen & Meckling (1976) and Watts & Zimmerman (1986) stated that auditor with a good reputation can solve debt contract problem by giving valuable informa-tion about debtor. On the contrary, a limitainforma-tion on information availability concerning the firm will make lender (creditor) depends on firm’s disclosure. This disclosure will be util-ized to evaluate the performance and future prospect. Later, if information availability is restricted, the lender will have to spend an expensive cost to get information and to monitor a reliable financial statement. Thus, information gap between stockholder ( princi-pal) and manager (agent) will influence agency cost. It can also influence monitoring cost. According to previous research, agency cost and monitoring cost are expected to de-crease with the emergence of audit quality and auditor specialization in industry.
Research on audit quality conducted by Dopuch & Simunic (1982) confirmed that special auditor invests more on recruitment and training, information technology, and au-diting technology than that done by non spe-cialist auditor. Johnson, et al. (1991) discovered evidence that industry expertise is related with the ability to detect fraud. O’Keefe, et al. (1994) also found evidence that specialist auditor shows obedience to audit standard (GAAS) compared those of non specialist one. While Teoh & Wong (1993) reported that client with Big 6 Auditor has a high Earnings Response Coefficient. These researches showed that audit quality can increase earnings quality and financial state-ment quality.
Research associating auditor specializa-tion with earnings management is done by Maletta & Wright (1996) who examine fun-damental difference in character and method in detecting earnings management. Maletta & Wright (1996) stated that auditor with a comprehensive understanding of industry characteristic audits more effectively than auditor without knowledge of industry char-acteristics.
To answer opinion that a qualified auditor can reduce monitoring cost, Francis, et al.
(1999) conducted a research. The result also proved that external monitoring can restrict earnings opportunity to report financial state-ment based on accrual. Next, Pittman & Forting (2004) pointed out that qualified auditor (the Big 6) can reduce debt monitoring cost by increasing financial statement credi-bility. Auditor expertise is also able to reduce problem of asymmetric information between debtor and creditor.
Audit quality is difficult to observe since it has a multidimensional size. This is in ac-cordance with Balsam, et al. (2003) who stated that audit quality is multidimensional as well as difficult to observe and has no single characteristic of proxy. Balsam, et al. (2003) proved that client of the Big 6 specialist auditor has a lower discretionary accrual and a higher ERC than those of non Big 6 client. Research shows that a low audit quality correlates with flexibility on choosing accounting methods.
Result of Johnson, et al. (1991), O’Keefe,
et al. (1994), Becker (1998), Solomon (1999),
and Balsam, et al. (2003) supported Khrisnan (2003); that research on expertise of the Big 6 industry auditor can limit earnings mana-gement. Khrisnan (2003) research result proved that client of a non specialist auditor reported absolute discretionary accrual above average rate of 1.2% from total assets, which is higher than discretionary accrual reported by client of a specialist auditor. That result is consistent with opinion which stated that specialist auditor can reduce earnings mana-gement compare to non specialist auditor. Roychowdhury (2006) pointed out that discretionary cost such as research & de-velopment (R&D), advertisement, and mainte-nance are commonly charged upon its happening. Therefore, firm reduces discre-tionary cost to raise earnings. Hence, a low discretionary cost indicates the emergence of earnings management. In general, previous
researches proved that audit quality can reduce earnings management. Audit quality correlates with auditor specialization and auditor’s reputation, where three of them should be pos-sessed by auditor since it is a component of auditor expertise. Several researches also sup-ported the statement that specialist auditor has a good resource and a good experience, as well as has the ability to detect and to restrict earnings management.
Mayangsari (2003) found evidence that auditor specialization has a positive impact on financial statement integrity while corporate governance negatively correlates with finan-cial statement. Later, Mayangsari (2004) found that auditor industry specialization with earnings response coefficient/ERC. Unlike Mayangsari (2003, 2004), Siregar & Utama (2006) and Andayani, et al. (2008) found evidence that the Big 4 auditor is not able to restrict earnings management. This result emerged due to the inappropriatenessof audit quality proxy which used accounting firms measure. Hence, this research uses audit quality proxy of industry specialization. Therefore, the hypotheses are as follows:
H1a: abnormal discretionary cost of firm using auditor industry specialization is higher than that of firm without auditor industry specialization.
H1b: abnormal discretionary cost of firm using prospector strategy is higher than that of firm using defender strategy.
H1c: firm using auditor industry speciali-zation will be positively responded by investor than that of firm without auditor industry specialization.
H1d: firm using prospector strategy will posi-tively responded by investor than that of firm using defender strategy.
Earnings Response Coefficient (ERC)
unexpected earnings (Cho & Jung, 1991). ERC is also used as a measure of earnings quality (Choi & Jeter, 1990). Teoh & Wong (1993) examined the effect of auditor quality on earnings response coefficient and found that investor responded to unexpected earnings, consistent with that of Balsam, et al.
(2003). Balsam, et al. (2003) examined the connection between earnings quality (meas-ured with ERC) and industry specialist audi-tor, and found that specialist auditor gives more reliable earnings signal and having a higher ERC than that of a non specialist audi-tor. Therefore, the hypothesis can be con-cluded as follows:
H2: the earnings quality of firm using an industry specialization and using pros-pector strategy is higher than that of firm which is not using industry specialization and using defender strategy.
RESEARCH METHODS
Sample Selection and Data Collection
Population in this research is all firms listed in Bursa Efek Indonesia (formerly Bursa Efek Jakarta). The sample selection is based on purposive sampling method in order to gain representative sample according to criteria as follows:
Samples are firms listed on BEI in 2004-2006 and are not regulated (Dunn, et al., 2004). This period is chosen under the assumption that monetary crisis’ effect is getting smaller. Unregulated firms are chosen because they are not affected by tariff rule, such as one set by government for oil and transportation industry, and also financial industry get government’s rule on interest rate.
Regression Test Equationof Research Hypotheses
Yit = α0 + β1(SP) it + β2(PD) it +β3(CFO)it +
β4(LEV)it + β5 (LTA)it + εit (1) where:
Yt = abnormal discretionary cost. Abnormal discretionary cost is an estimates of residual (Khrisnan, 2003 and Balsam,
et al., 2003) which is then being
abso-luted (Balsam, 2003).
SP = 1 is auditor who has industry specia-lization by The Big 4. The Big 4 con-sists of PWC (partner Haryanto Sahari & Co); Deloitte Touche Tohmatsu (partner Hans, Tuanakotta Mustofa & Halim); KPMG (Siddharta & Harsono); Ernst & Young (partner Prasetyo, Sarwoko, & Sandjaya) and 0 is vice versa
PD = 1 if firm is a prospector type and 0 if firm is a defender type
TA = Assets’sTotal Logarithm as a proxy of firm’s size, as a control variable based on previous research (Balsam, et al.,
2003; Reynolds & Francis, 2000; Becker, et al., 1998; Warfield, et al., 1995).
CFO = operational cash flow, as a control variable based on previous research (Balsam, et al., 2003; Reynolds & Francis, 2000; Becker, et al., 1998; Warfield, et al., 1995).
LEV = long-term debt ratio, scaled using total assets, as a control variable based on previous research (Balsam, et al.,
2003; Reynolds & Francis, 2000; Becker, et al., 1998; Warfield, et al., 1995).
Earnings Management Proxy through Real Activity
1. DISKRESt/At-1 = α0 + α1 (1/At-1) + β1(Penjt/At-1) + εt (2) DISKRES = sales and general
admini-stration cost
2. Yt= α0 + α1SPit + α2PDit + α3LTAit +
α4CFOit + α5LEVit + εit. (3) In this case:
SP = audit specialization, 1, if it is audited by a specialist auditor and 0 if it is audited by a non specialist; PD = Prospector and defender type of firm; LTA = total asset; CFO = operating cash flow; LEV = lev-erage.
Proxy of Prospector and Defender Firm
Proxy for prospector and defender firm is: 1. The sum of employee divided by total
sales (KAR/PEN)
2. Price to book value (PBV) (Ittner et al 1997).
3. Capital expenditure divided by mar-ket value of equity (CEMVE)
4. Capital expenditure divided by total asset (CETA) (Skinner 1993, Kallapur and Trombley 1999).
5. KARPEN = KAR/PENJ (4)
KAR = total employee; PEN = total nett sales; MV = market price per share; BV = book value per share; CE t = capital ex-penditure year t; CE t-1 = capital expendi-ture year t-1; MV t-1 = market value of eq-uity in the end of year t-1; TA t-1 = total asset year t-1
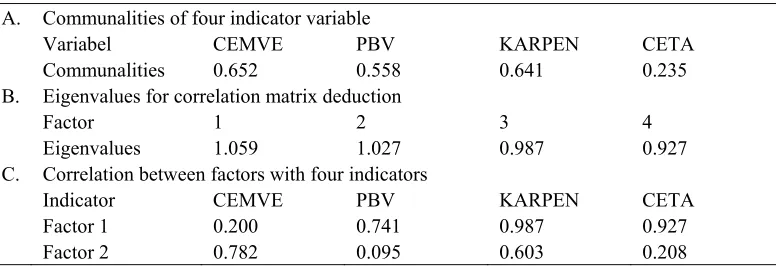
The value of those four variables is then ana-lyzed with common factor analysis.
Cumulative Abnormal Return (CAR)
Cumulative Abnormal Return (CAR) is a proxy of stock price which shows the size of market respond to published accounting earn-ings. Abnormal return shows market response towards an event while abnormal return is a difference between actual return and normal return (Hartono, 2000). Normal return is in-vestor’s expected return. Assumption used in this study is the semi efficient market
assump-tion and investor has an expected return. Ab-normal return occurs because there is new information that alters investor’s expected return. Expected return is calculated by de-ducting actual return with expected return as shown below:
ARit =Rit – E (Rit) (8)
In this case:
AR it = abnormal return security i in riod t; R it = actual return security i in pe-riod t; E (R it) = expected return security i in period t; Expected return is estimated with market model, using regression equation technique (CAPM formula) as follows:
R it = return security i in estimated period t; α it = intercept security i; β it = beta secu-rity i; RM t = market index return at esti-mated period t; CAR around event period is calculated by summing abnormal return for firm i along short term window period, this period is used since investor will quickly react to economic-value informa-tion.
CAR it = Cumulative Abnormal Return firm i at observing period ±5 days since dateof issueof thefinancial statements
AR it = Abnormal Return firm i in day t.
Unexpected Earnings (UE)
1 1) (
it t it
P EPS EPS it
UE (11)
In this case:
Ueit= Unexpected earnings firm i in pe-riod t; EPSit= earnings per share firm i in period t; Pit-1=stock price firm i in period t
Earnings Response Coefficient Test
This research examines hypothesis that ERC using auditor industry specialization and having prospector type is higher than that of defender firm which is not audited by non-auditor industry specialization by using re-gression as follows:
UE SP PD
CARit 0 1 it 2 it 3
4MBit 5LTA6LEV
7CFOit 8BETA 9RETit
10RETPASAR iteit (12)
it it
it UE SP UE
CAR 0 1 2 *
3PD*UEit 4MB *UEit
5LTA*UEit 6LEV*UEit
7CFO *UEit 8BETA *UEit
9RET *UEit
10RETPASAR*UEiteit (13)
In this case:
CARit = Cumulative Abnormal Return; UE= Unexpected earnings; MB= market
to book ratio (market value ratio divided by book equity value (Balsam, 2003; Collins and Kothari, 1989); LTA= log to-tal assets, as a controlling variable (Balsam, 2003; Bowen et al, 1992); LEV= leverage; CFO= operating cash flow; BETA= market model beta, which is a systematic risk expected to effect negatively on ERC (Balsam, 2003; Collins & Kothari, 1989; Lipe, 1990).
RET= return, to reduce the calculation er-ror of UE. (Balsam, 2003; Easton & Zmijewski, 1989)
ERC= coefficient slope, which is put into regression as an interaction with UE vari-able. ERC of specialist auditor is greater than that of non specialist auditor.
Market return= is used for minimizing UE error measure.
FINDINGS AND CONSEQUENCES
Selection on prospector and defender firm and on auditor industry specialization
Table 1.Common Factor Analysis
A. Communalities of four indicator variable
Variabel CEMVE PBV KARPEN CETA
Communalities 0.652 0.558 0.641 0.235 B. Eigenvalues for correlation matrix deduction
Factor 1 2 3 4
Eigenvalues 1.059 1.027 0.987 0.927
C. Correlation between factors with four indicators
Indicator CEMVE PBV KARPEN CETA
Factor 1 0.200 0.741 0.987 0.927
Factor 2 0.782 0.095 0.603 0.208
Subsequently, common factor analysis pointed out 483 firms, where later identification shows 236 firms using specialist auditor and 247 firms using non-specialist auditor.
Abnormal Discretionary Cost as an Indication of Earnings Management
Table 2. Regression Test Result
Yit = α0 + β1(SP) it + β2(PD) it +β3(CFO)it + β4(LEV)it + β5 (LTA)it + εit
where: Yit is abnormal discretionary cost.
Variable Coefficient t p-value
SP -0.034765 -9.125575 0.0000***
LTA -0.136906 -53.71166 0.0000***
LEV -0.008329 -2.669186 0.0076***
CFO 6.35E-08 1402.343 0.0000***
PD 0.016708 4.656048 0.0000***
R2 = 0.894092 Adj R2 = 0.894090 F = 393883.0 (0.0000)***
DW = 2.023800; 483 firm-year sample; Heteroscedasticity test using Breusch Pagan Godfrey
and showing insignificant probability at α > 0.05 and showing no multicolinearity. *significant at p<0.1, ** significant at p<0.05, *** significant at p<0.01
H1a test result showed that firm using auditor industry specialization correlates negatively with earnings management, signifi-cant at α=0.0000, which means firm with auditor industry specialization cannot restrict earnings management. This result showed that firm audited by auditor industry specialization has a low discretionary. Roychowdury (2006) stated that to detect real activities manipula-tion to avoid losses. He investigates patterns in CFO, discretionary expense and production
can-not restrict earnings management because the sign shows negative. This result supports Siregar & Utama (2006) and Andayani, et al.
(2008).
H1b test result showed that prospector type of firm correlates positively with earnings management significant statistically at α= 0.0000, hence prospector firm has a high dis-cretionary cost, while in the opposite defender firm has a low discretionary cost. Prospector firms always observe market opportunity and always innovation products. As a conse-quence, they never conduct such industrial competition since it is already in a mature condition and has a tough target market. This is in accordance with Feltham & Ohlson (1996) which pointed out that firm growth concept causes a reported net assets that is lower than market value. Greenball in Penmann & Zang (2000) also stated that conservative interaction with growth, so that accounting rates of return is lower than that without growth. Skinner & Sloan (2002) documented that firms with growth opportuni-ties are penalized more by the stock market when they miss earnings thresholds. On the contrary, defender type of firm has a narrow product domains, hence firm should struggle hard to compete with competitor to increase earnings. Defender firm has a narrow product domain, and they do not conduct innovations on technoloty, structure, and operation method only increase operation efficiency. Therefore, defender firm has small earnings and never conduct earnings management.
Test result also found that firm size cor-related negatively with earnings management significant at α=0.0000, which means the smaller the size of the firm, the higher the dis-cretionary cost, therefore shows no conducted earnings management. Leverage correlated negatively with earnings management with a significance at α=0.0000, where it showed that a high-leverage firm has a low discretionary cost and conducted earnings management. CFO correlated positively with earnings
man-agement significant at α=0.0000, which means that a high CFO shows no earnings manage-ment.
Earnings Response Coefficient
Unexpected Earnings (UE) is calculated using Kallapur (1994) formula since Balsam (2003) showed insignificancy. Therefore, re-input is done to calculate UE using Kallapur’s formula (1994).
H1c test result is supported, firm using auditor industry specialization correlated positively with market reaction significantly at α=0.0000, which indicates a firm using auditor industry specialization will be responded by investor more positively than firm without auditor industry specialization. H1d test result is also supported, showing that prospector company correlated negatively with earnings management significantly at α=0.0000, thus prospector firm is positively responded by investor, which means that this type of company will likely get more attention from the investor to invest its capital. On the contrary, defender firm is less responded by the market, which indicates this type of firm always observes market opportunity and always innovate product therefore they never conduct such industrial competition since it is already in mature condition and has a tough target market. It also has a narrow product domain, thus firm struggles hard to compete with competitor to increase earnings.
Table 3. Overall UE Regression Test Result
UE SP PD
CARit 0 1 it 2 it 3 4MBit
LEV CFO BETA
LTA 6 7 it 8
5
9RETit 10RETPASAR iteit
Variable Coefficient t p-value
UE -0.002033 -41.27092 0.0000***
SP 0.034945 17.56583 0.0000***
PD -0.044236 -22.21217 0.0000***
MB 8.71E-05 4.806047 0.0000***
LTA 9.72-10 9.471217 0.0000***
CFO 1.32E-10 5.255731 0.0000***
LEV 0.0239221 13.88479 0.0000***
RET 0.749221 140.5329 0.0000***
BETA 0.019293 21.06574 0.0000***
RETPASAR 0.023830 4.573869 0.0000*** R2 = 0.090191
Adj R2 = 0.09152
F = 2312.521 (0.0000)***
DW=2.335; 483 firm-year samle; Heteroscedasticity test using Breusch Pagan Godfrey and showing insignificant probability at α > 0.05; normality test using Jarque Bera, residual has a normal distribution significant at α = 0.315700
* significant at p<0.1, ** significant at p<0.05, *** significant at p<0.01
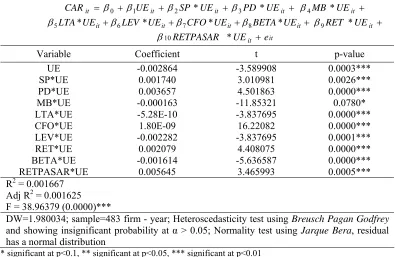
Table 4. Overall UE Regression Test Result
it it it
it UE SP UE PD UE
CAR 0 1 2 * 3 * 4MB *UEit
it it it
it LEV UE CFO UE BETA UE
UE
LTA* 6 * 7 * 8 *
5
9RET *UEit
it it e UE
RETPASAR *
10
Variable Coefficient t p-value
UE -0.002864 -3.589908 0.0003***
SP*UE 0.001740 3.010981 0.0026***
PD*UE 0.003657 4.501863 0.0000***
MB*UE -0.000163 -11.85321 0.0780*
LTA*UE -5.28E-10 -3.837695 0.0000***
CFO*UE 1.80E-09 16.22082 0.0000***
LEV*UE -0.002282 -3.837695 0.0001***
RET*UE 0.002079 4.408075 0.0000***
BETA*UE -0.001614 -5.636587 0.0000***
RETPASAR*UE 0.005645 3.465993 0.0005***
R2 = 0.001667 Adj R2 = 0.001625 F = 38.96379 (0.0000)***
DW=1.980034; sample=483 firm - year; Heteroscedasticity test using Breusch Pagan Godfrey
and showing insignificant probability at α > 0.05; Normality test using Jarque Bera, residual has a normal distribution
Based on table 4, we can conclude that hypothesis 2 in this research is supported. This research indicates that ERC’s size is affected by auditor characteristics and firm’s strategy. Auditor industry specialization and prospector strategy will result on a higher ERC than that of non auditor industry specialization and defender firm. It means that reported earnings quality is influenced by auditor industry specialization and firm’s strategy. Leverage showed negative, hence supported Dhaliwal,
et al. (1991). This condition occurs because
leverage decline year is relatively high, which by the led to a small earnings quality and negative market response. Beta or risk is also negative, which indicates that a small risk leads to qualified earnings. Firm’s size and growth are also negative, which explain that big-sized firm and growing firm have low quality earnings and are responded negatively by the market.
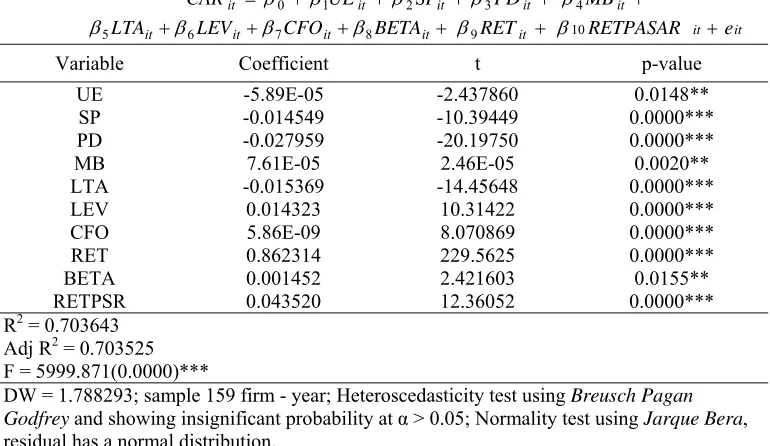
In a case of positive UE, UE correlated negatively with CAR with significance of α=0.0000. It means that when UE is small, investor will respond and will not invest its
earnings on a firm with small earnings coeffi-cient. Auditor industry specialization corre-lated negatively at α=0.0000, where firm that is not audited by the Big 4 will be responded by investor and investor will not invest its fund in that firm. Prospector-defender corre-lated positively at α=0.0000, which means that prospector firm will be responded positively by investor and it will invest in that firm. Lev-erage correlated negatively with earnings coef-ficient and is responded by investor, which is significant at α=0.0000. This finding sup-ported Dhaliwal, et al. (1991) that showed lev-erage correlated negatively. Negatively corre-lated leverage indicates that a constantly big leverage from year to year will lead to small earnings. Beta correlated negatively with CAR and significant at α=0.0000, which means that small risk will be responded by investor and they will invest on that firm. Return and mar-ket return also correlated positively with CAR and are responded by investor at α=0.0000, which means big return and market return will be responded by investor and will gain more attention from investor.
Table 5. Positive UE Regression Test Result
UE SP PD
CARit 0 1 it 2 it 3 4MBit
LEV CFO BETA
LTA 6 7 it 8
5
9RETit 10RETPASAR iteit
Variable Coefficient t p-value
UE -0.004406 -145.8332 0.0000***
SP -0.013294 -14.08625 0.0000***
PD 0.011639 13.13362 0.0000***
MB 2.82E-05 4.098196 0.0000***
LTA 0.016975 27.40366 0.0000***
CFO 1.29E-10 14.18906 0.0000***
LEV -0.000334 -0.461655 0.6443
RET 0.750338 302.1290 0.0000***
BETA -0.009358 -22.63805 0.0000***
RETPSR 0.069222 30.58636 0.0000*** R2 = 0.486571
Adj R2 = 0.486521 F = 9614.201 (0.0000)***
DW = 2.3353; sample 319 firm-year; Heteroscedasticity test using Breusch Pagan Godfrey
and showing insignificant probability at α > 0.05; Normality test using Jarque Bera, resid-ual has a normal distribution.
Table 6. Positive UE Regression Test Result
it it it
it UE SP UE PD UE
CAR 0 1 2 * 3 * 4MB *UEit
it it it
it LEV UE CFO UE BETA UE
UE
LTA* 6 * 7 * 8 *
5
9RET *UEit
it it e UE
RETPASAR *
10
Variable Coefficient t p-value
UE 0.019371 8.140759 0.0000***
SP*UE 0.002385 3.325885 0.0000***
PD*UE 0.003968 6.567321 0.0000***
MB*UE 0.000231 4.315687 0.0000*** LTA*UE -0.003247 -7.07143 0.0000*** CFO*UE 1.29E-10 22.31036 0.0000*** LEV*UE -0.002818 -5.685951 0.0000*** RET*UE -0.000838 -1.892223 0.0585* BETA*UE -0.009342 -27.83631 0.0000*** RETPSR*UE -0.022719 -11.69303 0.0000*** R2 = 0.017331
Adj R2 = 0.017234 F = 179.4481 (0.0000)***
DW = 2.065399; sample= 319 firm-year; Heteroscedasticity test using Breusch Pagan
Godfrey and showing insignificant at α > 0.05; Normality test using Jarque Bera, residual
has a normal distribution.
* significant at p<0.1, ** significant at p<0.05, *** significant at p<0.01
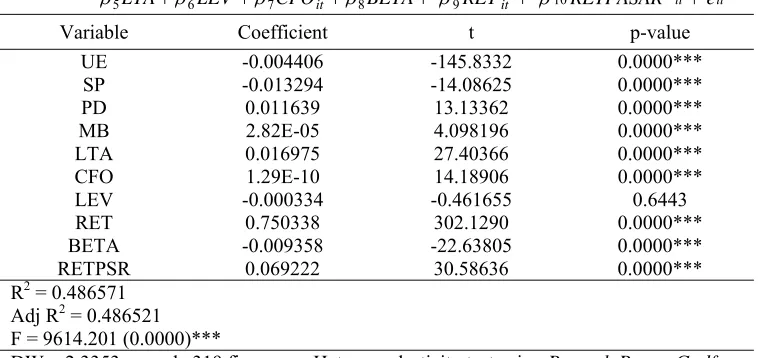
Table 7. Negative UE Regression Test Result
it it it
it UE SP PD
CAR 0 1 2 3 4MBit
it it it
it LEV CFO BETA
LTA 6 7 8
5
9RETit 10RETPASAR iteit
Variable Coefficient t p-value
UE -5.89E-05 -2.437860 0.0148**
SP -0.014549 -10.39449 0.0000***
PD -0.027959 -20.19750 0.0000***
MB 7.61E-05 2.46E-05 0.0020**
LTA -0.015369 -14.45648 0.0000***
LEV 0.014323 10.31422 0.0000***
CFO 5.86E-09 8.070869 0.0000***
RET 0.862314 229.5625 0.0000***
BETA 0.001452 2.421603 0.0155**
RETPSR 0.043520 12.36052 0.0000*** R2 = 0.703643
Adj R2 = 0.703525 F = 5999.871(0.0000)***
DW = 1.788293; sample 159 firm - year; Heteroscedasticity test using Breusch Pagan
Godfrey and showing insignificant probability at α > 0.05; Normality test using Jarque Bera,
residual has a normal distribution.
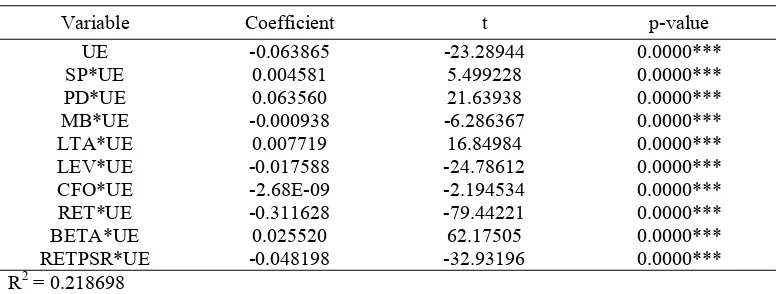
Table 8. Negative UE Regression Test Result
it it it
it UE UE SP UE PD UE
CAR 0 1 * 2 * 3 * 4MB *UEit
it it it
it LEV UE CFO UE BETA UE
UE
LTA* 6 * 7 * 8 *
5
9RET *UEit
it it e Ue
RETPASAR *
10
Variable Coefficient t p-value
UE -0.063865 -23.28944 0.0000***
SP*UE 0.004581 5.499228 0.0000***
PD*UE 0.063560 21.63938 0.0000***
MB*UE -0.000938 -6.286367 0.0000*** LTA*UE 0.007719 16.84984 0.0000*** LEV*UE -0.017588 -24.78612 0.0000*** CFO*UE -2.68E-09 -2.194534 0.0000*** RET*UE -0.311628 -79.44221 0.0000*** BETA*UE 0.025520 62.17505 0.0000*** RETPSR*UE -0.048198 -32.93196 0.0000*** R2 = 0.218698
Adj R2 = 0.218389 F = 707.3448(0.0000)***
DW = 1.909436; sample 159 firm - year; Heteroscedasticity test using Breusch Pagan
Godfrey and showing insignificant at α > 0.05; Normality test using Jarque Bera, residual has
a normal distribution.
* significant at p<0.1, ** significant at p<0.05, *** significant at p<0.01
In a case of negative UE, negative earn-ings coefficient will be responded by investor at α=0.0000. UE correlated negatively with investor’s response, which means that small earnings coefficient will be responded by in-vestor, and investor wants to know why the coefficient is small. This might be influenced by global crisis that started to take place in 2007. An increasing stock return of a firm also gain investor’s attention and correlated nega-tively with earnings coefficients at α=0.0000. Subsequently, auditor industry specialization, prospector-defender firm, and firm’s size are also correlated positively with investor re-sponse at α=0.0000. It means that a firm au-dited by an auditor industry specialization, prospector firm and big firms will be re-sponded by investor and investor will invest its fund on those firms. When UE is negative, leverage, firm’s growth, operational cash flow, return and market return correlated negatively with market response, which means that in-vestor will give more attention to a
high-lever-aged firm, high growth, and return on a small UE condition. This research result is in accor-dance with those of Easton and Zmijewski (1989) and Collins & Khotari (1989), which shows that market response on earnings is varied and depended on firm’s type and time.
CONCLUSION
factors responded by investor and gained mar-ket reaction are leverage, firm’s growth, CFO, firm’s size, firm’s stock return, beta, and mar-ket return.
REFERENCES
Aljifri, K., 2007. Measurement and Moti-vations of Earnings Management: A Critical Perspective. Journal of
Ac-counting, Business and Management, 14.
75-95
Andayani, W., Rusdi, M.K., and Haris, L.. 2008. The Influence of Good Corporate Governance to Earnings Management through Real Activities Manipulation. In: UPN Veteran Yogyakarta, Seminar
Nasional UPN Veteran Yogyakarta.
Yogyakarta, 24-25 October 2008.
Anthony, J.H., 1992. Association between Accounting Performance Measure and Stock Prices. Journal of Accounting and
Economics, 15, 203-227.
Ayers, B.C., Jiang, J., and Yeung, P.E., 2006. Discretionary Accruals and Earnings Management: An Analysis of Pseudo Earnings Targets. The Accounting
Review, 81 (3), 617-652.
Balsam, S., Khrisnan, J., and Yang, J.S., 2003. Auditor Industry Specialization and Earnings Quality. Auditing: A Journal of
Practice and Theory, 22 (2), 71-97.
Becker, C.L., Defond, M.L., Jiambalvo, J., and K.R. Subramanyam, 1998. The Effect of Audit Quality on Earnings.
Contemporary Accounting Research, 15.
1-24.
Cho, J.Y., and Jung, K., 1991. Earnings Response Coefficients: A Synthesis of Theory and Empirical Evidence. Journal
of Accounting Literature, 10, 85-116.
Choi, S. and Jeter, C.D., 1990. The Effect of Qualified Audit Opinions on Earnings Response Coefficients. Journal of
Ac-counting and Economics, 229-247.
Clikeman, P., 1998. Auditor Independence:
Continuing Controversy. Ohio CPA
Journal,57, 40-43.
Collins. D.W. and Khotari, S.P., 1989. An Analysis of Intemporal and Cross Sec-tional Determinants of Earnings Re-sponse Coefficients. Journal of
Ac-counting and Economics, 11, 143-182.
Craswell, A.T., Francis, J.R., and Taylor, S.L., 1995. Auditor Brand Name Reputation and Industy Specialization. Journal of
Accounting and Economics, 20, 297-322.
Dhaliwal, D.S., Lee, K.J., and Fargher, N.L., 1991. The Association between Unex-pected Earnings and Abnormal Security Returns in the Presence of Financial Lev-erage. Contemporaty Accounting
Re-search, 8, 20-41.
Dechow, P.M., Sloan, R.G., and Sweeney, A.P., 1995. Detecting Earnings Manage-ment. The Accounting Review, 70, 193-225.
Dunn, K.A., Mayhew, B.W., and Morsfield, S.G., 2004. Auditor Industry Specia-lization and Client Disclosure Quality.
Review of Accounting Studies, 9 (1),
35-58.
Dopuch and Simunic, 1982. The Competition in Auditing: an Assessment in Fourth. In: University of Illinois at Urbana-Champaign, Symposium on Auditing
Research. Illinois: University of Illinois
at Urbana Champaign.
Easton, P.D. and Zmijewski, M.E., 1989. Cross-Sectional Variation in the Stock Market Response to Accounting Earnings Announcements. Journal of Accounting
and Economics, 11 (2), 117-141.
Habbe, H.A., and Hartono, J., 2001. Studi terhadap Kinerja Akuntansi Perusahaan Prospektor and Defender: Analisis dengan Pendekatan Life Cycle Theory [The Study in Prospector and Defender Companies’ Accounting Performance using Life Cycle Theory Approach].
Hayn, C., 1995. The Information Content of Losses. Journal of Accounting and
Economics, 20, 125-153.
Hibrar, P. and Collins, D.W., 2002. Errors in Estimating Accruals: Implications for Empirical Research. Journal of
Ac-counting Research, 40, 105-134.
Hogan, C.E. and Jeter, D.C., 1999. Industry Specialization by Auditors. Auditing: A
Journal of Practice and Theory, 18, 1-18.
Ittner, C.D., Larcker, D.F., and Randall, T., 2003. Performance Implications of Strategic Performance Measurement in Financial Services Films. Accounting,
Organization and Society, 28, 715-741.
Jensen, M.C. and Meckling, M.H., 1976. Theory of the Firm: Managerial Behaviour, Agency Costs and Ownership Structure. The American Economic
Review, 3, 305-360.
Jones, J.J., 1991. Earnings Management du-ring Import Relief Investigation. Journal
of Accounting Research, 29, 193-228.
Johnson, P., Jamal, K., and Berryman, R., 1991. Effects of Framing on Auditor Decision. Organization Behavior and
Human Decision Processes, 50 (1),
75-105.
Kasznik, R., 1999. On the Association between Voluntary Disxlosure and Earnings Management. Journal of
Accounting Research, 37, 57-81.
Kothari, S.P., Leone, A.J., and Wasley, C.E., 2005. Performance Matched Dis-cretionary Accrual Measures. Journal of
Accounting and Economics, 39, 163-197.
Krishnan, G.B., 2003. Does Big 6 Auditor Industry Expertise Constrain Earnings Management. Accounting Horizons,
Supplement, 1-16.
Maletta, M. and Wright, A., 1996. Audit Evi-dence Planning: an Examination of In-dustry Error Characteristics. Auditing: A
Journal of Practice and Theory, 15 (1),
71-85.
Mayangsari, S., 2003. Analisis Pengaruh Independensi, Kualitas Audit serta Mekanisme Corporate Governance ter-hadap Integritas Laporan Keuangan [Analysis of the Influence of Indepen-dency, Audit Quality, and Corporate Governance Mechanism towards Finan-cial Report’s Integrity]. SNA VI
Surabaya.
Mayangsari, S., 2004. Bukti Empiris Pengaruh Spesialisasi Industri Auditor terhadap Earnings Response Coeffient [Empirical Evidence of the Influence of Auditors Industry Specialization towards Earnings Response Coefficient]. Jurnal Riset
Akuntansi Indonesia, 7, 154-178.
Miles, R. and Snow, C., 1978. Organizational
Strategy, Structure and Process. New
York: McGraw Hill.
O’Keefe, T., King, R., and Gaver, K., 1994. Audit Fees, Industry Specialization, and Compliance with GAAS Reporting Stan-dards. Auditing: A Journal of Practice
and Theory, 13, 41-55.
Olson, E.M., Stanley F.S., and Hult, G.T.M., 2005. The Importance of Structure and
Process to Strategy Implementation.
Indiana: Kelley School of Business, Indiana University.
Healy, Paul M. and Palepu, K.G., 2004.
Business Analysis and Valuation: Using
Financial Statements. Mason: South
Western Cengage Learning.
Pittman, J.A. and Fortin, S., 2004. Auditor Choice and the Cost of Debt Capital for Newly Public Firms. Journal of
Accounting Economics, 37, 113-136.
Roychowdury, S., 2006.Management through Real Activities Manipulation. Journal of
Accounting and Economics, 42 (3),
335-370.
Sanjay, K., 1994. Dividend Payout Ratio as Determinants of Earnings Response Coefficients. Journal of Accounting and
Saraswati, E. and Atmini, S., 2007. Reaksi Pasar terhadap Pengukuran Kinerja Akuntansi Perusahaan Prospector dan Defender: Bukti Tambahan untuk Pe-riode Setelah Krisis [Market Reaction towards Prospector and Defender Companies’ Accounting Performance Evaluation: Additional Evidence for Post-Crisis Period]. In: Universitas Hasanuddin, SNA X UNHAS. Makassar, 26-28 July 2007.
Scott, W.R., 2006. Financial Accounting
Theory. 4th ed. Toronto: Pearson
Prentice-Hall.
Solomon, I., Shields, M., and Whittington, R., 1999. What Do Industry-Specialist Audi-tors Know? Journal of Accounting
Re-search, 37 (1), 191-208.
Siregar, N.P., Veronica, S., and Siddharta, U., 2006. Pengaruh Struktur Kepemilikan, Ukuran Perusahaan, dan Praktik Corporate Governance terhadap Penge-lolaan Laba (Earnings Management)
[Influence of Ownership Structure, Com-pany Size, and Corporate Governance Practice towards Earnings Management].
Jurnal Riset Akuntansi Indonesia, 9 (3),
307-326.
Teoh, S.H. and Wong, T.J., 1993. Perceived Auditor Quality and the Earnings Response Coefficient. The Accounting
Review, 68 (2), 346-366.
Teets, W.R., and Wasley, C.E., 1996. Esti-mating Earnings Response Coefficients: Pooled versus Firm Specific Models.
Journal of Accounting Economics, 21,
279-295.
Watts, R.L., and Zimmerman, J.L., 1986.
Positive Accounting Theory. New Jersey:
Prentice-Hall.
Woodside, A.G., Sullivan, D.P., and Trappey, R.J., 1999. Assessing Relationship among Strategic Types, Distinctive Marketing Competencies, and Organi-zational Performance. Journal of