Vol. 17, No. 4, 2002, 361 - 371
THE IMPACT OF ASIAN FINANCIAL CRISIS ON STOCKS’
BEHAVIOR: EVIDENCE FROM JAKARTA STOCK EXCHANGE
1Eduardus Tandelilin Universitas Gadjah Mada
ABSTRAK
Penelitian ini menguji pengaruh krisis keuangan di Asia terhadap prilaku saham di Bursa Efek Jakarta (BEJ). Secara spesifik tujuan penelitian ini adalah, pertama melihat perubahan likuiditas, aktivitas perdagangan, dan volatilitas return saham di BEJ dari periode sebelum krisis keuangan. Kedua, menguji stabilitas variabel-variabel yang menetukan likuiditas saha m di BEJ ketika terjadi krisis keuangan.
Penelitian ini menggunakan paired t-tests, non-parametric sign tests, dan analisis regresi untuk menguji dampak krisis keuangan. Hasil penelitian menunjukkan bahwa bid-ask spread, depth, aktivitas perdagangan, dan volatilitas meningkat signifikan selama krisis. Hasil keseluruhan menunjukkan bahwa krisis keuangan meningkatkan biaya transaksi investor kecil dan investor yang mengalami panik. Hasil penelitian juga menunjukkan penentu spread dan depth adalah harga, volume, dan volatilitas. Namun variabel penentu ini tidak stabil dari periode sebelum dan selama krisis keuangan, pengecualian untuk harga saham.
Keywords: bid-ask spread, depth, trading activity, financial crisis.
1 This paper is prepared for the In Memoriam Prof. Bambang Riyanto National Seminar of Financial Management at the Faculty of Economics Gadjah Mada University, 28 September 2002.
INTRODUCTION
The Asian crisis began in the middle of 1997 with the devaluation of the Thai bath followed by currency collapse in Indonesia and other Asian countries. In Indonesia, some economic indicators showed a dramatic downward movement following the start of the financial crisis. The growth rate of Indonesia’s Gross Domestic Product (GDP) decreased from 7.98 percent in 1996 to –13.7 percent in 1998. The level of inflation increased from 6.47 percent in 1996 to 77.63 percent in 1998. The exchange rate (Rupiah (IDR) per US$) deteriorated from 2,383 in 1996 to 8,025 in 1998. The SBI increased from 12.26 percent in 1996 to 37.84 percent in 1998. One-month
time deposits increased from 16.92 percent annually in 1996 to 41.42 percent in 1998.
All of these factors would surely have negative impacts on the Indonesian capital market. The Jakarta Stock Exchange (JSX) Composite Index decreased by 37 percent at the end of 1997 and continued decreasing in 1998.
their holding of stocks, and perhaps moving their capitals to the United States and other safer countries (Higgins and Klitgaard, 2000). Thus, the financial crisis could lead to lower liquidity and lower trading activity. Moreover, the panic in the capital market might hurt investors’ ability to estimate the fundamental value of the listed stocks. Consequently, the stock prices were becoming highly volatile.
Liquidity, trading activity, and volatility are important features of capital markets. A better understanding of their changes may increase the credence of capital markets, investors, and listed companies. It must also be noted that many previous researches have documented that liquidity was associated with stock prices, trading activity, and returns’ volatility. Hence, previous researches have provided empirical evidences in the different markets (Stoll, 1978; McInish & Wood, 1992; Aitken & Frino, 1996).
Research Objectives
Despite of the importance of research in stocks’ behaviors, this study makes a first-pass attempt to providing an analysis of the impact of Indonesian financial crisis on JSX performance.2 There are two objectives of this research that have been yet satisfactorily studied, e.g.:
1. To highlight the changes in liquidity, trading activity, and returns’ volatility of stocks in JSX from periods before to during the financial crisis.
2. To examine the stability of the determinants of stocks’ liquidity in JSX due to the presence of the financial crisis.
2 Wang (2000) studied the impact of trade by foreign
investors on market (JSX Composite Index) volatility, conditioning by financial crisis in Indonesia. Otchere and Chan (2000) examined the short-run overreaction hypothesis on the Hong Kong Stock Exchange using data from March 1996 to June 1998. Although their study periods encompassed the pre- and during Asian financial crisis periods, the concerns of both studies were not on the impact of the financial crisis.
THE BRIEF HISTORICAL BEHAVIOR
OF JAKARTA STOCK EXCHANGE
LISTED STOCKS (1993 – 1998)
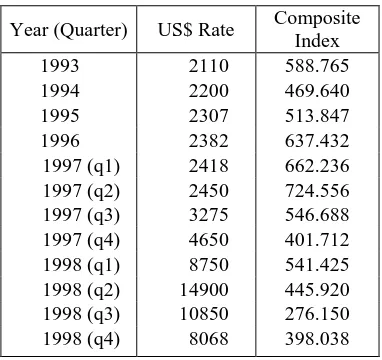
Table 1 shows briefly the US$ rate and the JSX Composite Index from 1993 to 1998. As the table makes obvious, the available history of Indonesian equities can be divided into two distinct periods. From 1993 through second quarter of 1997, there was an up market movement in the Indonesian capital market. After the middle of 1997, the trend was reversed, a downward market movement prevailed.
Table 1. The Jakarta Composite Index and the Rupiah/US$ Exchange Rate
Year (Quarter) US$ Rate Composite Index were no apparent fluctuations in the US$ rate. Even the pattern of the JSX Composite Index showed an increasing trend and achieved the highest level in the second quarter of 1997. Clearly, the Indonesian stock market experienced a bull run in the period from 1993 through the middle of 1997.
declined fast against dollar and achieved the extreme rate in the second quarter of 1998. The JSX Composite Index also showed a similar phenomenon. The index level declined below 500, i.e., the psychological limit believed by many participants in Indonesian capital market. Unanimously, the JSX experienced a bear run in the period from the middle of 1997 to the end of 1998.
Trading Characteristics in the Jakarta Stock Exchange
The JSX is the primary exchange operating in Indonesia. As of the second quarter of 1997, 265 companies were listed on the exchange and asks entered continuously by exchange members. There are no exchange-designated market makers that act like specialists in New York Stock Exchange or multiple market also trade in their own names.
Prices resulting from orders and the negotiation between buyers and sellers, which do not compete with the regular board. Transaction on the regular board is the largest, representing 80.26 percent of shares volume, 77.87 percent of trading value, and 97.22 percent of trading frequency in 1998.
Orders placed on the regular board are matched according to price and time priority. Orders may be amended or withdrawn prior to execution, but only limit orders may be entered. Typically, orders expire at the end of each exchange day. During the period of the study, the minimum price variation (tick size) for JSX’s stocks was Rp25. To improve the market performance, JSX decreased its tick size on July 3, 2000. Such study is our concern in another research (Tandelilin & Purwoto, 2001).
LITERATURE REVIEW
This section presents a possible explanation of the impact of the financial crisis on liquidity. It also discusses the relationship among liquidity, trading activity, stock prices, and returns’ volatility documented in the how cheaply investors can trade an asset when they want to. Many researchers of liquidity-related studies commonly use bid-ask spread (the difference between ask price and bid price) as the indicator of liquidity. Amihud and Mendelson (1998) showed that an important component of liquidity was the spread between the bid and ask prices at which dealers were willing to satisfy sellers’ and buyers’ demand for immediate execution of their transactions. Trading at the quoted bid and ask prices saves traders from any associated delays and difficulties, but at a cost. Thus, lower spread means higher liquidity.
events that provoke order imbalances and thereby causing inventory overload. The paradigm suggests that inventory accumulation concern is more important in down markets. A down market may be characterized by frenzied selling (in contrast to steady buying in rising markets), so inventory problem can be accu-mulated to dealers. Dealers must capture strongly the inventory cost in down market movement. Thus, spread usually increases in down markets. On the other hand, rising markets attract more investors, thus increasing liquidity.
Market microstructure literatures have long revealed the determinants of spread and depth. Stoll (1978) and McInish and Wood (1992) studied the determinants of spread in the US market, and suggested that there were three fundamental variables used in cross-section modeling of dealer spread: (1) stock prices, (2) trading activity, and (3) volatility. These determinants of spread were also found in different market structures where the market makers were not present (Aitken and Frino 1996).
The following briefly summarizes the previous researches on the explanatory variables of spread:
1. Trading activity was negatively related to spread, since limit orders of thinner stocks had a lower probability of execution. Accordingly, market participants were less likely to submit limit orders, hence reducing the downward pressure on spread.
2. Spread tended to be high in high volatility because high volatility hurt the liquidity suppliers.
3. The absolute spread increased with the price level to balance the execution cost. However, the percentage spread was inversely related to price level subsequent to the minimum tick rule.
However, liquidity is a complex term. Literatures also note that overall liquidity should include not only the price dimension to accept orders flow without large changes in price.
Also, the association among depth and those three explanatory variables is known to be in the opposite direction of the absolute spread. This is possible because a natural relation exists between spread and depth. As a rule, the greater the spread, the greater the depth since traders will desire to sell more at a higher price and buy at a lower price (Harris, 1997).
RESEARCH METHOD Data
This study utilizes daily data from the List of Securities’ Quotations published by the JSX. The list contains trades in the regular board and includes a stock’s code, name, closing prices, trading frequency, volume in shares, volume in rupiah, and price and number of shares at the best closing quote.
Sampling
The sampling period is chosen from the beginning of 1996 to the end of 1998, covering the Indonesian financial crisis. Among all common stocks listed in the beginning of 1996, this study excludes stocks delisted during the sampling period.
This categorization of the both periods (before and during the crisis) is comparable to other studies of the Asian crisis. Otchere and Chan (2000) defined the first period consisting of 336 trading days from March 25, 1996 to July 31, 1997. The second period comprises 224 trading days and coincides with the Asian financial crisis period from August 1, 1997 to June 30, 1998. Wang (2000) distinguished the period before and after the Indonesian financial crisis as from January 1, 1996 to August 3, 1997 (390 trading days) and from August 4, 1997 to October 10, 1998 (290 trading days).
Variables and Measures 1. Liquidity
Liquidity is operationalized by using two metrics: (1) bid-ask spread and (2) market depth. Following the most common way to measure spread; this study calculates spread on a percentage of the bid-ask midpoint. For the empirical estimation, we define the following variable for each stock:
Bid-ask spread = the difference between the lowest ask price and the highest bid price divided by the midpoint of the quote (in %).
The standard measure of depth is at the best quote. This study measures depth by calculating ask depth and bid depth. The depth measure is separated between ask depth and bid depth since the changes in depth may be asymmetrical. For each stock, we define the following variables:
Ask depth = the number of shares at the lowest ask price.
Bid depth = the number of shares at the highest bid price.
2. Trading Activity
This study calculates the following measures of trading activity on a daily basis:
Shares volume = the total shares of transaction during the day.
Trading frequency = the total number of transactions (trades) during the day.
3. Return Volatility
To estimate the returns’ volatility, we compute daily returns’ standard deviation based on data from each period. Returns are examined according to the closing prices. However, the volatility of the returns will be affected by the movement of prices between the bid and ask quotes. Hence, an increase in trade-price returns’ volatility will be expected in the period of during the crisis if the spread widens. We therefore examine the volatility of returns computed from closing quotation midpoints. For each stock in each period, we measure the following variables:
Price returns’ volatility = standard
deviation of daily returns, where the returns are calculated from the closing prices.
Mid-quote returns’ volatility = standard deviation of daily returns, where the returns are calculated from the closing midpoints of ask prices and bid prices.
Data Analysis
1. Univariate Data Analysis
To test whether the liquidity, trading acti-vity, and returns’ volatility change following the financial crisis, we use a paired comparison approach. To determine the significance of the differences, we follow these procedures:
1. Time-series averages of the liquidity and trading activity measures are calculated in the pre- and during crisis periods for each stock. To calculate the volatility measure, the cross-sectional statistics are determined directly as in step (b).
from the time-series averages for each period.
3. Finally, two statistical tests, the parametric paired t-test and non-parametric sign test, are used to test whether the changes in the variables from pre- (1996) to during crisis period (1998) are significant.
The purpose of the parametric paired t-test is to investigate the change in mean value, while the non-parametric sign test focuses on the significance of the proportion of the stocks experiencing changes. Moreover, frequency distribution of the interested variables is usually skewed, and thus does not conform well to the normality assumption.
2. Regression Analysis
Next, we use ordinary least squares (OLS) regression to explain the determinants of the bid-ask spread and depth for the 1996 and 1998 samples and to test whether the observed cross-sectional relationship is stable across the two periods.
We follow Aitken and Frino (1996) as the basis for our model of the bid-ask spread with slight modifications. Our model specification is:
Ln Liquidityj,t = + 1 Ln Pricej,t +
2 Ln Volumej,t +
3 Ln Volatilityj,t (1)
Where:
Liquidityj,t = the average of each liquidity
measure (spread and depth) for stock j in year t (1996 or 1998).
Pricej,t = the average daily closing shares
price for stock j in year t.
Volumej,t = the average daily shares volume
for stock j in year t.
Volatilityj,t = the standard deviation of the
daily price returns for stock j in year t.
Technically, we follow these procedures:
a. For each spread and depth measure as dependent variable, we run the regression for both periods, before (1996) and during the financial crisis (1998). The objective is to test the significance of the relationship between the dependent variables and the independent variables in each year.
b. Then, for comparing these two regressions for 1996 and 1998, we use the dummy variable approach (Gujarati, 1995). This approach has some advantages over the Chow test. In doing so, we pool all observations of 1996 (period of before the financial crisis) and 1998 (during crisis period) samples using a full set of dummy interaction terms for both 1996 and 1998.
In doing the dummy variable approach, we develop regression as from Equation (1) for each of the liquidity measure:
Ln Liquidityj,t = 1 + 1 Ln Pricej,t +
2 Ln Volumej,t + 3 Ln Volatilityj,t +
2 (Dj,t) + 4 (Dj,t) Ln Pricej,t +
5 (Dj,t) Ln Volumej,t +
6 (Dj,t) Ln Volatilityj,t (2)
Where, Dj,t = the dummy variable for stock
j, which is assigned the value 0 for the period of before the financial crisis (t = 1996) and 1 for the period during the financial crisis (t = 1998).
Pooling enables us to test whether each variable’s coefficients for 1996 and 1998 are virtually different. Specifically, this metho-dology enables this study to examine whether the differences in period of before and during the financial crisis found in univariate data analysis are:
variable’s mean but not in the parameter estimation of those variables.
b. Due to changes in the underlying relation-ship between liquidity measure and independent variables. Changes of the underlying relationship between liquidity and the determinants will appear as differences across periods in the parameter estimates for a given variable.
c. Due to other unexplained factors. Diffe-rences in liquidity due to unexplained factors will show up as differences in the intercepts for the two periods.
RESULTS AND DISCUSSION
Among all common stocks listed in the beginning of 1996 (238 stocks), this study excludes 2 stocks that were delisted during the sample period, leaving a total of 236 stocks as the samples.
Spread and Depth
Table 2 compares the examined variables from the pre- to during crisis period. The percentage bid-ask spread increased rapidly by 11.51 percent from 11.08 percent in 1996 to
22.59 percent in 1998. About 86 percent of the samples experienced an increase in bid-ask spread. All test statistics, the parametric paired t-tests and the non-parametric sign tests, reject the null hypothesis that there is no change in bid-ask spread from 1996 to 1998.
Ask depth and bid depth also increased sharply by 430,000 shares or 750 percent from 60,000 shares in 1996 to 490,000 shares in 1998. About 66 percent of the samples experienced an increase in depth. The null hypothesis that there is no change in depth from 1996 to 1998 is not substantiated using the parametric paired t-tests and the non-parametric sign tests.
The Indonesian financial crisis caused an increase in bid-ask spread, thereby increasing the cost of transaction for small investors. However, depth also enhanced significantly during the financial crisis. These results are consistent with the natural relation of spread and depth that is the greater the spread, the greater the depth. The findings also indicate that the increase of the transaction cost is compensated by the larger number of shares traded by investors.
Table 2. Univariate Results
This table shows the average percentage bid-ask spread, market depth, trading activity, and returns’ volatility in the period before (1996) and during (1998) the financial crisis. Also reported is the average change between the two periods and the percentage of stocks with increase. The t-statistic is calculated by using a parametric paired t-test to test the null hypothesis that the mean change is zero. The z-statistic is calculated by using a non-parametric sign test to test the null hypothesis that the percentage of the stocks that experienced an increase equals 50.
1996 1998 Change t-statistic % of stocks
with increase z-statistic
Bid-ask spread 11.08 22.59 11.51 9.43*** 85.71 10.79***
Ask depth 62581.66 484743.23 422161.57 3.74*** 66.67 5.03***
Bid depth 63617.00 525438.70 461821.70 4.30*** 66.81 5.13***
Shares volume 299013.81 1004841.08 705827.27 4.77*** 56.78 2.02**
Trading frequency 27.18 41.52 14.34 3.99*** 47.46 0.72
Price returns’ volatility 0.04 0.08 0.05 16.71*** 88.56 11.78*** Mid-quote returns’
volatility
0.05 0.09 0.04 13.66*** 88.74 11.71***
Trading Activity
The transaction volume increased by 705,827 shares or 236 percent from 299,014 shares in 1996 to 1,004,841 shares in 1998. The proportion of stocks that increased was relatively equal to those that decreased. All test statistics, the parametric paired t-tests and the non-parametric sign tests, reject the null hypothesis that there is no change in volume from 1996 to 1998.
For the number of trades, a similar pattern emerged. The average increase in the trading frequency was 14 per day from 27 in 1996 to 41 in 1998. The increase is significant at 0.01 level using the parametric paired t-tests.
The results suggest that the financial crisis did not lower the activity to transact among investors. It may be exciting and amazing to know this evidence. The possible explanation is that the investors are in panic condition for the negative expectation of the capital stocks, pushing their intention to get out from the market, and hence increasing the trading volume and frequency.
Volatility
For the same reason of the panic investors, the evidence from the returns’ volatility shows the expected results. The volatility of return, measured by both the prices and mid-quote returns’ volatility, increased about 100 percent from 1996 to 1998. The increase of volatility is significant at 0.01 level using the parametric paired t-tests and the non-parametric sign tests.
Regression Results
This section uses the regression analysis to investigate whether spread and depth are determined by share prices, volume, and
volatility, and whether the determinants are stable from the pre- to during crisis period. Panel A of Table 3 presents multiple regression results for both 1996 and 1998. Each variable is statistically significant in elaborating 1996 spread and is significant as well in explaining 1998 spread. The observed signs are same with the empirical results of Aitken and Frino (1996) and the same for both 1996 and 1998 periods. Furthermore, all 3 combined variables explain about 75 percent variation in spread. The F value is highly significant, implying that the models as a whole are significant.
Panel B of Table 3 also presents multiple regression results for bid depth. For ask depth, the result shows a similar pattern and is not reported. All coefficients have the predicted signs and the same for both 1996 and 1998. Each variable is statistically significant in explaining 1996 depth and is also significant in explaining 1998 depth. Moreover, all 3 combined variables explain about 75 percent variation in depth as in spread. The F value is also highly significant, implying that the models as a whole are significant.
Table 3. Regression Results: The Determinants of the Spread and Depth
This table reports the results of the cross-sectional regression for Ln Bid-Ask Spread in 1996 and 1998 (Panel A) and Ln Bid Depth in 1996 and 1998 (Panel B) to Ln Price, Ln Volume, and Ln Volatility.
1996 1998
Coefficient t-statistic Coefficient t-statistic Panel A: Ln Bid-Ask Spread
Intercept 10.62 22.28*** 8.71 29.59***
Ln Price -0.39 -7.73*** -0.41 -11.55***
Ln Volume -0.40 -26.47*** -0.26 -19.83***
Ln Volatility 0.43 5.72*** 0.16 2.24**
R Square 0.77 0.72
F-value 257.45 197.82
Panel B: Ln Bid-Depth
Intercept 6.90 11.75*** 7.93 12.70***
Ln Price -0.39 -6.17*** -0.55 -7.39***
Ln Volume 0.45 23.94*** 0.54 19.14***
Ln Volatility -0.44 -5.02*** -0.30 -2.00**
R Square 0.75 0.77
F-value 224.06 250.220
*** Significant at the 0.01 level ** Significant at the 0.05 level * Significant at the 0.10 level
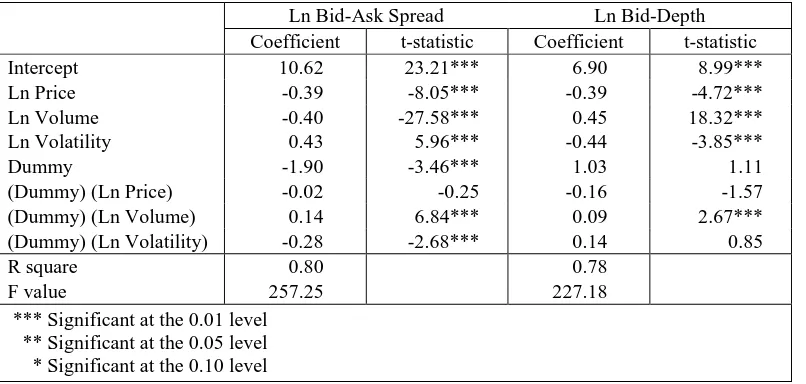
Table 4. Regression Results: The Stability of the Coefficients
This table reports the results of the cross-sectional regression for Ln Bid-Ask Spread and Ln Bid Depth to Ln Price, Ln Volume, Ln Volatility, Dummy (0 for 1996 or 1 for 1998), (Dummy) (Ln Price), (Dummy) (Ln Volume), and (Dummy) (Ln Volatility).
Ln Bid-Ask Spread Ln Bid-Depth
Coefficient t-statistic Coefficient t-statistic
Intercept 10.62 23.21*** 6.90 8.99***
Ln Price -0.39 -8.05*** -0.39 -4.72***
Ln Volume -0.40 -27.58*** 0.45 18.32***
Ln Volatility 0.43 5.96*** -0.44 -3.85***
Dummy -1.90 -3.46*** 1.03 1.11
(Dummy) (Ln Price) -0.02 -0.25 -0.16 -1.57
(Dummy) (Ln Volume) 0.14 6.84*** 0.09 2.67***
(Dummy) (Ln Volatility) -0.28 -2.68*** 0.14 0.85
R square 0.80 0.78
F value 257.25 227.18
In Column 5 of Table 4, the statistical tests of interaction variables indicate significant changes in the coefficients of volume for depth as dependent variable. Coefficient of price is also stable, similar with that is found in spread as dependent variable. Once again, the F value is highly significant, implying that the overall determinants of spread and depth are not stable from 1996 to 1998. The determinant that does not change is primarily the prices of shares. It is the impact of the financial crisis that changes the coefficients of the independent variables.
CONCLUSIONS
This study uses daily data from the Jakarta Stock Exchange to examine the impact of the financial crisis on the stocks’ behavior. The crisis resulted an increase in bid-ask spread, thereby increasing the cost of transaction for small investors. However, depth also increased substantially during the crisis. The crisis led the investors to panic situation, accordingly increasing the trading activity and volatility of the traded stocks. The findings also show that the determinants of both spread and depth are price, volume, and volatility for 1996 and 1998. However, these determinants are not stable from 1996 to 1998, with one exception of the prices of shares.
REFERENCES
Aitken, M., and A. Frino. 1996. The Determinants of Market Bid Ask Spreads on the Australian Stock Exchange: Cross-sectional Analysis. Accounting & Finance 36: 51 – 63.
Amihud, Y., and H. Mendelson. 1988. Liquidity and Asset Prices: Financial Management Implications. Financial Management 17: 5-15.
Bonser-Neal, C., D. Linnan, and R. Neal. 1999. Emerging Market Transaction Costs: Evidence from Indonesia. Pacific-Basin Finance Journal 7: 103 – 127.
Chordia, T., R. Roll, and A. Subrahmanyam. 2001. Market liquidity and trading activity. Journal of Finance 56: 501-530.
Domowitz, I., J. Glen, and A. Madhavan. 2000. Liquidity, Volatility, and Equity Trading Costs across Countries and Over Time. Working paper, Pennsylvania State University.
Harris, L. 1997. Decimalization: A Review of Arguments and Evidence. Working Paper, Marshal School of Business at University of Southern California.
Higgins, M., and T. Klitgaard. 2000. Asia’s Trade Performance after the Currency Crisis. FRBNY Economic Policy Review, September: 37 – 49.
JSX Statistics 1998. Jakarta Stock Exchange.
Madhavan, A. 1992. Trading Mechanism in Securities Markets. Journal of Finance 47: 607-641.
McInish, T., and R. Wood. 1992. An Analysis of Intraday Patterns in Bid/Ask Spreads for NYSE Stocks. Journal of Finance 47: 753-762.
Niemeyer, J., and P. Sandas. 1994. Tick Size, Market Liquidity and Trading Volume: Evidence from the Stockholm Stock Exchange. Working Paper, Stockholm School of Economics.
Nasdaq Stocks. Journal of Finance, Vol. 33, No. 4, pp. 1153-1173.
Tandelilin, E., and L. Purwoto. 2001. The Impact of the Tick Size Reduction on Liquidity: Empirical Evidence from the
Jakarta Stock Exchange. Working paper, Gadjah Mada University.