Vol. 16, No. 1, 2001, 64 - 73
CONFLICT OF INTEREST PROBLEM
IN THE MANAGEMENT-CONTROLLED FIRMS
Dewi Ratnaningsih
Atma Jaya Yogyakarta University
Jogiyanto Hartono
Gadjah Mada University Yogyakarta
ABSTRACT
This study hypothesizes that the conflict of interest problem exists in the management-controlled firms. The problem does not exist in the owner-controlled firms. This study supports these hypotheses.
The conflict of interest problem occurs in the management-controlled firms because managers tend to emphasize their wealth by increasing sales or profit but stock returns at the expense of shareholders’ wealth. Shareholders are more concerned with the increase of stock returns, which is related directly to their wealth. On the other hand, in the owner-controlled firms, since the managers are also the owners of the firms, the conflict of interest problem does not exist.
The conflict of interest problem still persists even though CEOs have been compensated well. The problem cannot be solved by how much CEOs are paid, but by how they are paid. The problem can be reduced by designing compensation scheme that increases the ownership of the CEOs. This situation had already been recognized by the U.S. firms, that of the 374 firms in the sample, 80% or 300 firms are the owner-controlled firms.
Keywords: Compensation, conflict of interest, agency relationship.
INTRODUCTION
This paper addresses the issue that even though executives have been compensated well, there is still a conflict of interest between CEOs and shareholders in the agent principal relationship. This problem occurs in the management-controlled firms. The problem occurs because in the management-controlled firms, CEOs, as the owners of the company, usually emphasize their own wealth at the
expense of the shareholders’ wealth.
The conflict of interest between a CEO as an agent and the shareholder as a principal occurs because they both have different objectives. Even though a CEO reports to the
board of directors, who represent the share-holders, the board is generally ineffective in monitoring the CEO's actions. Since the CEO's actions are not observable by the shareholders, a CEO must be compensated to take actions in the best interest of shareholders. Even though CEOs have been compensated well, if they are not the owners, the conflict of interest problem
still exits. A CEO’s compensation seems to be
the $ 179 billion net profits of those companies. So, the question is not how much CEOs are paid, but how they are paid (Jensen and Murphy, 1990).
CEOs may be tempted to maximize their own wealth rather than the shareholders' wealth. This situation is well described by Simon (1986) when he relates the comment of Ponderosa's shareholders: "Here's a company where management comes first, and the shareholders, if they come in at all, are away at the end of the cafeteria line."
Some observers link this shareholders' problem with the way CEO compensation is tied to the sales volume or profit. If CEO compensation is tied to the sales volume or profit, CEOs will pay less attention to the
performance of the firms’ stock returns. The
conflict of interest exists because CEOs as managers will try to increase sales or profit to increase their compensations. Increasing sales or profit is not necessarily increasing
shareholders’ wealth, since sales and profit can
be manipulated for the benefit of the managers at the expense of the shareholders. The wealth of the shareholders is related to the increase of
the firms’ stock prices, since stock prices
determine the gain that shareholders would receive if they sold their shares.
The conflict of interest problem is severe for the management-controlled firms which their CEOs are only hired managers. The problem does not exist for the owner-controlled firms, as their CEOs are the shareholders of the firms. Therefore, the objectives of this paper is to examine whether the conflict of interest between managers and shareholders exists for management-controlled firms and does not exist for the owner-controlled firms. The conflict is shown by the way managers concentrate on the sales or profit rather than on stock returns to increase their compensations.
REVIEW OF THE LITERATURE AND HYPOTHESES
The first research on CEO compensation was conducted by Roberts (1959). Using a sample of 1,414 firms for period of 1935-1950, he found that sales volume was related to CEO compensation. A following study using 45 firms of 1953-1959 period by McGuire, Chiu and Elbing (1963) supported Robert's finding that sales volume was related to CEO compensation.
Later research found that there was a stronger correlation between profit and CEO compensation than that with sales volume. Lewellen and Hunstman's (1970) study invol-ving 50 firms from 1942 to 1963 concluded that profit was related to CEO compensation and that size (sales volume) had no effect. Prasad (1974) conducted research on a group of managers rather than a single individual CEO and his findings also suggested that profit was a better predictor of managers compen-sation.
A study by Murphy (1985) for example, involving the 73 largest U.S. manufacturing firms from the period of 1964 to 1981 reported that shareholder return (measured by stock return) was positively related to executive compensation. The next study by Jensen and Murphy (1990) using 1,295 companies from 1974 to 1986 supported this notion that shareholder wealth was positively related to CEO compensation.
CEO compensation for management-controlled firms.
Increasing sales volume or profit is easier than increasing stock returns. Increasing sales volume or profit does not always mean increasing the wealth of the shareholders, because managers can manipulate those numbers by using accounting methods. But increasing stock returns does increase the wealth of the shareholders. Since CEOs in management-controlled firms are only hired managers not the owners of the firms, they controlled firms tend to increase not only sales or profit but also to increase stock returns. This leads to the alternative hypotheses as follows.
H1 : In management-controlled firms, sales or profit rather than stock returns is more likely to be the primary determinant for CEO compensation.
H2 : In owner-controlled firms, sales, profit and stock return are more likely to be the primary determinant for CEO compen-sation.
EMPIRICAL SECTION Sample
Data for this study were collected from several sources as follows.
1. CEO compensation and firm performance data were obtained from the May 1993
175 were disqualified because of unavailability of five years of compensation data. To eliminate sample selection bias that long-term compensation was really received by execu-tives as CEOs, they must be in CEO positions at least for five years.1
One hundred forty six (146) observations were disqualified, because CEOs were in the firms for less than five years and 27 observations were also disqualified because long-term compensation covered less than five-year period. Ten observations were also dropped because average five year return data were not available. This reduces the sample taken from Forbes Magazine to 442 observations. Because Forbes does not give
firms’ assets data, these data were taken from
the 1993 Special Bonus Issue of Business Week Magazine. Sixty-eight observations were again dropped because the companies were not listed in Business Week. The final sample consists of 374 observations. Table 1 presents this sample selection procedure.
This study classified the data into two groups, one belonging to management-controlled firms and another belonging to owner-controlled firms. Following Gomez-Mejia, Tosi & Hinkin (1987), a firm in which the CEO owns or controls 4 percent or more of stocks is considered an owner-controlled firm, otherwise it is considered as a
Table 1. The Sample Selection Procedure.
Number of CEOs listed in Forbes Survey 1993 800
Incomplete data due to:
- compensation data not available 175
- covers less than five-year period 27 - CEO in a firm for less than 5 years 146 - Average five-year returns not available 10 Total incomplete data from Forbes 356
---- -
Total number of sample obtained from Forbes 442
Asset data not available in Business Week 68
---- -
Final sample 374
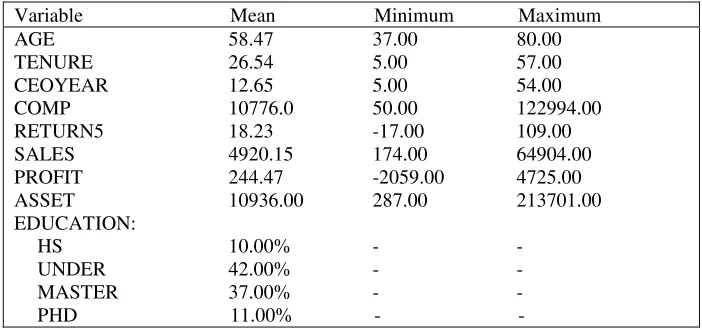
Summary statistics describing selected characteristics of the sample under investi-gation are presented in Table 2. The CEO's ages range from 37 to 80 years, with average of 58.47 years. The CEO's tenures range from 5 to 57 years. On average, the CEOs had been employed by the firms for 26.54 years and as CEOs for 12.65 years. Ten percent of the CEOs have education less than undergraduate level. More CEOs hold undergraduate degree (42%) and master degree (37%). Ph.D. accounts for 11% for CEOs' degrees.
The average compensation the CEOs receive is 10.776 million with the lowest paid as low as $50,000 and the highest as $122.994 million.
Not all the companies in the sample have positive average five-year returns and profits. The highest average five-year returns is 109% and the lowest is -17%. But, as an average for 374 companies, this return is positive (18.23%). Companies' profits range from -$2.059 billion to $4.725 billion with average profit of $244.47 million. The size of the companies, measured by their assets, range from $287 million to $213.701 billion, with an average size of $11 billion in assets.
Pearson correlation coefficients for mana-gement-controlled firms are presented in Table 3 and those for owner-controlled firms are shown in Table 4.
Table 2. Descriptive Statistics of the Sample (Number of observation is 374).
Variable Mean Minimum Maximum
AGE 58.47 37.00 80.00
TENURE 26.54 5.00 57.00
CEOYEAR 12.65 5.00 54.00
COMP 10776.0 50.00 122994.00
RETURN5 18.23 -17.00 109.00
SALES 4920.15 174.00 64904.00
PROFIT 244.47 -2059.00 4725.00
ASSET 10936.00 287.00 213701.00
EDUCATION:
HS 10.00% - -
UNDER 42.00% - -
MASTER 37.00% - -
PHD 11.00% - -
Table 3. Pearson Correlation Coefficients for the management-controlled firms (n=74).
COMP CEOYEAR TENURE SALES PROFIT RETURN5
COMP 1.000 0.165 -0.049 0.552*** 0.418*** -0.073
CEOYEAR 1.000 0.093 -0.018 -0.027 0.175
TENURE 1.000 0.042 0.156 0.024
SALES 1.000 0.696*** -0.246**
PROFIT 1.000 0.195
RETURN5 1.000
Note:
- * Significant at the 10% level. - ** Significant at the 5% level. - *** Significant at the 1% level.
Table 4. Pearson Correlation Coefficients for the owner-controlled firms (n=300)
COMP CEOYEAR TENURE SALES PROFIT RETURN5
COMP 1.000 0.146** -0.081 0.178** 0.424*** 0.290***
CEOYEAR 1.000 0.404*** 0.022 0.060 0.106
TENURE 1.000 0.040 0.000 -0.194***
SALES 1.000 0.295*** -0.092
PROFIT 1.000 0.335***
RETURN5 1.000
Note:
- * Significant at the 10% level. - ** Significant at the 5% level. - *** Significant at the 1% level.
Empirical Models
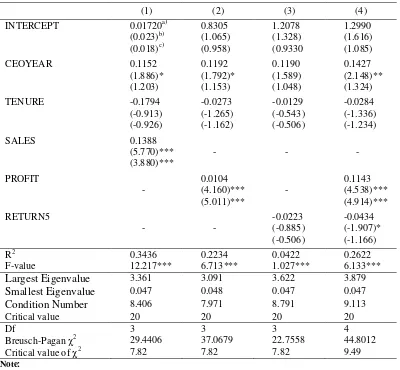
Tabel 3 shows that for the management-controlled firms, SALES and PROFIT, SALES and RETURN5, are statistically significantly correlated. These suggest that to avoid multi-collinearity problem, the regression models should separate these variables to become independent variables in the same regression model. The regression models for manage-ment-controlled firms are thus as follows.
COMPi = b1 + b2 CEOYEARi + b3 TENUREi
+ b4 SALESi + ei (1)
COMPi = b1 + b2 CEOYEARi + b3 TENUREi
+ b4 PROFITi + ei (2)
COMPi = b1 + b2 CEOYEARi + b3 TENUREi
+ b4 RETURN5i + ei (3)
COMPi = b1 + b2 CEOYEARi +
b3 TENUREi + b4 PROFIT +
b5 RETURN5i + ei (4)
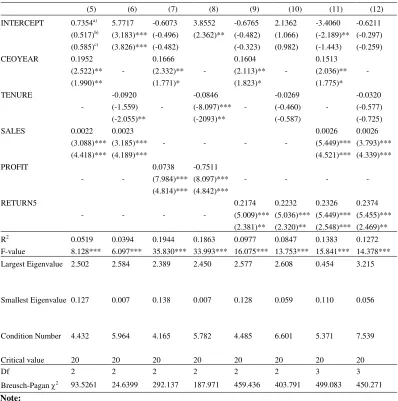
For the owner-controlled firms,
models for owner-controlled firms are thus as follows.
COMPi = b1 + b2 CEOYEARi + b3 SALESi +
ei (5)
COMPi = b1 + b2 TENUREi + b3 SALESi +
ei (6)
COMPi = b1 + b2 CEOYEARi + b3 PROFITi
+ ei (7)
COMPi = b1 + b2 TENUREi + b3 PROFITi +
ei (8)
COMPi = b1 + b2 CEOYEARi +
b3 RETURN5i + ei (9)
COMPi = b1 + b2 TENUREi + b3 RETURN5i
+ ei (10)
COMPi = b1 + b2 CEOYEARi + b3 SALESi + b4 RETURN5i + ei (11)
COMPi = b1 + b2 TENUREi + b3 SALESi + b4 RETURN5i + ei (12) Variables used in the models are as follows.
- COMP is the total compensation received by the CEO deflated by the total assets. COMP consists of realized and deferred annual salary and bonus received, five years salaries and bonuses, stock-gains and other. Stock-gains are the difference in value between what a CEO pays to acquire shares and the value of the shares on the date of exercise. Other compensation co-vers miscellaneous cash and non-cash remunerations, including automobiles, company-paid health or life insurance, Country Club memberships, company contributions to savings plans and restricted stock award.
- CEOYEAR is the number of years as a CEO in the same firm. This variable is used in the models as a control variable.
- TENURE is the number of years the person is within the firm whether she/he as a CEO or not.
- SALES is defined as a firm's sales volume for a full year. To eliminate the effect of a firm's size, this variable is deflated by firm's total assets.
- PROFIT is defined as income before extraordinary items. To eliminate the effect of a firm's size, this variable is also deflated by firm's total assets.
- RETURN5 is defined as five-years average of stock returns.
RESULTS
The regression results for management-controlled firms appear in Table 5.
The multicollinearity problem is checked using a condition number as suggested by Belsley et al. (1980). The condition number is calculated as the squared root of the largest eigenvalue divided by the smallest eigenvalue. The largest and smallest eigenvalues and the condition numbers are presented in Table 5. All of these condition numbers are below the
critical values (20) of potential
multicollinearity problem as suggested by Belsley et al. The results suggest that multicollinearity problem does not exist in all of the four regressions.
Another data problem that needs to be verified is heteroscedasticity problem.2
The heteroscedasticity problem is tested using Breusch-Pagan method. Breusch and Pagan utilized Lagrange multiplier to test the presence of heteroscedasticity which allows
2 The problem of heteroscedasticity exists because the
the disturbance variance to vary with all independent variables. The values of this test are given in Table 5. The results suggest that all the regressions suffered by the heteroscedasticity problem. The problem was
solved using White’s procedure and the
corrected t-values are given in the parentheses in third line of each variable in Table 5. The values in the second line in the parentheses are t-values before corrected for heteroscedas-ticity.
Table 5. Management-controlled firm regressions (n=74).
(1) (2) (3) (4)
INTERCEPT 0.01720a)
(0.023)b) (0.018)c)
0.8305 (1.065) (0.958)
1.2078 (1.328) (0.9330
1.2990 (1.616) (1.085)
CEOYEAR 0.1152
(1.886)* (1.203)
0.1192 (1.792)* (1.153)
0.1190 (1.589) (1.048)
0.1427 (2.148)** (1.324)
TENURE -0.1794
(-0.913) (-0.926)
-0.0273 (-1.265) (-1.162)
-0.0129 (-0.543) (-0.506)
-0.0284 (-1.336) (-1.234)
SALES 0.1388
(5.770)*** (3.880)***
- - -
PROFIT
-
0.0104 (4.160)*** (5.011)***
-
0.1143 (4.538)*** (4.914)*** RETURN5
- -
-0.0223 (-0.885) (-0.506)
-0.0434 (-1.907)* (-1.166)
R2 0.3436 0.2234 0.0422 0.2622
F-value 12.217*** 6.713*** 1.027*** 6.133***
Largest Eigenvalue
3.361 3.091 3.622 3.879Smallest Eigenvalue
0.047 0.048 0.047 0.047Condition Number
8.406 7.971 8.791 9.113Critical value 20 20 20 20
Df 3 3 3 4
Breusch-Pagan 2 29.4406 37.0679 22.7558 44.8012
Critical value of 2 7.82 7.82 7.82 9.49
Note:
The dependent variabel is COMP.
a) Values in the first line are the regression coefficients.
b) Values in parentheses in the second line are the t-tests before corrected for heteroskedasticity. c) Values in parentheses in the third line are the t-test after corrected for heteroskedasticity
The results from Table 5 show that SALES and PROFIT are statistically significant at the 1% level and RETURN5 is insignificant. The results support the first hypothesis that in the management-controlled firms, CEO tend to
focus on sales or profit but not on stock return to increase their wealth.
The regression results for owner-controlled firms appear in Table 6.
Table 6. Owner-controlled firm regressions (n=300).
(5) (6) (7) (8) (9) (10) (11) (12)
The dependent variabel is COMP.
a) Values in the parentheses in the first line are the regression coefficients.
b) Values in the parentheses in the second line are the t-tests before Corrected for Heteroskedasticity. c) Values in the third line are the t-test after Corrected for Heteroskedasticity
The multicollinearity problem is again checked using a condition number as suggested by Belsley et al. (1980). All of these condition numbers are below 20, suggesting that the multicollinearity problem does not exist in all of the eight regressions.
The heteroscedasticity problem is also tested again using Breusch-Pagan method. The results in Table 6 suggest that all the regressions suffered by the heteroscedasticity problem. The problem was solved using
White’s procedure and the corrected t-values are given in the parentheses in the third line of each variable in Table 6.
The results from Table 6 show that all the three performance measures, SALES, PROFIT and RETURN5, are all statistically significant at the 1% and 5% levels. The results support the second hypothesis that in the owner-controlled firms, CEOs tend to focus on sales, profit and stock return to increase their wealth.
CONCLUSION
This study examines the relationship
between firm performance and CEO
compensation and hypothesizes that the conflict of interest problem exists in management-controlled firms, while in owner-controlled firms, the problem do not exist. The results of this study support the two hypotheses.
In management-controlled firms, sales and profit performance measures are the determinant of CEO compensation. Increasing sales or profit does not always increase the wealth of the shareholders. But, increasing stock returns does increase the wealth of the shareholders. Therefore, increasing stock returns is consistent with the objective of shareholders. Since CEO compensation is positively related to sales and profit, it can be concluded that in management-controlled firms, the conflict of interest between CEO and shareholders still exists.
In owner-controlled firms, all performance measures, sales, profit and stock returns, are the determinant of CEO compensation. Since increasing stock returns does increase the wealth of the shareholders, it therefore can be concluded that in owner-controlled firms, the conflict of interest between CEO and shareholders does not exist.
The results of this study suggest several things. First, even though CEOs have been compensated, the conflict of interest problem still exists in the management-controlled firms. Second, ownership plays a key role in overcoming the conflict of interest problem. Third, executive compensation must be designed not only to answer how much CEOs have to be paid but rather how they are paid. They should be paid in form of stock options or corporate stocks to increase their ownership in the firm. The results also show that the majority of the U.S. firms in the sample are aware of this problem and they solved the
problem by increasing their managers’
ownership. As seen in the sample that more than 80% of the 300 firms, that are 374 firms are owner-controlled firms.
This study has several limitations. The first limitation is the data used. This study only uses one year period of data. The second limitation of this study is the definition of the compensation, which is defined as total compensations received by the CEO. Future studies should decompose the total compensation into long-term and short –term compensations. By segregating into short- and
long-term components of the total
BIBLIOGRAPHY
Belsley, D.; E. Kuh and R. Welsch. 1980. Regression Diagnostics: Identifying
Influential Data and Sources of
Collinearity. New York: John Willey.
Quoted from Greene W.H. 1993.
Econometric Analysis. New York: Macmillan Publishing Company, second edition.
Gomez-Mejia, L.R., H. Tosi, and T. Hinkin. 1987. Managerial Control, Performance, and Executive Compensation. Academy of Managerial Journal 30: 51-70.
Jensen, M.C and K.J. Murphy. 1990. Performance Pay and Top-Management Incentives. Journal of Political Economy 98: 225-264.
Lewellen, W.G. and B. Hunstman. 1970.
Managerial Pay and Corporate
Performance. American Economic Review 60: 710-720.
McGuire, J.W., J.S.Y. Chiu and A.O. Elbing. 1962. Executive Incomes, Sales, and Profits. American Economic Review 53: 753-761.
Murphy, K.J. 1985. Corporate Performance
and Managerial Remuneration An
Empirical Analysis. Journal of Accounting and Economics 7:11-42.
Prasad, S.B. 1974. Top Management
Compensation and Corporate Performance. Academy of Management Journal 17: 554-558.
Roberts, D.R. 1959. A General Theory of
Executive Compensation Based on
Statistically Tested Propositions. Quarterly Journal of Economics 70: 270-294.
Simon, R. 1886. Charred Meat. Forbes 137: 93.