Introduction
Chemistry in Protoplanetary Disks
Different wavelength ranges probe different regions of the disc, dust grain sizes, and atomic and molecular transitions (see Andrews 2015 ; Bergin et al. 2007 ). Infrared telescopes, such as the Spitzer Space Telescope and the James Webb Space Telescope (JWST), detect hotter materials in the disk's surface layers.
The Composition of Solid Solar-System Bodies
One of the main scientific objectives of Curiosity's ChemCam instrument (Maurice et al. 2012) is to inventory volatile and life-sustaining elements on the 3.6–3.8 billion year old surfaces in Gale crater (Thomson et al. 2011 ). Investigating the evolution of Mars and determining whether habitable environments exist or ever existed on the planet will contribute significantly to our understanding of the range of outcomes of terrestrial planet formation (Ehlmann et al. 2016).
Thesis Chapter Summaries
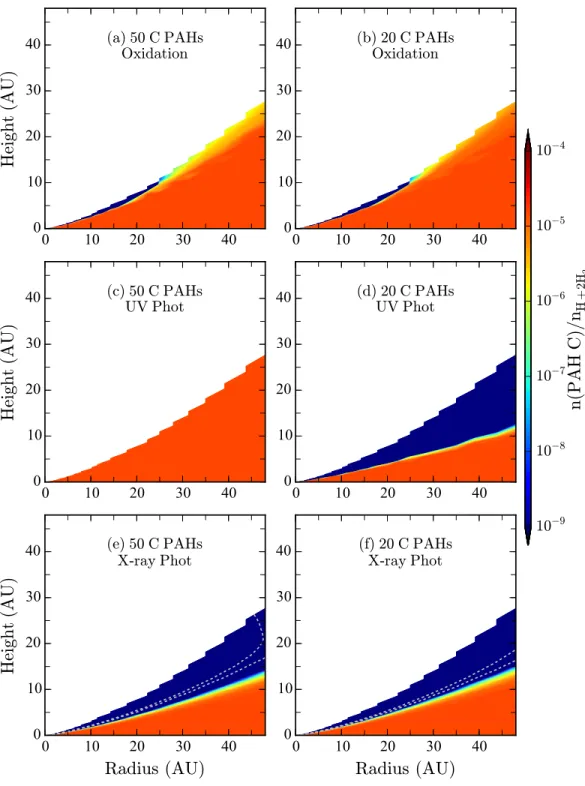
Photolysis occurs over a larger area of the disk due to lack of temperature dependence in the reaction rate. The size of the depleted areas in the surface layer of the disc from fig.
Destruction of Refractory Carbon in Protoplanetary Disks 12
Model
Given our static model, these grains are only considered for the calculation of the physical states of the disk and are not directly included in the chemical reactions. The energy deposited by these photons would be insufficient to heat 0.01–10 µm grains above the sublimation temperature of refractory carbon throughout the bulk of the disc (Najita et al. 2001).
Results
Figures 2.4 and 2.5 show that under the favorable conditions present in the surface layers of the disc, the depletion of refractory carbon sources occurs very quickly compared to the lifetime of the disc. However, most of the disc material is concentrated in the midplane, and planet formation takes place in this region.
Discussion
Heating the dense areas of the disc can increase the oxidation efficiency throughout the disc. Dust grains may not have clean carbon surfaces and may be covered by vapor ice in cooler regions of the disk.

Conclusion
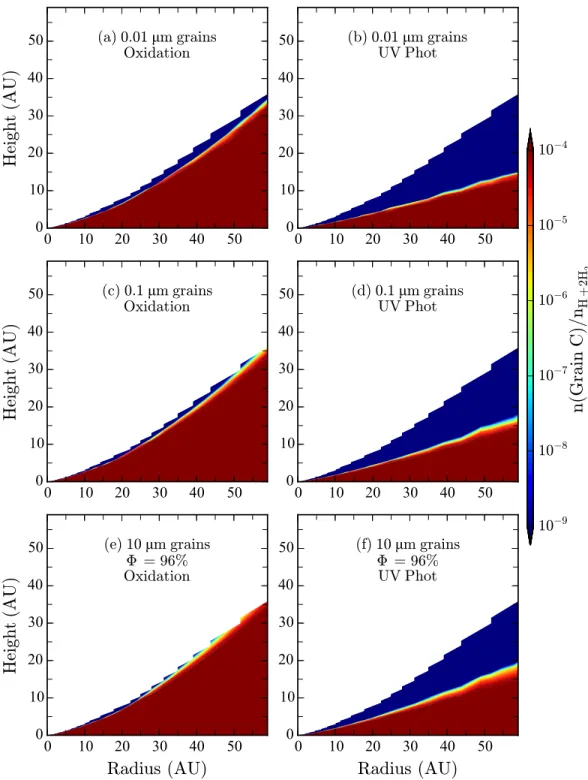
Photolysis can destroy the 0.01 µm carbon grains throughout the planet-forming region of the disc, provided sufficient turbulence is assumed. To be efficient, destruction of refractory carbon grains would therefore have to occur early in the lifetime of the disc before significant grain growth and the building of planetesimals.
Acknowledgments
While these grains remain small, photolysis (and to a lesser extent oxidation) can selectively erode the refractory carbon component of the population releasing it into the unstable phase in the inner parts of the disc. However, this analysis depends on several unconstrained parameters in the disc, including the temperature and density structure, the amount of turbulence present, and the nature of the carbon sources.
Appendix
Kinematics of CO gas in the inner regions of the TW Hya disc. The fate of the carbon carriers will depend on the chemical pathways present in the inner disk.
Probing the Gas Content of Late-stage Protoplanetary Disks
Introduction
Compared to carbon, a smaller fraction of the total amount of available nitrogen (based on the solar value) is found in meteorites and comets (Bergin et al. 2015). For this reason, N2H+ has been used as a tracer of the CO snowline in protoplanetary discs (e.g. Qi et al. 2013b).
Observations
The J = 3–2 CO fluxes measured by our method are about 90% of the values found by Barenfeld et al. Qi et al. 2013a) from SMA and ALMA (also marked in green) and 2 discs in the Upper Sco from ALMA (this work marked in purple).

Modeling
The location of the CO snow surface changes with disk mass in the cold disk models (top row). Similarly, minimal changes were observed in the flux ratios for the cold disk model in these cases.
Discussion
Such a scenario is consistent both with the low nitrogen content relative to carbon in primitive solar system bodies and with the high N2H+/CO fluxes observed in the Upper Sco disks. This correlation may indicate that similar chemical evolution of the gas occurred in the solar nebula and Upper Sco disks.
Conclusion
The resulting high nitrogen-to-carbon content in the gas would correspond to low nitrogen-to-carbon ratios in the solids forming in the disc, consistent with trends in the elemental abundances of theories and comets in our Solar System relative to the Sun ( Bergin et al 2015). This connection may hint at similar evolutionary pathways existing in the Upper Sco discs and the solar nebula.
Acknowledgments
Appendix
Therefore, when it was above zero, the y-intercept of the calibration curve was taken as the signal in the blank. In the case of gypsum+K1919, the peak area at nm increases monotonically for all concentrations.
Constraining Gas Masses of CO-Depleted Disks with Mul-
Introduction
According to the core accretion theory of planet formation, gas giants such as Jupiter and Saturn must grow sufficiently massive cores to enter the runaway accretion phase before dissipating gas in the disc (e.g. Pollack et al. 1996). Studies of meteorite paleomagnetism have found a very weak remnant of magnetism in the angrites, indicating the dissipation of the nebular gas by 3.8 million years after the formation of the CAI (Wang et al. 2017).
Observations
As an isotopologue of H2, HD may be the most suitable tracer and has been detected in a few disks using Herschel (Bergin et al. 2013; McClure et al. 2016). The Common Astronomy Software Applications (CASA) package ( McMullin et al. 2007 ) version 5.1.2 was used for data processing.

Constraining the Gas Mass of J160900-190852
This is the case for the N2H+/C18O flux ratio, which is strongly dependent on CO abundance but relatively less sensitive to disc gas mass (Fig. 4.2). The N2H+/HCO+ flux ratio should be less dependent on the degree of ionization in the disk because both species are molecular ions.
Discussion
For example, using HD as a mass tracer requires knowledge or prediction of the temperature structure of the disk (Bergin et al. 2013). Estimates have been made for the cosmic ray ionization rate for TW Hya (Cleeves et al. 2015) and the physical structure and C/N/O abundances for IM Lup (Cleeves et al. 2015).
Acknowledgments
A Revised Scorpius-Upper Epoch and Star Formation History among F-type Members of the Scorpius-Centaurus OB Association. Using chemical models, we explore the fate of these less volatile carbon carriers as we enter the hotter and denser inner regions of the disc.
Introduction
Our goal is to investigate the fate of these carbon carriers after they are introduced to the inner disc. Here we investigate the fate of carbon released from grain surfaces in the inner disk through chemical modeling.
Chemical Models
Chemical processes in the disk can result in CO being sequestered over time into less volatile carbon species (Bergin et al. 2014; Furuya and Aikawa 2014; In each case, we vary the initial abundances of the model so that all available volatile carbon, ~10−4 relative to total H, is in the form of a less volatile one.

The Fate of Carbon Carriers in the Inner Disk
Regardless of the initial carbon carrier, almost all of the available carbon is stored in CO at the disc surface when a form of oxygen is present in the gas (Figure 5.4). In the case where the initial carbon carrier is CO2 ice, after 106 years the carbon in the midplane is distributed to 1 a.e.

Discussion
The rate of vertical movement of material from the midplane to the observable surface layers depends on the means of angular momentum transport in the disk. Given the rapid photochemistry that converts initial carbon carriers to CO at the disk surface on timescales <1 year, the supply from the midplane would have to be extremely efficient in order to maintain a variety of carbon species in the layers photon-dominated surfaces.

Conclusion
Although infrared observations are limited to the disk surface due to optically thick dust emission at these wavelengths, longer wavelength observations can probe deeper. Observatories such as the future Square Kilometer Array (SKA) with low frequencies of 50–350 MHz and intermediate frequencies of 350 MHz to 15.3 GHz, corresponding to wavelengths from cm to m, can detect signals from the midplane for low frequencies. emitters including CH3OH.
Acknowledgments
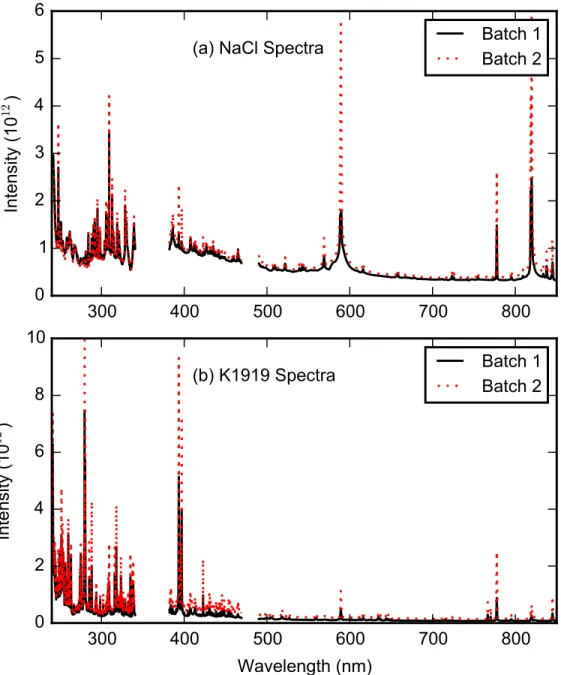
However, comparison of single-shot spectra revealed - in addition to random effects due to the composition of individual grain shots and fluctuations in the laser. The C lines at 247.9 and 283.8 nm experience interference due to Fe only in the presence of the basaltic matrix.
Characterization of Laser-Induced Breakdown Spectroscopy
Introduction
Sulfates have also been identified in the light colored veins of Garden City [Nachon et al., 2017]. In addition, LIBS molecular emission lines of CaCl have been detected from some Gale crater rocks [Forni et al., 2015], possibly as a result of NaCl in the rock (Ca from the associated host rock mixes with the Cl in the rock plasma to form the CaCl molecular producing line identified in the LIBS spectrum).
Materials and Methods
However, the theoretical determination of the exact form of the continuum emission to be removed is challenging. LOD2 corresponds to the concentration where the signal of the anion line is twice the standard deviation of the blank above the signal in the blank.
Results
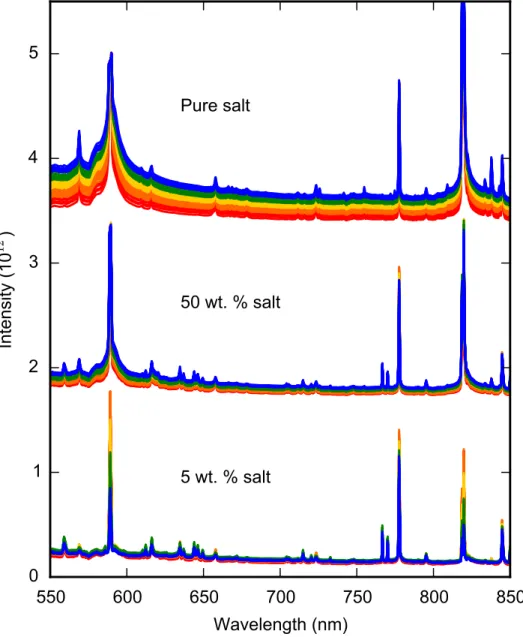
The selected Cl lines can be detected despite some interference due to other elements in the sample. Colors in the superimposed spectra indicate different salt concentrations with pure basalt in black, pure salt in red, and mixtures containing salt mass fractions of 0.05 wt%. selected blends only) in magenta, 5 wt.
Discussion
However, despite normalization, the calibration curves remain somewhat dependent on the identity of the salt cation. However, competing effects may occur, including cooling of the plasma due to interaction with the walls of the well [Corsi et al., 2005].
Conclusions
Multiple hypotheses exist for the continuum behavior observed here, and future work is needed to determine the cause. Combined with previous studies showing that the continuum provides useful information or normalizations [e.g. Tucker et al., 2010; Schröder et al., 2015], this work suggests that the continuum emission deserves further consideration and can contribute diagnostic information, especially if included in multivariate LIBS analyses.
Acknowledgments
Wiens (2016), Calibration of the Fluorine, Chlorine and Hydrogen Content of Apatites with the Chem-Cam LIBS Instrument, paper presented at 47th Lunar and Planetary Science Conference, The Woodlands, TX. Maurice (2016), Characterization of hydrogen in basaltic materials with laser-induced breakdown spectroscopy (LIBS), paper presented at 47th Lunar and Planetary Science Conference, The Woodlands, TX.
Conclusions & Future Directions
LIBS Exploration of Planetary Surfaces
As a fast remote sensing technique that is even sensitive to light elements, LIBS has many advantages for the detection of volatile elements in future planetary missions (e.g. Lasue et al. 2012). As more sophisticated analysis methods are pursued for the minor elements, including C, S and Cl, similar to the multivariate techniques used for the major elements (e.g. Anderson et al. 2017), the use of the continuum emission deserves further study.
Volatile Depletion
Refractory Carbon Abundances
Evidence of radial drift of solids in protoplanetary disks poses a challenge to the retention of low-carbon solids in the inner disk. However, early formation of giant planets in the disk could be critical to halting this process and maintain a refractory, low-carbon inner disk.
Connecting Protoplanetary Disk Models to Observational Con-
Bulk C/Si in Solar-system Bodies
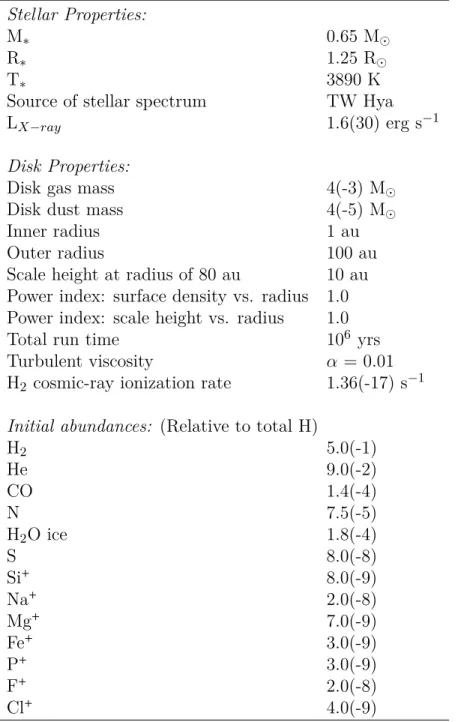
Source Properties
Observed Line Fluxes
Fiducial Model Input Parameters
Model Variations
Observed Line Fluxes
Fiducial Model Input Parameters
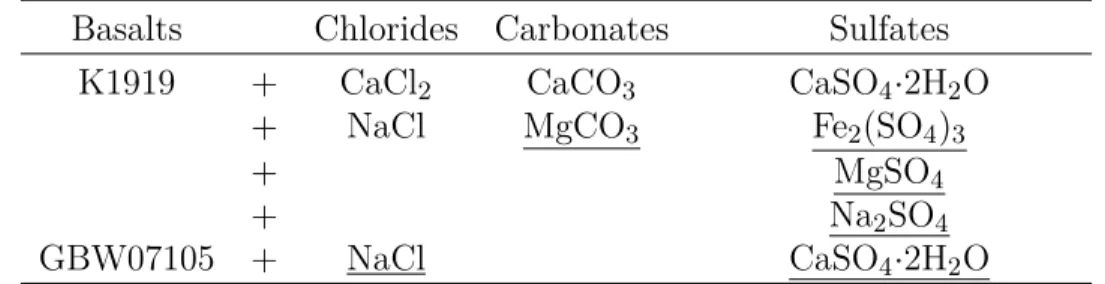
Salt+Basalt Mixture Combinations
Endmembers and Their Sources Used in Mixtures
Cl, C, and S lines that met the criteria for univariate analysis of
Cl emission lines identified as being useful for identification of
For S lines, equivalent to Table 6.4
For C lines, equivalent to Table 6.4