YIELD PERFORMANCE AND ADAPTATION OF PROMISING AMPHIBIOUS RED RICE
LINES ON SIX GROWING ENVIRONMENTS IN LOMBOK, INDONESIA
I.G.P. Muliarta Aryana*) and W. Wangiyana
Faculty of Agriculture University of Mataram
Jl. Majapahit 62, Mataram 83125, West Nusa Tenggara, Indonesia *) Corresponding author E-mail:[email protected]
Received: November 29, 2014 /Accepted: December 7, 2015
ABSTRACT
The objectives of this study were to examine yield performance of promising amphibious red rice lines, and to evaluate their adaptability to six growing environments in Lombok, Indonesia. Ten promising amphibious red rice lines were tested together with their three parents and one national cultivar (Aek Sibundong), during the rainy extended to dry season 2014 (January-June 2014). The ten promising lines were obtained from two population sources, while the three parents were AKBC52, AKBC86, and a local cultivar, i.e. Kala Isi Tolo (KIT). The testing environments were lowland in Mambalan village (West Lombok), medium highland in Mantang village (Central Lombok), and highland in East Sembalun village (East Lombok), and each location consisted of two systems, i.e. flooded and dry (upland) systems. The experiment in each environment was designed according to Randomized Complete Block Design, with three replications and 14 genotypes as the treatments. Adaptation analysis was based on ANOVA using AMMI and Biplot. The results indicated that among the 14 genotypes, G10(F2BC4A52-42) showed the highest yield, with an average of 7.8 t ha-1 dry seeds. There was a significant Genotype x Environment interaction on the dry seed yield. Biplot analysis indicated that G2(F2BC4A52-44) and G8(F2BC4A52-37) were stable genotypes across locations.
Keywords: adaptation; amphibious; G x E inter-action; red rice; yield performance
INTRODUCTION
In Indonesia, rice (Oryza sativa L.) is the most important food crop, because most Indonesian people use husked rice seeds as the
daily staple food source. In terms of the color, white rice is the most common in the market. However, there are also brown, red and black rice in the community in certain regions including Lombok Island. The red color in the red rice seed is due to the presence of anthocyanins in the seeds (Abdel-Aal et al., 2006), which are members of phenolic compounds (Fasahat et al., 2012). In Malaysia, among the colored rice examined, i.e. Thailand red rice (red), G37 (red), G33 (red), and MR219 (brown), the total phenolic contents were Thailand red rice > G37 > G33 > MR219, which content ranged from an average of 0.32 to 1.58 mg GAE/g, and they all showed antioxidant properties (Fasahat et al., 2012). Anggraini et al. (2015) also reported that among some red, black and white rice cultivar from West Sumatra, Indonesia, the red rice cultivar from South Solok was the best, with antioxidant activity of 54.2% at concentration 0.25 mg/ml. Thus, since they have antioxidant properties, red rice products would be good for human health.
In Indonesia, the improvement of red rice has not received adequate attention yet from the Government, as indicated by the fact that from approximately 233 rice varieties released by the Ministry of Agriculture, there has been only one cultivar of red rice released as a flooded (or paddy) rice, i.e. Aek Sibundong, and one red rice cultivar released as upland (dry) rice, i.e. Inpago Unram 1. Nevertheless, the opportunities to form amphibious red rice cultivars, which perform well both under irrigated and upland (dry) environments, have been initiated by Muliarta and Permatasari (2012) by utilizing local red rice germplasms from West Nusa Tenggara (NTB) Province. The development of a number of promising amphibious red rice lines was started by crossing “Kenya” cultivar with
“Angka” cultivar. Kenya is a local white rice
Cite this as: Aryana, I.G.P.M. and W. Wangiyana. 2016. Yield performance and adaptation of promising amphibious red rice lines on six growing environments in Lombok, Indonesia. AGRIVITA. 38(1):40-46. doi: 10.17503/agrivita.v38i1.494
Accredited : SK No. 81/DIKTI/Kep/2011
cultivar (drought tolerant) from Japonica sub-species, whereas Angka is a local irrigated (paddy) red rice cultivar from Indica sub-species. The selected lines from the F1 generation obtained from those crossings were then back-crossed four times with “Kala Isi Tolo” (KIT), a local red rice cultivar used as the donor parent. After selfing and selections for yield potential and drought tolerance, 10 promising amphibious red rice lines were obtained (Muliarta and Permatasari, 2012).
Since these promising lines were developed from many donor parents consisting of cultivars having good traits, such as high yield and/or drought tolerance, then ideally it may be expected that they show those potentials in varied locations where they were cultivated. This means that their yield potential might be stable across diverse growing environments, and this also means that they might be highly adaptive across environments. According to Akter et al. (2014), in countries of increasing population consuming rice, high yielding stable cultivars with high adaptation capabilities to diverse environments need to be developed. Or other-wise, as stated by Anputhas et al. (2011), it is required to find out “which won where”, by conducting multi-location trials in different loca-tions or seasons.
Subandi et al. (1979) asserted that in the development of high-yielding varieties, breeders need to consider yield stability systematically and continuously, from the formation of the base population until finishing the variety tests. In this case, seed yields are important criteria in evaluating the adaptability and yield stability of a genotype. Measurement of the relative stability of a genotype in a wide range of regions is important to determine the efficiency of breeding process. Plant genotype with a broad adapt-ability has a stable yield (Tollenaar and Lee, 2002; De Vita et al., 2010), which indicates that the genotype has a high adaptability to different conditions of growing environment (Tollenaar and Lee, 2002). A genotype that has adaptability with the same productivity in a variety of growing environments shows a static stability, whereas adaptability that follows environmental index shows a dynamic stability (Tollenaar and Lee, 2002; Mohammadi et al., 2010).
Testing variety candidates on various environments needs to be done because in Indonesia, rice growing environments are highly
variable either in types of land use, types of soil, techniques of cultivation, cropping patterns, or growing seasons. The variability of growing environments will affect yield per unit area. With the phenomenon of genotype by environment interactions due to the different responses of the genotypes tested in every environment, yield of loss of superior genotypes. Stable genotypes with high yields are needed by farmers having small plots of land to reduce the risk of crop failure due to changes in environmental factors that cannot be predicted (Mut et al., 2010; Akter
et al., 2014).
environments to test the 10 promising amphi-bious red rice lines together with their three parents, and a national red rice cultivar (Aek Sibundong).
In each testing environment, the experiment was designed using Randomized Complete Block Design (RCBD) with 14 treat-ments of red rice genotypes, each with three replications. The 14 genotypes tested consisted of five promising amphibious red rice lines, i.e. F2BC4A86-1, F2BC4A86-3, F2BC4A86-32, F2B C4A86-36, F2BC4A86-GS1, derived from back-crossing S-F2BC4AKBC52-16-22-18 with “Kala
Isi Tolo” (KIT); five promising amphibious red rice lines, i.e. F2BC4-A52-12, F2BC4A52-44, F2BC4A52-36, F2BC4-A52-37, F2BC4A52-42, derived from backcrossing SF2BC4AKBC86 -47-43-23 with KIT; the three parents (AKBC52, AKBC86, and KIT), and one national red rice cultivar (Aek Sibundong).
Each treatment genotype was grown with plant spacing of 25 cm x 25 cm, on a plot of 4 m x 5 m, built on a piece of land after tilling of twice plowing and harrowing. In the irrigated growing environments, the rice plants were grown from transplanting seedlings of three weeks old (one seedling per hill), and flooded irrigated using the technical irrigation water. In the upland environ-ments, seeds of the genotypes were direct-dibbled in January 2014, 3-5 seeds per hill, but then tinned to maintain one young plant per hill, and irrigation was based on the rain during the mid to end of the rainy season 2013/2014, but during the dry season 2014, additional irrigation was done using technical irrigation water as necessary. For the upland rice system in Mam-balan (L4), the additional irrigation was done at 50 days after seeding (DAS), soon after the 2nd N fertilization, 70 DAS (flowering) and 80 (seed-filling); for the location in Mantang (L5), the additional irrigation was done at 50 DAS (after the 2nd N fertilization), 80 DAS (flowering), and 90 DAS (seed-filling), while for the location in Sembalun (L6), the additional irrigation was
done at 50 DAS (after the 2nd N fertilization), 90 DAS (flowering), and 105 DAS (seed-filling).
The crops were fertilized with Phonska (15-15-15) fertilizer 7 days after seeding or transplanting at a dose of 300 kg ha-1, followed with Urea fertilizer (46% N) 30 and 50 days after seeding or transplanting at a dose 100 kg/ha each. The crops were harvested after they reached physiological maturity by harvesting one sample quadrate of 1 m x 1 m per plot. After drying the seeds to reach water content of 14%, the dry seeds were weighed for each plot, and then converted into kg ha-1 dry seed yield.
The data, i.e. dry seed yield, were analyzed using analysis of variance (ANOVA), followed by Additive Main Effect and Multiplicative Interactions (AMMI) analysis for the interaction between genotypes and environments, and to select an adaptive and stable genotype, Biplot analysis was done on dry seed yield data, as described by other researchers previously (Yan et al., 2006; Akter et al., 2014; Bose et al., 2014).
RESULTS AND DISCUSSION
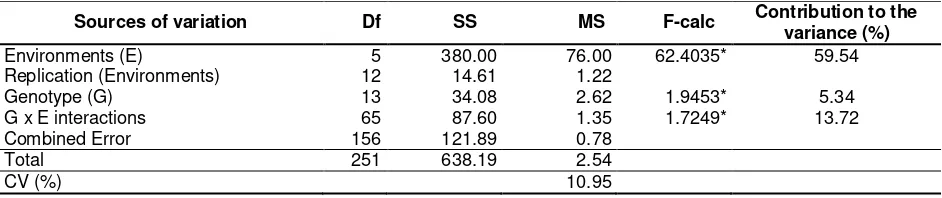
Table 1. Combined analysis of variance for the effects of genotypes, environments and genotype x envi-ronment interactions for dry seed yield of the promising amphibious red rice lines (kg ha-1)
Sources of variation Df SS MS F-calc Contribution to the variance (%) Environments (E) 5 380.00 76.00 62.4035* 59.54 Replication (Environments) 12 14.61 1.22
Genotype (G) 13 34.08 2.62 1.9453* 5.34
G x E interactions 65 87.60 1.35 1.7249* 13.72 Combined Error 156 121.89 0.78
Total 251 638.19 2.54
CV (%) 10.95
Remarks:*): significant (p-value < 0.05)
Table 2. Averages of dry seed yield (t ha-1) of the 14 genotypes of red rice grown in six different growing environments or locations
Genotypes
Environments or locations **)
Irrigated (or “paddy”) system Upland (or dry) system
L1 L2 L3 L4 L5 L6 Average
G1 (F2BC4A52-12) 6.5 ab(A) *) 6.0 a(A) *) 3.9 b(BC) *) 5.5 ab(AB) *) 5.1 ab(AB) *) 2.6 ab(C) *) 4.9 abc *) G2 (F2BC4A52-44) 7.2 ab(A) 5.6 a(BC) 3.8 b(BC) 6.3 ab(AB) 5.3 ab(BC) 2.8 a(CD) 5.2 abc
G3 (F2BC4A86-1) 6.8 ab(A) 4.7 a(B) 4.1 b(B) 6.6 a(A) 6.4 a(A) 3.1 a(B) 5.3 ab
G4 (F2BC4A86-3) 6.9 ab(A) 6.0 a(AB) 5.1 ab(BC) 6.5 ab(AB) 5.4 ab(B) 4.0 a(BC) 5.6 a G5 (F2BC4A86-32) 7.4 ab(A) 4.8 a(BC) 4.6 ab(BC) 6.4 ab(AB) 6.2 a(AB) 3.4 a(CD) 5.5 ab G6 (F2BC4A86-36) 5.8 bc(A) 4.8 a(AB) 4.8 ab(AB) 5.5 ab(AB) 5.1 ab(AB) 3.8 a(BC) 4.8 abc G7 (F2BC4A52-36) 7.1 ab(A) 5.8 a(BC) 4.2 b(BC) 5.0 b(BC) 4.3 b(BC) 3.1 a(CD) 4.9 bc G8 (F2BC4A52-37) 6.5 ab(A) 4.9 a(BC) 3.0 bc(CD) 5.3 ab(AB) 5.1 ab(AB) 2.0 b(D) 4.5 c G9 (F2BC4A86-GS1) 7.3 ab(A) 5.2 a(BC) 3.9 b(CD) 6.7 ab(AB) 6.5 a(AB) 3.7 a(CD) 5.5 ab G10(F2BC4A52-42) 7.8 a(A) 4.7 a(CD) 4.4 b(CD) 5.3 ab(BC) 5.2 ab(BC) 3.5 a(CD) 5.1 abc G11(AKBC52) 7.3 ab(A) 4.8 a(BC) 2.3 c(DE) 6.0 ab(AB) 5.0 ab(BC) 1.3 b(DE) 4.4 c
G12(AKBC86) 6.6 ab(A) 4.6 a(BC) 4.3 b(BC) 6.6 a(A) 6.5 a(AB) 2.3 b(CD) 5.1 abc
G13(Kala Isi Tolo) 6.3 b(A) 5.3 a(AB) 6.0 a(AB) 5.4 ab(AB) 5.1 ab(AB) 4.2 a(BC) 5.4 ab G14(Aek Sibundong) 7.0 ab(A) 4.6 a(BC) 3.1 bc(CD) 5.5 ab(B) 5.5 ab(B) 2.3 b(DE) 4.7 bc
Average 6.8 A 5.1 C 4.1 D 5.9 B 5.5 BC 3.0 E 5.1
Remarks: *) Means in each column followed by the same lowercase letters, or in each row followed by the same upper case letters, are not significantly different based on HSD test at 1% level of significance **) Growing environ-ments or locations: L1 = irrigated system on lowland, L2 = irrigated system on medium highland, L3 = irriga-ted system on highland, L4 = upland (or dry) system on lowland, L5 = upland system on medium highland, and L6 = upland system on highland areas
Based on the average dry seed yield of each genotype in each environment (Table 2), it can be seen that in the irrigated system on the lowland environment (L1), the genotype G10 (F2BC4A52-42) shows the highest dry seed yield, with an average of 7.8 t ha-1. Dry seed yield of this genotype in this environment was higher than those achieved by the three parents, i.e. G11 (AKBC52), G12 (AKBC86), G13 (Kala Isi Tolo), and the national red rice cultivar, i.e. G14 (Aek Sibundong), with an average dry seed yield of 7.3, 6.6, 6.3, and 7.0 t ha-1, respectively. Unfortunately, dry seed yields of the promising line G10 (F2BC4A52-42) were different between growing environments, especially between
irrigated system on the lowland (L1) and other environments. However, one of the parents, i.e. G13 (Kala Isi Tolo), showed non-significantly different dry seed yields between almost all environments (L1 to L5), except in L6 (upland system on the upper highland area) (Table 2).
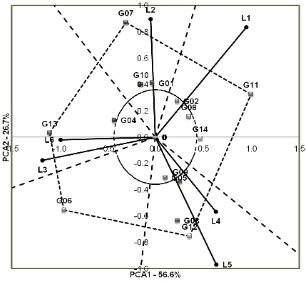
components of IPCA (Inter-action Principle Component Analysis), i.e. IPCA1, IPCA2, IPCA3 and IPCA4, which in general show significant different. Contributions to the variances of the interactions that can be explained by those four IPCA components are 56.6%, 26.7%, 11.1% and
3.7%, respectively (Table 3). Based on the values of the contribution, it appears that IPCA1 and IPCA2 resulted from the analysis of interaction between the main components are able to explain the G x E interaction for dry seed yields up to 83.3%.
Table 3. Analysis of variance with AMMI model for dry seed yield of the promising amphibious red rice lines
Source of variation df SS MS Fcalc Contribution to G x E (%) Environment (E) 5 380.00 76.00 62.4035 *
Replication (Environment) 12 14.61 1.22
Genotype (G) 13 34.08 2.62 1.9453 *
G x E interactions 65 87.60 1.35 1.7249 *
IPCA 1 17 49.60 2.92 3.6851 * 56.6
IPCA2 15 23.39 1.56 3.5208 * 26.7
IPCA3 13 9.71 0.75 3.0475 * 11.1
IPCA4 11 3.26 0.30 1.6234 * 3.7
Combined Error 156 121.89 0.78
Total 251 638.19 2.54
CV (%) 10.95
Remarks: *) = significant (p-value < 0.05)
To categorize the genotypes into stable or environments. Those genotypes are G2 (F2BC4 A52-44), G8 (F2BC4A52-37), and G9 (F2BC4A 86-GS1), with an average dry seed yield across the six locations is 5.2, 4.5, and 5.5 t ha-1, respectively. This is consistent with the state-ment of Gauch (1992) that a genotype that grows well across diverse testing environments and shows IPCA values approaching zero, gives an indication that the genotype is stable. Bose et al.
(2014) also categorized these types of genotypes as stable, while Akter et al. (2014) categorized these types of genotypes as non-sensitive to environmental interactive forces. However, if IPCA value of a genotype is very far from the zero point, it indicates that the genotype has a specific adaptability.
However, not all stable genotypes showed their dry seed yield above its average across locations. Based on Table 2 and Figure 1, it can be seen that stable genotypes having dry seed yield over its average values are G2 (F2BC4 A52-44) and G9 (F2BC4A86-GS1), with an ave-rage dry seed yield across locations is 5.2 and 5.5 t ha-1, respectively (Table 2). The stable genotypes will give equally good yields across growing environments both as paddy (irrigated) and upland (dry) rice, either on lowland, medium highland or upper highland areas. Therefore, these genotypes may be recommended for use as breeding materials to develop high-yielding varieties of red rice under upland and/or irrigated conditions (amphibious varieties).
The closeness of a genotype point to the environment line shows the closeness of the relationship between the genotype to the envi-ronment. It means that the environment highly gorized as having specific adaptation to only one environment, i.e. paddy system on lowland (L1) with dry seed yield above its average. The geno-types G1 (F2BC4A52-12), G7 (F2BC4A52-36),
and G10 (F2BC4A52-42) are specifically adapted to medium highland environment under irrigated (paddy) system (L2). In the location L2, the genotypes G1 (F2BC4A52-12) and G7 (F2BC4A52-36) yielded above its average, with dry seed yield of 6.0 and 5.8 t ha-1, respectively. The promising lines G5 (F2BC4A86-32) and G8 (F2BC4A52-37) as well as the parent G12 (AKBC86) are genotypes having location specific for cultivation on medium highland as upland rice (L5). The promising lines G5 (F2BC4A86-32) and G12 (AKBC86) also yielded above its average with a dry seed yield of 6.2 and 6.5 t ha-1, respectively. The promising red rice lines G4 (F2BC4A86-3) with a dry seed yield of 4.0 t ha-1 as well as the parent G13 (Kala Isi Tolo) with a dry seed yield of 4.2 t ha-1, which yielded above its average, are categorized as specific genotypes for cultivation on highland areas as upland rice (L6).
The genotypes adapted to two environ-ments are G14 (Aek Sibundong), which is specially adapted to both lowland areas as irrigated rice (L1) and lowland areas as upland rice (L4), while G6 (F2BC4A86-36), a promising line that is specially adapted to highland areas as irrigated rice (L3), is also suitable for medium highland as upland rice (L5). while G6 (F2BC4A86-36) was specifically adapted to L3 and L5, and G14 (Aek Sibundong) was specifically adapted to L1 and L4 environments.
ACKNOWLEDGEMENTS
The authors thank to the Director General of Higher Education for the research funding under “HIKOM” Research Grant of 2014.
REFERENCES
Akter, A., H.M. Jamil, K.M. Umma K.M., M.R. Islam, K. Hossain and R.M. Mamunur.2014. AMMI biplot analysis for stability of grain yield in hybrid rice (Oryza sativa L.). J. Rice Res. 2(2): 126-129. doi: 10.4172/jrr.1000126
Anggraini, T., Novelina, U. Limber and R. Amelia. 2015. Antioxidant activities of some red, black and white rice cultivar from West Sumatra, Indonesia. Pak. J. Nutr. 14(2): 112-117. doi: 10.3923/pjn. 2015.112.117
Anputhas, M., S. Samita and D.S.D.Z. Abeysiriwardena. 2011. Stability and adaptability analysis of rice cultivars using environment-centered yield in two-way ANOVA model. Communications in Biometry and Crop Science.6(2): 80-86. Bose, L.K., N.N. Jambhulkar and O.N. Singh. 2014. Additive main effects and multiplicative interaction (AMMI) analysis of grain yield stability in early duration rice. J. Anim. Plant Sci. 24(6): 1885-1897.
De Vita, P., A.M. Mastrangelo, L. Matteu, E. Mazzucotelli, N. Virzì, M. Palumbo, M. Lo Storto, F. Rizza and L. Cattivelli. 2010. Genetic improvement effects on yield stability in durum wheat genotypes grown in Italy. Field Crop. Res. 119(1): 68-77. doi:10.1016/j.fcr.2010.06.016 Fasahat, P., A. Abdullah, K. Muhammad, T.
Karupaiah and W. Ratnam. 2012. Red pericarp advanced breeding lines derived from Oryza Rufipogon × Oryza Sativa: physicochemical properties, total antioxidant activity, phenolic compounds and vitamin E content. Adv. J. Food Sci. Technol. 4(3): 155-165.
Ganefianti, D.W., D. Suryati and Hasannudin. 2009. Stability analysis of six chill pepper populations using additive main effect multiplicative interaction (AMMI)
(in Indonesian). Akta Agrosia. 12(2): 147-154.
Gauch, H.G., Jr. 1992. Statistical analysis of regional yield trials: AMMI analysis of factorial designs, 1st Edition. The Netherlands: Elsevier. p. 278.
Mohammadi, R., M. Roostaei, Y. Ansari, M. Aghaee and A. Amri. 2010. Relationships of phenotypic stability measures for genotypes of three cereal crops. Can. J. Plant Sci. 90: 819-830. doi:10.4141/CJPS09102
Muliarta, I.G.P. and S. Permatasari. 2012. Development of superior amphibious varieties of red rice high in yield and anthocyanin content, and early maturity.
Final Report of “HIKOM” Research
Grant. Mataram: Faculty of Agriculture, University of Mataram. p. 64.
Mut, Z., A. Gulumser and A. Sirat. 2010. Comparison of stability statistics for yield in barley (Hordeum vulgare L.). Afr. J. Biotechnol. 9(11): 1610-1618.
Subandi, M.R. Hakim, A. Sudjana, M.M. Dahlan and A. Rifin. 1979. Mean and stability for yield of early and late varieties of corn in varying environments. Contrib. Cent. Res. Inst. Agric. Bogor 51: 24.
Sujiprihati, S., M. Syukur and R. Yunianti. 2006. The analysis of stability of seven sweet corn populations using additive main effect multiplicative interaction (AMMI) (in Indonesian). Jurnal Agronomi Indo-nesia. 34(2): 93-97.
Tollenaar, M. and E.A. Lee. 2002. Yield potential, yield stability and stress tolerance in maize. Field Crop. Res. 75(2-3): 161-169. doi:10.1016/S0378-4290(02)00024-2 Yan, W., M.S. Kang, B. Ma, S. Woods and P.L.