Distribution and Systematics of Foraminifera
in the Indian River. Florida
SMITHSONIAN CONTRIBUTIONS TO THE MARINE SCIENCES • NUMBER 16
SERIES PUBLICATIONS OF THE SMITHSONIAN INSTITUTION
Emphasis upon publication as a means of " d i f f u s i n g k n o w l e d g e " was expressed by t h e first Secretary of the S m i t h s o n i a n . In his f o r m a l plan f o r t h e I n s t i t u t i o n , Joseph Henry o u t l i n e d a program t h a t included the f o l l o w i n g s t a t e m e n t : " I t is proposed t o publish a series of reports, giving an account of t h e new discoveries in science, a n d of t h e changes made f r o m year to year in all branches of k n o w l e d g e . " This t h e m e of basic research has been adhered t o t h r o u g h t h e years by t h o u s a n d s of t i t l e s issued in series p u b l i c a t i o n s under t h e S m i t h s o n i a n i m p r i n t , c o m m e n c i n g with Smithsonian Contributions to Knowledge in 1848 and c o n t i n u i n g w i t h the f o l l o w i n g active series:
Smithsonian Contributions to Anthropology Smithsonian Contributions to Astrophysics
Smithsonian Contributions to Botany Smithsonian Contributions to the Earth Sciences Smithsonian Contributions to the Marine Sciences
Smithsonian Contributions to Paleobiology Smithsonian Contributions to Zoology Smithsonian Studies in Air and Space Smithsonian Studies in History and Technology
In these series, t h e I n s t i t u t i o n publishes small papers and full-scale m o n o g r a p h s t h a t report t h e research and collections of its various m u s e u m s and bureaux or of professional colleagues in t h e world of science and scholarship. The publications are d i s t r i b u t e d by m a i l i n g lists t o libraries, universities, a n d s i m i l a r i n s t i t u t i o n s t h r o u g h o u t the w o r l d .
Papers or m o n o g r a p h s s u b m i t t e d f o r series publication are received by t h e S m i t h s o n i a n I n s t i t u t i o n Press, subject t o its own review f o r f o r m a t and style, only t h r o u g h d e p a r t m e n t s of t h e various S m i t h s o n i a n m u s e u m s or bureaux, where t h e m a n u s c r i p t s are given substantive review. Press r e q u i r e m e n t s f o r m a n u s c r i p t a n d a r t preparation are o u t l i n e d on t h e inside back cover.
S. Dillon Ripley Secretary
S m i t h s o n i a n I n s t i t u t i o n
Distribution and Systematics of Foraminifera
in the Indian River, Florida
Martin A. Buzas and Kenneth P. Severin
SMITHSONIAN INSTITUTION PRESS City of Washington
1982
A B S T R A C T
Buzas, Martin A., and Kenneth P. Severin. Distribution and Systematics of Foraminifera in the Indian River, Florida. Smithsonian Contributions to the Marine Sciences, number 16, 73 pages, 25 figures, 6 tables, 11 plates, 1982.—The Indian River, a shallow, 195 km long estuary, is bounded on the east by a barrier island. Three inlets divide the barrier island, providing exchange with the Atlantic Ocean. Twelve areas covering the length of the estuary were sampled for living foraminifera. Altogether, 17,348 individuals belonging to 94 species were identified. The mean number of individuals and the number of species generally increase from north to south.
The densities of the 15 most abundant species, comprising 95% of the total number of living individuals, were analyzed by canonical variate analysis.
The first canonical axis discriminated the inlets and the northernmost (Hau- lover) area from the rest. On the second canonical axis, the 12 areas were arranged in a north-to-south series. Examination of the data confirms that the analysis succinctly summarizes foraminiferal distribution in the Indian River.
Taxonomic notes are given for each species, and almost all species are illustrated. Ishamella apertura, new genus and species, is described and illus- trated.
OFFICIAL PUBLICATION DATE is handstamped in a limited number of initial copies and is recorded in the Institution's annual report, Smithsonian Year. SERIES COVER DESIGN: Seascape along the Atlantic Coast of eastern North America.
Library of Congress Cataloging in Publication Data Buzas, Martin A.
Distribution and systematics of Foraminifera in the Indian River, Florida.
(Smithsonian contributions to the marine sciences ; no. 16) Bibliography: p.
Supt. of Docs, no.: SI 1.41:16
1. Foraminifera—Florida—Indian River—Classification. 2. Foraminifera—Florida—Indian River—Geographical distribution. 3. Protozoa—Classification. 4. Protozoa—Geographi- cal distribution. 5. Protozoa—Florida—Indian River—Classification. 6. Protozoa—Flor- ida—Indian River—Geographical distribution. I. Severin, Kenneth P. II. Title. III.
Series.
QL368.F6B874 593.1'209759'28 81-607104 AACR2
Page
Introduction 1 Acknowledgments 1
Methods 3 Sampling Plan 3
Field Methods 3 Laboratory Methods 3 Statistical Methods 3 Distribution of Abundant Foraminifera 4
Species Diversity 15 Distribution of Rare Species 15
Discussion 18 Systematic Catalog 20
Appendix: Number of Living Individuals Observed in 20 ml Replicate
Samples 43 Literature Cited 48
Plates 52
m
of Foraminifera
in the Indian River, Florida
Martin A. Buzas and Kenneth P. Severin
Introduction
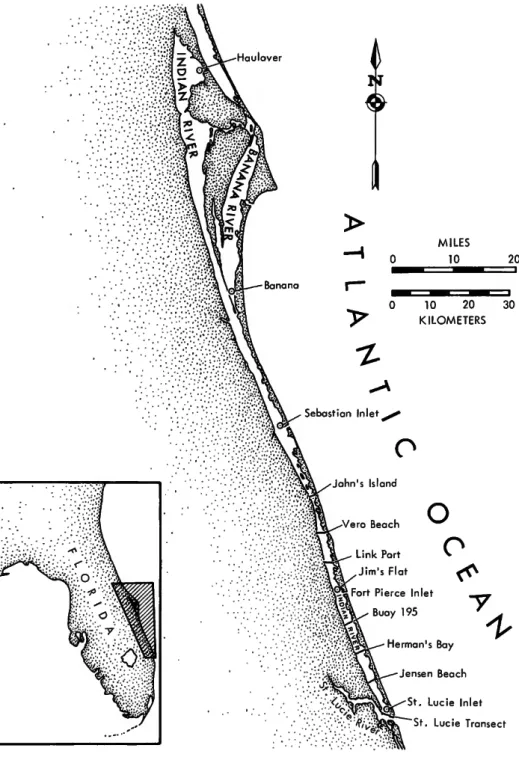
The Indian River, a shallow, 195 km long body of water on the east-central coast of Florida (Fig- ure 1), is a euryhaline and eurythermal estuary.
Bounded on the east by a barrier island, the southern half of the estuary is connected with the Atlantic Ocean by three inlets: Sebastian, Fort Pierce (Jim's Flat of this study), and St. Lucie.
All the inlets are maintained artificially. The northern end of the estuary is connected to the ocean via Haulover Canal, which links the estu- ary to the Mosquito Lagoon and the Ponce de Leon Inlet 40 km farther north.
The average depth of the Indian River is about 1.5 m; the greatest depths, about 3.5 m, occur in the Intracoastal Waterway and other dredged boat channels. The substrate is quartz sand with a low percentage of silt and clay. Because of the shallow depths, the waters of the estuary are influenced by a combination of tidal flushing, surface drainage, rainfall, and wind conditions.
Near the inlets, estuarine water is exchanged with the Atlantic Ocean on a semidiurnal basis and has little variation in salinity and only sea-
Martin A. Buzas, Department of Paleobiology, National Museum of Natural History, Smithsonian Institution, Washington, D. C 20560. Kenneth P. Severin, Department of Geology, University of California, Davis, California 95616.
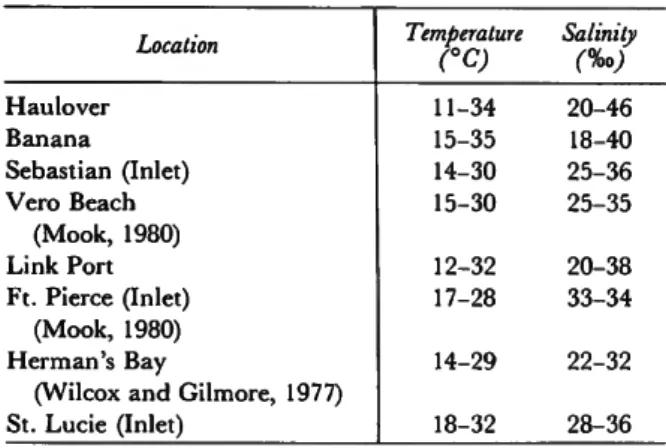
sonal differences in temperature (Table 1). In the portions of the river away from the inlets, how- ever, the tidal influence is almost negligible, and conditions are determined by nontidal effects. In general, the range of variation in temperature and salinity decreases from north to south (Table
1), whereas the average increases. An overall gra- dient of decreasing environmental variability from north to south was pointed out by Young et al. (1976), Young and Young (1977), and Nelson et al. (1982).
Although the foraminifera of the bays and estuaries of the northeastern continental margin of North America are relatively well studied, very little information exists from the shallower waters of the southeastern portion of the continent (Cul- ver and Buzas, 1980). The purpose of the present investigation is to document the distribution and systematics of the foraminifera from the major estuary in east-central Florida.
ACKNOWLEDGMENTS.—We thank M. Abrams, R. Bronson, K. Carle, M. Cavanaugh, G. Heim, A. Lanham, C. Leibhauser, C. McCloy, and S.
Pohanka for help in the laboratory. T h e samples were collected by K. Carle, D. Mook, and D.
Young. The foraminifera and figures were drawn by Lawrence Isham. J. Piraino operated the SEM, and T. Smoyer assisted greatly in the dark- room. D. Dean prepared specimens for sectioning.
1
SMITHSONIAN CONTRIBUTIONS TO THE MARINE SCIENCES
St. L u c i e Transect
FIGURE 1.—Sampling localities.
C. G. Adams and J. Whittaker provided access to icisms of the manuscript, and, finally, we thank several specimens in the British Museum (NH). J u n e Jones for typing it.
D. Dance and H. Marshall assisted in the com- This is contribution number 234 from the Har- puter analysis. S. J. Culver provided helpful crit- bor Branch Foundation.
TABLE 1.—Ranges of temperature and salinity in the Indian River (except where noted, all data are from Nelson et al.,
1982)
Haulover Banana
Sebastian (Inlet) Vero Beach
(Mook, 1980) Link Port Ft. Pierce (Inlet)
(Mook, 1980) Herman's Bay
(Wilcox and Gilmore, 1977) St. Lucie (Inlet)
Temperature
CC)
11-34 15-35 14-30 15-30 12-32 17-28 14-29 18-32
Salinity (%>) 20-46 18-40 25-36 25-35 20-38 33-34 22-32 28-36
Methods
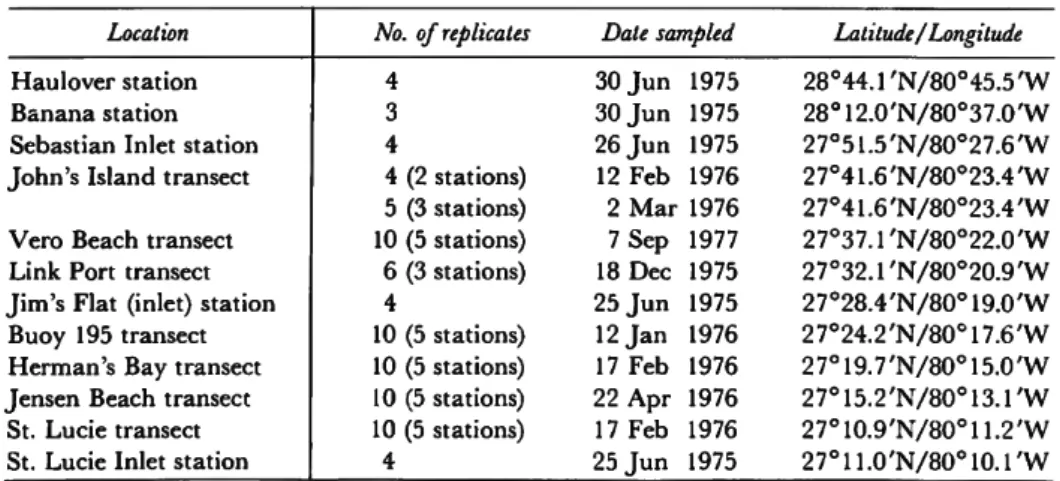
SAMPLING PLAN.—The samples for this study were taken in 1975 and 1976. The sampling program consisted of either single stations or sta- tions located along a transect (Figure 1). At each transect station, two replicate cores were taken.
One replicate from the John's Island transect was lost. The inlets (Sebastian, Jim's Flat at Fort Pierce, and St. Lucie) and Haulover and Banana consisted of single stations with four replicates. A replicate from the Banana station was lost. Table 2 lists the locations, the number of replicates (or observations), the date of sampling, and the lati- tude and longitude of each locality.
FIELD METHODS.—Samples were taken by in- serting 3.5 cm diameter plastic core liners into the sediment by hand or, in deeper water, by attach- ing them to a long pole. Upon recovery the samples were fixed with neutralized formalin.
LABORATORY M E T H O D S . — O n return to the lab- oratory, the top 20 ml of sediment was removed from the cores, washed over a 63 /xm sieve, and stored in 95% ethanol. Before examination, the sample was stained for about 24 hours with rose bengal, washed once more over a 63 /xm sieve, rinsed with acetone, and dried. T h e sample then was floated twice in a mixture of bromoform and acetone (specific gravity 2.4). The floated portion of the sample was re-wet, and the stained fora- minifera was picked out and placed on a micro- paleontologic slide for sorting, identification, and enumeration.
STATISTICAL METHODS.—The sampling plan was designed so that replicates were taken at all locations. This allows the data to be analyzed by canonical variate analysis, also called multiple discriminant analysis. The use of this method for faunal analysis was described by Buzas (1967).
The computer program used for the analysis is part of the Statistical Package for the Social Sciences (SPSS). All densities were transformed to ln (x+1) before analysis to insure stability of variances and to increase Normality.
For each sampling location, the information function and a measure of equitability were cal-
TABLE 2.—Sampling localities and dates of sampling, listed from north to south Location
Haulover station Banana station Sebastian Inlet station John's Island transect Vero Beach transect Link Port transect Jim's Flat (inlet) station Buoy 195 transect Herman's Bay transect Jensen Beach transect St. Lucie transect St. Lucie Inlet station
No. of replicates 4
3 4
4 (2 stations) 5 (3 stations) 10 (5 stations) 6 (3 stations) 4
10 (5 stations) 10 (5 stations) 10 (5 stations) 10 (5 stations)
4
Date sampled 30 J u n 30 J u n 26 J u n 12 Feb
1975 1975 1975 1976 2 M a r 1976 7 Sep 18 Dec 25 J u n 12 J a n 17 Feb 22 Apr 17 Feb 25 J u n
1977 1975 1975 1976 1976 1976 1976 1975
Latitude/Longitude 28°44.1'N/80°45.5'W 28°12.0'N/80°37.0'W 27°51.5'N/80°27.6'W 27°41.6'N/80°23.4'W 27°41.6'N/80°23.4'W 2 7o3 7 . r N / 8 0 ° 2 2 . 0 ' W 2 7 ° 3 2 . r N / 8 0 ° 2 0 . 9 ' W 27o28.4'N/80°19.0'W 27o24.2'N/80°17.6'W 27o19.7'N/80°15.0'W 2 7o1 5 . 2 ' N / 8 0o1 3 . 1 ' W 2 7o1 0 . 9 ' N / 8 0o1 1 . 2 ' W 2 7 ° 1 1 . 0 ' N / 8 0 ° 1 0 . r W
SMITHSONIAN C O N T R I B U T I O N S T O T H E M A R I N E S C I E N C E S
culated. The information function was calculated from the formula
H = -2pi In pt, and equability from the formula
S'
where e is the base of the natural logarithms, and S is the number of species (Buzas and Gibson,
1969).
Distribution of Abundant Foraminifera Of the 94 species recorded in the Indian River, few were abundant. We arbitrarily chose the 15 most abundant species for canonical variate anal- ysis. These 15 species represent about 95% of the total living population. The first analysis was made using each station as a separate group. The results were difficult to interpret, and so we de- cided on a simpler scheme. Inspection of the data showed little difference among stations in tran- sects; consequently, all stations within transects were treated as a single group. This divided the samples into the 12 groups shown in Figure 1 and Table 2. The number of replicates varies from area to area and also is shown in Table 2. In all, there are N = 83 observations, h = 12 areas, and p = 15 species.
Canonical variate, or multiple discriminant, analysis emphasizes the difference between mean vectors in a p-dimensional space. The first can- onical axis is placed as close as possible to the ends of the mean vectors, the second at right angles to the first, and so on. When p > h , there are only h—1 possible canonical variates. While this reduction in the number of dimensions is advantageous, an even greater advantage is that the first canonical variate will account for most of the variability, the second much less, and so on. In addition, each canonical variate is statis- tically independent and of unit variance, which greatly facilitates comparison of the results.
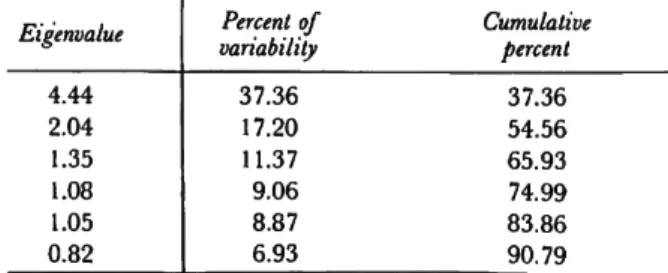
In the grouping used, there are h—1 = 11 possible eigenvalues. Of these, the first six were significant at the 95% level, using the criterion
provided by the SPSS program used for the anal- ysis. These eigenvalues, the percent of the varia- bility accounted for, and their cumulative per- cent are shown in Table 3.
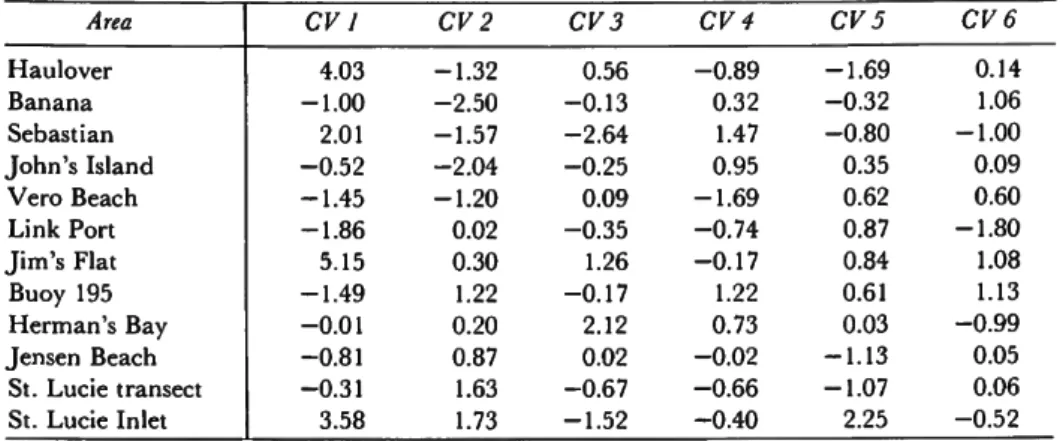
The first six mean canonical variates are shown in Table 4. Mean canonical variate 1 contrasts Haulover, Sebastian, Jim's Flat, and St. Lucie Inlet against the other areas. In other words, the first mean canonical variate, accounting for 37%
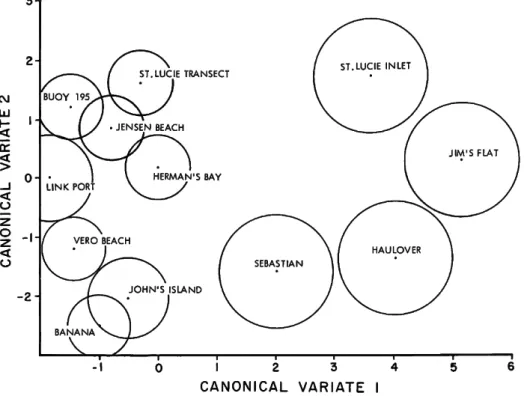
of the total variability, indicates that Haulover and the inlets are quite distinct from the other areas. T h e second canonical variate, accounting for 17% of the total variability, contrasts the northern areas against the southern areas (Table 4). A plot of mean canonical variate 1 vs. mean canonical variate 2 (with 95% confidence circles) is shown in Figure 2. T h e inlets and Haulover are discriminated clearly from the remaining stations and from one another. T h e inlets and other areas are also arranged in a north-south pattern, with some areas slightly out of place (Figures 1, 2).
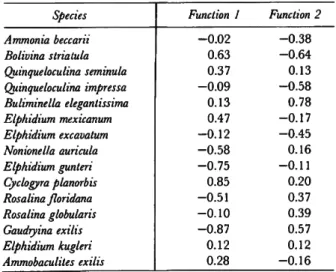
Figures 3 through 17 plot the mean densities of the 15 most abundant species at the 12 areas, and Table 5 lists the m e a n number of individuals per replicate (20 ml of sediment) plus some other useful statistics. We recall the first canonical var- iate contrasted Haulover, Sebastian, Jim's Flat, St. Lucie Inlet, and the remaining areas. By examining the canonical discriminate function coefficients (Table 6), we can determine the spe- cies mainly responsible for this contrast. In order of importance, these species are: Gaudryina exilis (Figure 12), Cyclogyra planorbis (Figure 7), Elphi- dium gunteri (Figure 9), Bolivina striatula (Figure 5), Nonionella auricula (Figure 13), Rosalina floridana
TABLE 3.—The first six eigenvalues arranged in decreasing order with the percentage of variability accounted for
Eigenvalue
4.44 2.04 1.35 1.08 1.05 0.82
Percent of variability
37.36 17.20 11.37 9.06 8.87 6.93
Cumulative percent
37.36 54.56 65.93 74.99 83.86 90.79
TABLE 4.—Mean canonical variates for the first six variates (localities listed from north to south)
Area Haulover Banana Sebastian J o h n ' s Island
Vero Beach Link Port J i m ' s Flat Buoy 195 Herman's Bay Jensen Beach
St. Lucie transect St. Lucie Inlet
CV 1 4.03 - 1 . 0 0 2.01 - 0 . 5 2 - 1 . 4 5 - 1 . 8 6 5.15 - 1 . 4 9 - 0 . 0 1 - 0 . 8 1 - 0 . 3 1 3.58
CV2 - 1 . 3 2 - 2 . 5 0 - 1 . 5 7 - 2 . 0 4 - 1 . 2 0 0.02 0.30 1.22 0.20 0.87 1.63 1.73
CV 3 0.56 - 0 . 1 3 - 2 . 6 4 - 0 . 2 5 0.09 - 0 . 3 5 1.26 - 0 . 1 7 2.12 0.02 - 0 . 6 7 - 1 . 5 2
CV 4 - 0 . 8 9 0.32 1.47 0.95 - 1 . 6 9 - 0 . 7 4 - 0 . 1 7 1.22 0.73 - 0 . 0 2 - 0 . 6 6 - 0 . 4 0
CV 5 - 1 . 6 9 - 0 . 3 2 - 0 . 8 0 0.35 0.62 0.87 0.84 0.61 0.03 - 1 . 1 3 - 1 . 0 7 2.25
CV 6 0.14 1.06 - 1 . 0 0 0.09 0.60 - 1 . 8 0 1.08 1.13 - 0 . 9 9 0.05 0.06 - 0 . 5 2
TABLE 5.—Mean number of living individuals at Indian River localities
JOHN'S VERO JIM1
SPECIES HAULOVER BANANA SEBASTIAN ISLAND BEACH LINKPORT FLAT AMMONIA BECCARII 37.75
BOLIVINA STRIATULA 7.25 (JU1NOULLOCUL1NA SEMINULA 46.50 QUINUUELOCULINA IMPRESSA 17.75 BULIMINELLA ELEGANTISSIMA 1.00 ELPH1L1UM MEXICANUM 7.75 ELPHIDIUM EXCAVA1UM 4.75 NONIONELLA AURICULA 0.25 ELPHIDIUM GUNTEHI 0.25 CYCLUvJKHA PLANORBIS 7.25 ROSALINA tLORIUANA 0.00 ROSALINA GLOBULARIS 0.50 GAUDHK1NA EXILIS 0.00 ELPHIOIUM KUGLErtI 1.50 AMMOBACULITES EXILIS 0.00 MEAN TOTAL OF ABUNDANT SPECIES.... 132.50
MEAN TOTAL OF ALL SPECIES 139.50 H 1.929 E 0.32B NUMBER OF SPECIES 21 NUMBtK Ot OBSERVATIONS 4 TOTAL INDIVIDUALS 558
BUOY 195
HERMAN' BAY
JENSFN ST. LUCIE ST. LUCIE GRAND BEACH TRANSECT INLET MEAN 45.67
0.00 3.00 76.33 0.00 1.67 10.00 0.00 4.33
o.uo o.oo o.oo
0.00 0.67 1.3J 143.00 149.33 1.361 0.325 12 3 448
.75
147.50 149.50 1.771 0.326
598 97.67 23.56 8.67 19.22
15.89 0.44 13.11 0.00
0.44 0.44
90.30 12.40 10.10 14.80 2.10 10.60 2.80 0.10 22.00 0.00 6.00 2.00
69.17 12.67
4.50
7.83
0.00
78.00 177.40 9.50 50.50 44.25 5.80 27.50 1.10 13.00 30.30 10.25 1.50
2.25 8.50 6.50 6.10 0.00 1.20 22.00 0.00
0.00 1.25 1.25 3.50
2.10 8.30 0.00 5.50 2.90
75.90 87.00 12.40 7.10 21.70 0.50 0.90 16.40 1.70 0.20 0.80 0.70 0.20 1.10 0.00 177.78 176.60 113.50 224.75 300.30 226.60 182.22 186.00 118.33 254.50 316.10 249.90
1,783 1.953 1.646 0.213 0.214 0.216
1640 lflbO 710
2.283 1.712 2.011 0.327 0.10S 0.144
30 53 52 4 10 10 1018 3161 2499
16.20 8.90
80.70 93.90 2.451 0.237
38.70 4.70 24.50 16.40 2.10 11.40 0.10 0.60
275.80 292.30 1.997 0.142 in 2923
74.75 23.25
70.25 15.75 17.50
7.50 1.75
3.00 0.25 234.75 248.50 2.145 0.231
8 0 . 8 7 2 3 . 5 6 1 6 . 5 7 1 5 . 4 1 1 5 . 0 6 8 . 6 1 6 . 7 3
TABLE 6.—Standardized canonical discriminant function coefficients
Species Ammonia beccarii Bolivina striatula Quinqueloculina seminula Quinqueloculina impressa Buliminella elegantissima Elphidium mexicanum Elphidium excavatum Nonionella auricula Elphidium gunteri Cyclogyra planorbis Rosalina floridana Rosalina globularis Gaudryina exilis Elphidium kugleri Ammobaculites exilis
Function 1 - 0 . 0 2
0.63 0.37 - 0 . 0 9 0.13 0.47 - 0 . 1 2 - 0 . 5 8 - 0 . 7 5 0.85 - 0 . 5 1 - 0 . 1 0 - 0 . 8 7 0.12 0.28
Function 2 - 0 . 3 8 - 0 . 6 4 0.13 - 0 . 5 8 0.78 - 0 . 1 7 - 0 . 4 5 0.16 - 0 . 1 1 0.20 0.37 0.39 0.57 0.12 - 0 . 1 6
(Figure 16), and Elphidium mexicanum (Figure 11).
Some of these species have higher than average densities at Haulover and the inlets, whereas others have lower than average densities. In par- ticular, the species C. planorbis and E. mexicanum have higher than average densities at Haulover and the inlets.
We recall that the second canonical variate contrasts northern and southern areas. T h e can- onical discriminate function coefficients (Table 6) indicate that, in order of importance, the most important species are Buliminella elegantissima (Fig- ure 6), Bolivina striatula, Quinqueloculina impressa (Figure 14), and Gaudryina exilis (Figure 12). Quin- queloculina impressa increases in density northward, whereas the other species increase southward.
Tables 5 and 6 show that the canonical variate
S M I T H S O N I A N C O N T R I B U T I O N S T O T H E M A R I N E S C I E N C E S
ST.LUCIE TRANSECT
HERMAN'S BAY
JOHN'S ISLAND
0 1 2 3 4
CANONICAL VARIATE I
FIGURE 2.—Plot of mean canonical variates 1 a n d 2.
HAULOVER SEBASTIAN VERO LINK JIM'S BUOY HERMAN'S ST. LUCIE BANANA JOHN'S BEACH PORT FLAT 195 BAY TRANSECT
ISLAND JENSEN
BEACH ST. LUCIE INLET
FIGURE 3.—Mean densities oi Ammobaculites exilis at I n d i a n River s a m p l i n g sites.
20 Oi (f)
3 160 Q
>
Q
El20
O
rr
UJ CD 3
8 0
4 0
<
UJ
Ammonia beccarii
HAULOVER SEBASTIAN VERO LINK JIM'S BUOY HERMAN'S ST. LUCIE BANANA JOHN'S BEACH PORT FLAT 195 BAY tm TRANSECT
ISLAND Jl^H ST. LUCIE
BEACH INLET
FIGURE 4.—Mean densities oi Ammonia beccarii at Indian River sampling sites.
I O O - I
T 1 1 1 r HAULOVER SEBASTIAN VERO LINK JIM'S
BANANA JOHN'S BEACH PORT FLAT ISLAND
BUOY HERMAN'S ST. LUCIE 195 BAY TRANSECT
JENSEN ST. LUCIE BEACH INLET
FIGURE 5.—Mean densities of Bolivina striatula at Indian River sampling sites.
SMITHSONIAN C O N T R I B U T I O N S T O T H E M A R I N E S C I E N C E S
lOO-i CO _ l <
80
>
Q
? 6 C
Li_
O rr
W40-1 CD '
20-
<
Buliminella elegantissima
T5 1 1 r
HAULOVER SEBASTIAN VERO LINK BANANA JOHN'S BEACH PORT
ISLANO
JIM'S BUOY HERMANS ST. LUCIE FLAT 195 BAY TRANSECT
JENSEN ST. LUCIE BEACH INLET
FIGURE 6.—Mean densities of Buliminella elegantissima at Indian River sampling sites.
2 0 n CO _ l <
o
Q
10-
LU CD
Z 5-|
Z <
LU
Cyclogyra planorbis
HAULOVER SEBASTIAN VERO LINK JIM'S BANANA JOHN'S BEACH PORT FLAT
ISLAND
BUOY HERMAN'S ST. LUCIE 195 BAY TRANSECT
JENSEN ST. LUCIE BEACH INLET
FIGURE 7.—Mean densities of Cyclogyra planorbis at Indian River sampling sites.
2 0 CO
<
O
> . 5 H
Li_
o rr
LU
m
10-
5-
<
LU
Elphidium excavatum
1 1 1 1 1 1 1 — HAULOVER SEBASTIAN VERO LINK JIM'S
BANANA JOHN'S BEACH PORT FLAT ISLAND
BUOY HERMAN'S ST. LUCIE 195 BAY TRANSECT
JENSEN ST. LUCIE BEACH INLET
FIGURE 8.—Mean densities oi Elphidium excavatum at Indian River sampling sites.
HAULOVER SEBASTIAN VERO LINK JIM'S BUOY HERMAN'S ST. LUCIE BANANA JOHN'S BEACH PORT FLAT 195 BAY TRANSECT
ISLAND J E N Sf .N ST. LUCIE BEACH INLET
FIGURE 9.—Mean densities oi Elphidium gunteri at Indian River sampling sites.
10 SMITHSONIAN C O N T R I B U T I O N S T O T H E M A R I N E S C I E N C E S
10- CO
_ l •
<
| 8
>
Q
2 *
Elphidium kugleri
HAULOVER SEBASTIAN VERO LINK JIM'S BANANA JOHN'S BEACH PORT FLAT
ISLAND
BUOY HERMAN'S ST. LUCIE 195 BAY TRANSECT
JENSEN ST. LUCIE BEACH INLET
FIGURE 10.—Mean densities oi Elphidium kugleri at Indian River sampling sites.
3 0 i CO _ l <
I 2 5
>
920H
15-
10-
< 5-|
UJ
Elphidium mexicanum
— i 1 1 1 1 1 1 1 —i 1 1 , HAULOVER SEBASTIAN VERO LINK JIM'S BUOY HERMAN'S ST LUCIE
BANANA JOHN'S BEACH PORT FLAT 195 BAY TRANSECT ISLAND J! 2 ? J : £ ! ST. LUCIE
BEACH INLET
FIGURE 11.—Mean densities oi Elphidium mexicanum at Indian River sampling sites.
HAULOVER SEBASTIAN VERO LINK JIM'S BUOY HERMANS ST. LUCIE BANANA JOHN'S BEACH PORT FLAT 195 BAY TRANSECT
ISLAND J E N. ?E N ST. LUCIE BEACH INLET
FIGURE 12.—Mean densities oi Gaudryina exilis at Indian River sampling sites.
20-i
HAULOVER SEBASTIAN VERO LINK JIM'S BUOY HERMAN'S ST. LUCIE BANANA JOHN'S BEACH PORT FLAT 195 BAY , _ „ _ TRANSECT
ISLAND Jl 5 5 ! : f l ST. LUCIE BEACH INLET
FIGURE 13.—Mean densities oi Nonionella auricula at Indian River sampling sites.
12 SMITHSONIAN C O N T R I B U T I O N S T O T H E M A R I N E S C I E N C E S
100-|
CO _ l <
3 8 0
>
O
— 60
4 0
20-
<
LU
Quinqueloculina impressa
BUOY HERMAN'S ST. LUCIE 195 BAY TRANSECT
JENSEN ST. LUCIE BEACH INLET HAULOVER SEBASTIAN VERO LINK JIM'S
BANANA JOHN'S BEACH PORT FLAT ISLAND
FIGURE 14.—Mean densities of Quinqueloculina impressa at Indian River sampling sites.
I O O - I CO _ l <
>
? 60-|
U_
o
tr
4 0 -
2 0 -
<
LU
Quinqueloculina seminula
— i 1 1 1 1 1 1 — HAULOVER SEBASTIAN VERO LINK JIM'S
BANANA JOHN'S BEACH PORT FLAT ISLAND
BUOY HERMAN'S ST. LUCIE 195 BAY TRANSECT
JENSEN ST. LUCIE BEACH INLET
FIGURE 15.—Mean densities of Quinqueloculina seminula at Indian River sampling sites.
HAULOVER SEBASTIAN VERO LINK JIM'S BUOY HERMAN'S ST. LUCIE BANANA JOHN'S BEACH PORT FLAT 195 BAY TRANSECT
ISLAND JI S ! f ,N ST. LUCIE BEACH INLET
FIGURE 16.—Mean densities oi Rosalina floridana at Indian River sampling sites.
\0-i CO - I <
3 Q 8
>
Q Z
;z
6o
CC UJ CD 4
<
UJ 2 -
Rosalina globular/s
HAULOVER SEBASTIAN VERO LINK JIM'S BUOY HERMANS ST. LUCIE BANANA JOHN'S BEACH PORT FLAT 195 BAY TRANSECT
ISLAND Jl t ! ? I / !1 ST. LUCIE BEACH I N L E T
FIGURE 17.—Mean densities oi Rosalina globulans at Indian River sampling sites.
14 SMITHSONIAN C O N T R I B U T I O N S T O T H E M A R I N E S C I E N C E S
3 0 0 CO _ l <
I
250>
2 0 0 -
150-
100
< 5 0 UJ
Total living individuals per replicate (20ml)
HAULOVER SEBASTIAN VERO LINK JIM'S BUOY HERMAN'S BANANA JOHN'S BEACH PORT FLAT 195 BAY
ISLAND
ST. LUCIE TRANSECT JENSEN ST. LUCIE
BEACH INLET FIGURE 18.—Mean densities of total living population at Indian River sampling sites.
analysis used a combination of some of the more abundant species, such as Bolivina striatula and Buliminella elegantissima, as well as some of the less abundant ones, such as Gaudryina exilis and Elphi- dium gunteri, for discriminating the various areas.
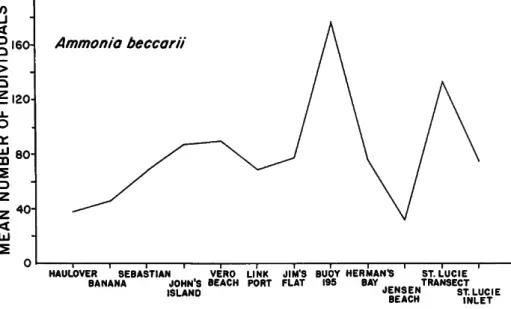
The most abundant species, Ammonia beccarii, is of little importance in the analysis as it occurs abun- dantly everywhere (Figure 4).
The third, fourth, fifth and sixth canonical variates are statistically significant (Table 3) and together account for about 36% of the total vari- ance. They do not, however, provide any partic- ularly interpretable contrasts. Perhaps the only information that can be gleaned from them is that the Indian River is extremely variable, a fact confirmed by the canonical analysis attempted on the individual stations.
We will briefly review where each species has its maximum or peak density relative to other areas. For standardization, we define a peak den- sity as one exceeding twice the average density of the species over the entire area.
At the Haulover station, Cyclogyra planorbis and Quinqueloculina seminula (Figure 15) exhibit peak densities. T h e Banana station has a maximum density achieved by Q. impressa, five times its average density. At Sebastian Inlet, Elphidium
mexicanum attains its maximum density, four times greater than average. The John's Island transect has peak densities for E. excavatum (Figure 8) and E. gunteri. At the Vero Beach transect, E. gunteri and Rosalina floridana reach their maximum den- sities of four to five times their average densities.
The Link Port transect also has a peak density for R. floridana. Jim's Flat has maximum densities for Ammobaculites exilis (Figure 3), C. planorbis, and E. kugleri (Figure 10). Quinqueloculina seminula is also abundant at Jim's Flat. T h e Buoy 195 tran- sect has a maximum density for Ammonia beccarii (Figure 4), by far the most abundant species in the Indian River (Table 5). Ammobaculites exilis, Bolivina striatula, Buliminella elegantissima, E. kugleri, and G. exilis also have high densities at the Buoy
195 transect. T h e Herman's Bay transect has maximum densities for Bolivina striatula, the sec- ond most abundant species in the Indian River, and Nonionella auricula. At Jensen Beach all species have densities below their average, except for G.
exilis, which maintains its average density. The St. Lucie transect has maximum densities for G.
exilis and R. globularis (Figure 17). Nonionella auri- cula and Q. seminula are also abundant. T h e St.
Lucie Inlet has maximum densities for Buliminella elegantissima and E. excavatum. T h e species C. plan-
orbis, E. kugleri, and R. globularis also have high densities at the St. Lucie Inlet.
This brief review indicates that various areas in the Indian River are characterized or discrim- inated by different abundances of the 15 most common species. The trend of increasing density southward is shown clearly in Figure 18, which plots the mean number of total living individuals per 20-ml replicate. With the exception of the Jensen Beach transect, the density of foraminifera
clearly increases in a southerly direction.
Species Diversity
T h e number of species found at the 12 areas is plotted on Figure 19 and listed in Table 5. In general there is an increase in the number of species encountered to the south. The greatest number of species was found at Buoy 195, Her- man's Bay, Jensen Beach, and St. Lucie transect.
In the northern half of the Indian River, Vero Beach had the greatest number of species encoun- tered.
Table 5 lists the values for the information function / / a t the 12 areas, and Figure 20 is a plot of them. The same trend of increasing species diversity to the south is evident. Because the information function gives less weight to rare species, the amplitude of the curve is diminished.
Some other differences are also notable. Maxima for the information function occur at Jim's Flat and Jensen Beach, and an increase rather than a decrease occurs from St. Lucie transect to St.
Lucie Inlet. This happens because the value of information function depends not only on the number of species but also upon their equitability (Gibson and Buzas, 1973).
A measure of species equitability, E (Buzas and Gibson, 1969), is listed in Table 5 and plotted on Figure 21. At Haulover, Banana, and Sebastian, equitability is nearly constant, and the informa- tion function's curve closely resembles the species number plot. At John's Island, Vero Beach, and Link Port, the equitability values are again con- stant but at a lower level, and the plot of the information function still resembles the species number plot. T h e Jim's Flat station has a rise in
species equitability, whereas Buoy 195 has a de- crease. The information function mimics this pat- tern and shows a higher value at Jim's Flat than at Buoy 195, the opposite of the species number plot. The same situation occurs at the remaining southern stations so that the information function plot closely resembles that of species equitability.
If the criterion for "species diversity" is the infor- mation function, then maxima occur at Jim's Flat and Jensen Beach, areas with high equitabilities and number of species. If the criterion for "species diversity" is the number of species, then Buoy
195, Herman's Bay, Jensen Beach, and St. Lucie transect would be chosen. In any case, a trend of increasing species diversity toward the south is observed.
Because the number of species is correlated with the number of individuals (Buzas et al., 1977), it is no surprise that the southern area has a higher number of species than the northern area. Figure 22 is a semilog plot of the number of individuals found in each area against the num- ber of species. The areas with the greatest number of species, Herman's Bay, St. Lucie transect, and Buoy 195, are also the areas with the greatest numbers of individuals. The Jensen Beach tran- sect appears as an outlier in Figure 22. Although
10 replicates were collected in this transect, only 939 individuals were found, making Jensen Beach the area with the lowest mean density in the entire Indian River (Table 5). Nevertheless, 49 species were identified at Jensen Beach, and be- cause the more abundant species occur there with low densities (Table 5), the equitability is higher than at adjacent stations. Consequently the infor- mation function reaches its maximum value at this transect.
We have not had an opportunity to investigate whether or not this anomalous pattern of low number of individuals and high number of species at Jensen Beach is due to some unique spatial pattern found only at that locality.
Distribution of Rare Species
The 15 most abundant species comprise 95%
of the total living population for all areas except
16 SMITHSONIAN C O N T R I B U T I O N S T O T H E M A R I N E S C I E N C E S
CO LU O LU 0 . CO
6 0
50-
4 0
rr 3 0 UJ
oo 2 0 -
10-
HAUL0VER SEBASTIAN VERO LINK JIM'S BUOY HERMANS ST. LUCIE BANANA JOHN'S BEACH PORT FLAT 195 BAY TRANSECT
ISLAND J! £ ! & ? ST. LUCIE BEACH INLET
FIGURE 19.—Number of species recorded at Indian River sampling sites.
3.0 -i
O 2.5-
I-O
z
3 2.0- U_
^ 1.5-
CC 1.0-
o
0 . 5 -
BU0Y HERMAN'S ST. LUCIE 195 BAY TRANSECT
JS 2 ! ! r £ ! ST. LUCIE BEACH INLET HAULOVER SEBASTIAN VERO LINK JIM'S
BANANA JOHN'S BEACH PORT FLAT ISLAND
FIGURE 20.—Values of information function at Indian River sampling sites.
i.o-i
o
H O
z 3 U_
>-
H _ l CO
<
h- 3 O UJ
0.8
0.6
0.4
0.2
HAULOVER SEBASTIAN VERO LINK JIM'S BUOY HERMANS ST. LUCIE BANANA JOHN'S BEACH PORT FLAT 195 BAY TRANSECT
ISLAND JENSEN ST. LUCIE BEACH INLET
FIGURE 21.—Values of equitability function at Indian River sampling sites.
6 0 r
50
CO UJ O Q_
CO Li_
O
* 3 0
UJ GO
20
1 0 -
HERMAN'S BAY QV B U O Y 195 'ST. LUCIE TRANSECT JENSEN BEACH
ST. LUCIE INLETO
JIM'S FLAT©
©VERO BEACH
° J O H N ' S ISLAND LINK PORT
HAULOVER
©SEBASTIAN INLET
© BANANA
S =-93.02 + 17.97 InN
j i i i • • • • J I I I L_L_L_l
200 1000
NUMBER OF INDIVIDUALS
FIGURE 22.—Semilog plot of individuals vs. species in the Indian River.
18 SMITHSONIAN CONTRIBUTIONS T O T H E M A R I N E SCIENCES
Jim's Flat, Herman's Bay, and Jensen Beach (Table 5). At Jim's Flat the addition of 78 Isha- mella apertura specimens brings the percentage from 88 to 96. Ishamella apertura could have been included with the most abundant species, as its grand total (79) is comparable to that of Ammo- baculites exilis (83). Because this species is a very unusual foraminifer (see "Systematic Catalog"), and all specimens except one occur at Jim's Flat, we decided to exclude it from the analysis of the abundant species.
At Herman's Bay four rare species must be included to attain 95% of the total living popu- lation. These are Ammobaculites cf. exilis (53), Hop- kinsina pacifica (22), Quinqueloculina poeyana (16), and Bolivina sp. B (13). The addition of A. cf. exilis alone brings the total to 95%, and it is possible that this species is merely a large grained form of A. exilis sensu stricto, which was included among the 15 most abundant species.
As pointed out earlier, Jensen Beach is very unusual because the total living population is low, and yet a large number of species was re- corded there. At Jensen Beach eight species must be added to bring the total to 95%. These are:
Hopkinsina pacifica (40), Quinqueloculina poeyana (9), Elphidium advenum (8), Rosalina concinna (8), Fursen- koina fusiformis (6), Bolivina sp. B (5), Nonionella opima (5), and Quinqueloculina cf. akneriana (5). This is the only area where more than 20 species are required to obtain 95% of the total living popu- lation.
The great disparity in densities among areas, the positive correlation between numbers of spe- cies and numbers of individuals, and the fact that
15 species almost always make up 95% of the total living population suggest that the use of rare species to discern meaningful spatial patterns is extremely hazardous. Because the probability of encountering a rare species is low, it is difficult to tell whether a species was not found because of chance or because it really wasn't there. On the other hand, the relatively large number (78) of Ishamella apertura found at Jim's Flat while only one specimen was found elsewhere does suggest that this species may have a very restricted dis- tribution. A similar, but more tenuous, pattern
may exist for Hopkinsina pacifica, Quinqueloculina poeyana, and Bolivina sp. B. These species were
found at the adjacent Herman's Bay and Jensen Beach stations and were members of those species that make up 95% of the total living population.
Finally, two species occur at St. Lucie Inlet and St. Lucie transect and nowhere else in the Indian River. Peneroplis pertusus and Sorites marginalis are well-known tropical species. They occur abun- dantly in Florida Bay (Bock, 1971) and are prob- ably at the northernmost limits of their ranges.
Discussion
Ideally, studies concerned with the distribution of organisms would sample all areas simultane- ously over a long period to average out seasonal fluctuations in density. Unfortunately, this is rarely feasible due to economic and time con- straints. In the present study, samples were taken in February, March, April, J u n e , September, and December (Table 2). Data from Link Port taken over a four-year period (Buzas, 1978; 1982; un- published) indicate a substantial variation in den- sity from month to month. In general the winter months (December, February, and March) have low densities, J u n e a moderate density, and April a high density. If seasonality, or time, rather than location were responsible for the density pattern observed, we would expect moderate densities at Haulover, Banana, Sebastian, Jim's Flat, and St.
Lucie Inlet (all sampled in June). We would expect low densities at John's Island, Link Port, Buoy 195, Herman's Bay, and St. Lucie transect (all sampled in winter). Finally, we would expect a high density at Jensen Beach (sampled in April).
Figure 18 clearly shows this is not the case. In- stead, there is an overall increase in density south- ward, with the exception of Jensen Beach, which has the lowest density of anywhere! Therefore, we believe that the observed density pattern is a consequence of the area sampled rather than time of sampling.
When studying the distribution of foramini- fera, researchers usually divide the study area into faunal zones or biofacies (Boltovskoy and Wright, 1976). The biofacies are defined either on the
basis of examination of the data or by the use of some numerical or statistical technique (Buzas, 1979). Examination of data usually shows that boundaries between biofacies are rarely discrete.
However, the use of some numerical techniques, such as cluster analysis, forces samples into one group or another, and the amount of overlap may not be apparent. The results of the canonical variate analysis performed on the 15 most abun- dant species in the Indian River (Figure 2) shows that the inlets and Haulover are distinct from other areas. They do not, however, form a ho- mogeneous group themselves. Each is distinct and would have to be assigned its own biofacies. The second canonical axis shows a north-south trend or arrangement of areas. St. Lucie transect is clearly different from Banana or John's Island, but the confidence circles from area to area over- lap. At no point is there an indication of a simple break dividing, for example, the area into north and south biofacies. Consequently, we have de- cided not to designate any biofacies but to allow Figure 2 to stand as a representation of the fora- miniferal distribution in the Indian River.
Young et al. (1976) reported an increase in density of decapods southward in the Indian River. In the adjacent ocean, Gore et al. (1978) found the same trend for the decapods inhabiting the sabellariid worm reefs that parallel the barrier island. O n the other hand the macrobenthos, mostly polychaetes, exhibit a trend of decreasing density southward (Young et al., 1976; Young and Young, 1977). Amphipods inhabiting sea- grass also have lower densities in southern areas as well as near inlets (Nelson et al., 1982). The decrease in density of macrobenthos and amphi- pods was attributed to predation by decapods on the former (Young et al., 1976; Young and Young, 1977) and by decapods and fish on the latter (Nelson et al., 1982).
Predation of foraminifera is common (Lipps and Valentine, 1970), and experiments indicate that foraminiferal densities in the Indian River are regulated by predation (Buzas, 1978; 1982).
Buzas and Carle (1979) found foraminifera in the guts of deposit feeders, among them polychaetes and decapods. Unfortunately we do not know
whether one group is more important in regulat- ing foraminiferal density than the other. Conse- quently we cannot speculate with confidence as to whether or not the increase in foraminiferal densities southward is due to a change in preda- tion pressure. The increase in density does corre- late positively with increasing density of decapods and negatively with the densities of polychaetes and amphipods.
Young et al. (1976), Young and Young (1977), and Nelson et al. (1982) have pointed out a gradient of decreasing environmental variability toward the southern end of the Indian River.
This decreasing gradient is positively correlated with the increase in foraminiferal density to the south. A similar pattern of higher foraminiferal density in an area of less environmental variabil- ity was reported by Buzas et al. (1977) in Jamaica, West Indies.
Hydrographically, the inlets and Haulover dif- fer from other areas because they represent ex- tremes of tidal influence. The inlets experience strong, diurnal tidal changes, whereas Haulover, in the "blind" end of the River, experiences al- most no tidal influence at all. Each of these areas is discriminated by changes in the densities of the most abundant foraminiferal species in the Indian River. While species diversity generally increases southward, we observed no increase in species diversity at the three inlets. This contrasts mark- edly with Gilmore (1977), who found the highest number offish species at inlets, and Mook (1980), who found an increased diversity of fouling or- ganisms at Fort Pierce Inlet as compared to Vero Beach.
No studies of foraminifera have been made in estuaries near the Indian River. T o the north in Pamlico Sound, North Carolina, Grossman (1967) defined several biofacies. Some biofacies are characterized by species such as Elphidium excavatum and E. gunteri, which also occur in the Indian River. In general, however, the Pamlico Sound fauna is very different from the Indian River fauna.
Farther south, foraminifera have been studied in Florida Bay and adjacent waters by Stubbs (1940), Bock et al. (1971), and Rose and Lidz
20 SMITHSONIAN C O N T R I B U T I O N S T O T H E M A R I N E S C I E N C E S
(1977). Bock (1971) and Rose and Lidz (1977) have defined biofacies containing abundant Am- monia beccarii, the dominant species in the Indian River. T h e foraminiferal fauna of these southern waters, however, does not closely resemble the fauna from the Indian River. T h e sediments to the south are mainly carbonates (Milliman et al.,
1972), unlike the quartz sands of the Indian River. This carbonate sedimentary regime marks the northernmost extension of the Bahamian or Caribbean faunal province (Buzas and Culver, 1980), thus explaining why the foraminiferal spe- cies are so different between central and southern Florida.
Systematic Catalog
The following catalog uses the general sys- tematic structure of the Treatise of Paleontology (Loeblich and Tappan, 1964), even though we believe the overall taxonomic philosophy of the
Treatise is too rigid. For example, we have assigned species with both optically radial and granular walls to the genus Elphidium, although strict ad- herence to the Treatise would have placed them in different superfamilies. We believe, however, the systematic arrangement used here is more useful than an alphabetical scheme.
Where possible, our synonymies are based on direct inspection of the types cited. In a few cases the only specimens accessible were from Pacific collections or were topotypes.
Illustration of foraminifera is a continuing source of difficulty for researchers. Although it has become fairly easy to take high quality scan- ning electron micrographs, they do not convey the transparent qualities of foraminiferal tests, a severe drawback, as most work is done with op- tical microscopes. Furthermore, the gold coating necessary for scanning electron microscopy makes the specimen opaque and very difficult to use, subsequently, under a binocular microscope. T h e alternative, a good drawing by a scientific illus- trator, does not harm the specimen and produces a view of the specimen as it appears under an optical microscope. For anything more than a
small number of views, however, the time and expense are rarely justified.
In this study we have attempted to use scan- ning electron micrographs of very thinly coated specimens. The gold coating was 50 angstroms, about one-quarter of the thickness normally used.
This coating is virtually transparent, and the specimens are still quite useful for optical work.
The electron micrographs, however, tend to have charged areas and strange scan lines due to the inadequate conductivity of the thin coating. By using very low accelerating voltages (less than 5 KV), we were able to hold these bad effects to a minimum. In spite of this, a few of the figures have some visibly charged areas. We feel, how- ever, that the preservation of the optical charac- ters of the specimens warrants the defects in the figures.
Specimens deposited in the National Museum of Natural History, Smithsonian Institution, are listed under the abbreviation " U S N M " (for the collection numbers of the former United States National Museum). Representatives of most spe- cies are deposited in the Indian River Coastal Zone Museum, Fort Pierce, Florida.
HIERARCHY.—From order through genus:
Order FORAMINIFERIDA Eichwald, 1830
Suborder ALLOGROMIINA Loeblich and T a p p a n , 1961 Superfamily LAGYNACEA Schultze, 1854
Family ALLOGROMIIDAE Rhumbler, 1904 Genus Allogromia Rhumbler, 1904
Suborder TEXTULARIINA Delage and Herouard, 1896 Superfamily LITUOLACEA de Blainville, 1825
Family HORMOSINIDAE Haeckel, 1894 Subfamily HORMOSININAE Haeckel, 1894
Genus Reophax Montfort, 1808 Family LITUOLIDAE de Blainville, 1825
Subfamily LITUOLINAE de Blainville, 1825 Genus Ammobaculites Cushman, 1910 Family TROCHAMMINIDAE Schwager, 1877
Subfamily TROCHAMMININAE Schwager, 1877 Genus Trochamina Parker and Jones, 1859 Family ATOXOPHRAGMIIDAE Schwager, 1877
Subfamily VERNEUILININAE Cushman, 1911 Genus Gaudryina d'Orbigny, 1839 Suborder MILIOLINA Delage and Herouard, 1896
Superfamily MILIOLACEA Ehrenberg, 1839 Family FISCHERINIDAE Millet, 1898
Subfamily CYCLOGYRINAE Loeblich and T a p p a n , 1961
Genus Cyclogyra Wood, 1842 Family NUBECULARIIDAE Jones, 1875
Subfamily OPHTHALMIDIINAE Weisner, 1920 Genus Edentostomina Collins, 1958 Genus Weisnerella Cushman, 1933 Subfamily SPIROLOCULININAE Weisner, 1920
Genus Spiroloculina d'Orbigny, 1826 Family MILIOLIDAE Ehrenberg, 1839
Subfamily QUINQUELOCULININAE Cushman, 1917 Genus Quinqueloculina d'Orbigny, 1826 Genus Massilina Schlumberger, 1893 Genus Pateoris Loeblich and T a p p a n , 1953 Genus Triloculina d'Orbigny, 1826 Subfamily MILIOLINELLINAE Vella, 1957
Genus Miliolinella Weisner, 1931 Genus Biloculinella Weisner, 1931
Genus Scutulons Loeblich and T a p p a n , 1953 Subfamily TUBINELLINAE Rhumbler, 1906
Genus Tubinella Rhumbler, 1906 Genus Articulina d'Orbigny, 1826 Ishamella, new genus
Family SORITIDAE Ehrenberg, 1839 Subfamily PENEROPLINAE Schultze, 1854
Genus Peneroplis Montfort, 1808 Subfamily SORITINAE Ehrenberg, 1839
Genus Sorites Ehrenberg, 1839
Suborder ROTALIINA Delage and Herouard, 1896 Superfamily NODOSARIACEA Ehrenberg, 1838
Family NODOSARIIDAE Ehrenberg, 1838 Subfamily NODOSARIINAE Ehrenberg, 1838
Genus Lagena Walker and J a c o b Family GLANDULINIDAE Reuss, 1860
Subfamily OOLININAE Loeblich and T a p p a n , 1961 Genus Fissurina Reuss, 1850
Superfamily BULIMINACEA Jones, 1875 Family TURRILINIDAE Cushman, 1927
Subfamily TURRILININAE Cushman, 1927 Genus Buliminella Cushman, 1911 Family BOLIVINITIDAE Cushman, 1927 Genus Bolivina d'Orbigny, 1839 Family BULIMINIDAE Jones, 1875
Subfamily BULIMININAE Jones, 1875 Genus Bulimina d'Orbigny, 1826
Subfamily PAVONININAE Eimer and Fickert, 1899 Genus Pavonina d'Orbigny, 1826
Family UVIGERINIDAE Haeckel, 1894
Genus Hopkinsina Howe and Wallace, 1932 Genus Trifarina Cushman, 1923
Superfamily DISCORBACEA Ehrenberg, 1838 Family DISCORBIDAE Ehrenberg, 1838
Subfamily DISCORBINAE Ehrenberg, 1838 Genus Rosalina d'Orbigny, 1826 Genus Stetsonia Parker, 1954
Family GLABRATELLIDAE Loeblich and T a p p a n , 1964 Genus Glabratella Dorreen, 1948
Genus Glabratellina Seiglie and Bermudez, 1965 Superfamily SPIRILLINACEA Reuss, 1862
Family SPIRILLINIDAE Reuss, 1862 Subfamily SPIRILLININAE Reuss, 1862
Genus Mychostomina Berthelin, 1881 Superfamily ROTALIACEA Ehrenberg, 1839
Family ROTALIIDAE Ehrenberg, 1839 Subfamily ROTALIINAE Ehrenberg, 1839
Genus Ammonia Briinnich, 1772 Family ELPHIDIIDAE Galloway, 1933
Subfamily ELPHIDIINAE Galloway, 1933 Genus Elphidium Montfort, 1808
Genus Haynesina Banner and Culver, 1978 Superfamily ORBITOIDACEA Schwager, 1876
Family EPONIDIDAE Hofker, 1951 Genus Eponides de Montfort, 1808 Family CIBICIDIDAE Cushman, 1927
Subfamily CIBICIDINAE Cushman, 1927 Genus Cibicides de Montfort, 1808 Family PLANORBULINIDAE Schwager, 1877
Genus Planorbulina d'Orbigny, 1826 Family CYMBALOPORIDAE Cushman, 1928
Genus Cymbaloporella Cushman, 1928 Superfamily CASSIDULINACEA d'Orbigny, 1839
Family CAUCASINIDAE Bykova, 1959
Subfamily FURSENKOININAE Loeblich and T a p p a n , 1961
Genus Fursenkoina Loeblich and T a p p a n , 1961 Genus Sigmavirgulina Loeblich and T a p p a n , 1957 Family CASSIDULINIDAE d'Orbigny, 1839
Genus Cassidulina d'Orbigny, 1826 Family NONIONIDAE Schultze, 1854
Subfamily NONIONINAE Schultze, 1854 Genus Nonion de Montfort, 1808 Genus Nonionella Cushman, 1926 Family ANOMALINIDAE Cushman, 1927
Genus Hanzawaia Asano, 1944
Genus Allogromia Rhumbler, 1904
?Allogromia species
Since the technique used in preparing the sam- ples included several acetone rinses and drying under heat lamps, there is a good possibility that most of the allogromids present were destroyed.
Perhaps these specimens are not Allogromia at all and may merely be pieces of debris that were stained by the rose bengal.
Specimens scattered throughout the Indian River are thus referred. (Total: 12; range: 0-3.)