i
DESIGNING SUPPORTING EQUIPMENT AND RE–LAYOUT
TO INCREASE PRODUCTIVITY AT AXLE SHAFT MACHINING LINE
By
Imam Nurhidayat ID No. 004201300023
A Thesis
presented to the Faculty of Engineering President University in partial fulfilment of the requirements of Bachelor Degree
in Engineering Major in Industrial Engineering
2017
i
THESIS ADVISOR
RECOMMENDATION LETTER
This thesis entitled “Designing Supporting Equipment and Re- layout to Increase Productivity at Axle Shaft Machining Line”
prepared and submitted by Imam Nurhidayat in partial fulfilment of the requirements for the degree of Bachelor Degree in the Faculty of Engineering has been reviewed and found to have satisfied the re- quirements for a thesis fit to be examined. I therefore recommend this thesis for Oral Defence.
Cikarang, Indonesia, 30 January 2017
Johan Krisnanto Runtuk, S.T., M.T
ii
DECLARATION OF ORIGINALITY
I declare that this thesis, entitled “Designing Supporting Equipment and Re-layout to Increase Productivity at Axle Shaft Machining Line” is, to the best of my knowledge and belief, an original piece of work that has not been submitted, either in whole or in part, to another university to obtain a degree.
Cikarang, Indonesia, 30 January 2017
Imam Nurhidayat
iii
DESIGNING SUPPORTING EQUIPMENT AND RE–LAYOUT
TO INCREASE PRODUCTIVITY AT AXLE SHAFT MACHINING LINE
By
Imam Nurhidayat ID No. 004201300023
Approved by
Johan Krisnanto Runtuk, S.T., M.T Thesis Advisor I
Anastasia L Maukar, S.T., M.Sc., M.MT Thesis Advisor II
Ir. Andira, M.T Head of Study Program
iv
ABSTRACT
Car manufacturer nowadays has high demand. PT BSC as a supplier of car com- ponents (Rear Axle Unit) has a project to increase its productivity to fulfil its cus- tomer demand, whilst reducing its labour cost. The new policy makes the perfor- mance of production line become lower with axle shaft machining is only 68% for 101.5” cycle time and 34 unit/hour production rate. The seven-step PDCA is in- troduced to tackle the problem with equipment design and facilities design are mixed to accommodate the improvement proposal. The Fishbone analysis result- ing five root causes suspected as waste that causing a high cycle time of A/S ma- chining line with only four root causes are feasible to be solved. High frequency task, long distance machine placement, and ineffective painting process are the problem that faces in this study. The alternatives of trolley, painting cover, and layout arrangement is proposed to overcome those obstacles and increase the productivity, which reduce overtime cost in response to lower labour cost. New equipment and arrangement of layout resulting in productivity increase from 68%
to 82% or by 14%, overtime can be reduced from 3.4 hours to only 1.3 hours which affecting up to 60% reduction estimation for labour cost.
Keywords: productivity, equipment design, facility layout, labour cost, process waste, seven-step PDCA,
v
ACKNOWLEDGEMENT
First of all, the greatest gratitude to Allah SWT who give the blessing and time as a gift towards researcher in completing the thesis. This thesis being made as a par- tial requirement to obtain a Bachelor Degree in the Faculty of Engineering. Ease in building this thesis was not apart from the support of other hands. Therefore, the researcher would like to say the greatest thanks to:
1. My parents in supporting and embrace the researcher till the end.
2. My thesis advisor, Mr Johan and Mam Anastasia, who are always supportive and responsive in giving useful feedback.
3. Other lecturers who have transferred their knowledge to me.
4. PT BSC that permits me to execute my research in the production floor.
5. Head of Production Department, Head of Section, Production Foreman, Group Leaders of Axle Shaft machining line, whose guide me during the observation.
6. All operators Group A and Group B of A/S machining line, your cooperation are counted the most.
7. Another department in PT BSC who’s being a new friend during the research and feedback.
Last but not the least all of the support from my fellow friends in IE 2013, my clubs Choirs, GPS, News-Casting, Merpati Putih, and AIESEC, the togetherness are long lasting. In the end, hope that this thesis may useful for the future research and development.
vi
CONTENTS
THESIS ADVISOR RECOMMENDATION LETTER ... i
DECLARATION OF ORIGINALITY ... ii
APPROVAL PAGE ... iii
ABSTRACT ... iv
ACKNOWLEDGEMENT ... v
CONTENTS ... vi
LIST OF TABLES ... ix
LIST OF FIGURES ... x
LIST OF TERMINOLOGIES ... xii
CHAPTER I INTRODUCTION ... 1
1.1. Problem Background ... 1
1.2. Problem Statement ... 3
1.3. Objectives ... 3
1.4. Scope ... 3
1.5. Assumption ... 3
1.6. Research Outline ... 4
CHAPTER II LITERATURE STUDY ... 5
2.1. Product Knowledge – Axle Shaft ... 5
2.2. Productivity ... 6
2.2.1. Tools ... 6
2.2.2. Waste ... 8
2.3. Work Analysis ... 8
2.3.1. Work Standard Table & Combined Work Standard Table ... 8
2.3.2. Material Handling ... 9
2.3.3. Anthropometry ... 10
2.4. Plan, Do, Check, and Act (PDCA) Cycle ... 10
2.5. Engineering Design ... 11
2.5.1. Design Process ... 11
2.5.2. Product Design Specification ... 13
vii
2.6. Facilities Design ... 13
2.6.1. Systematic Layout Planning (SLP) ... 13
2.6.2. Flow Process Pattern ... 14
2.6.3. From-To Chart ... 14
2.6.4. Relationship Chart ... 15
2.6.5. Relationship Diagram... 15
2.6.6. Computerised Relative Allocation of Facilities Technique (CRAFT) 16 CHAPTER III RESEARCH METHODOLOGY ... 17
3.1. Research Methodology ... 17
3.2. Data Collection ... 17
3.3. Research Setting ... 17
3.4. Analysis ... 18
3.4.1. Productivity ... 18
3.4.2. Product Design ... 18
3.4.3. Facilities Design ... 18
3.5. Findings ... 18
3.6. Research Framework ... 19
CHAPTER IV DATA COLLECTION AND ANALYSIS ... 20
4.1. Initial Observation ... 20
4.2. Defining the Problem ... 20
4.3. Current Condition ... 22
4.3.1. Production Process ... 23
4.3.2. Operator Movement ... 23
4.3.3. Work Elements ... 24
4.4. Root Cause Identification and Verification ... 25
4.4.1. Yamazumi Chart ... 25
4.4.2. Fishbone Analysis ... 26
4.4.3. Root Causes Verification ... 27
4.5. Developing Alternatives ... 30
4.5.1. Problem 1 Handling Equipment ... 30
4.5.2. Problem 2 Painting Cover ... 31
viii
4.5.3. Problem 3 Layout Arrangement ... 32
4.6. Alternatives Evaluation ... 33
4.6.1. Equipment ... 33
4.6.2. Painting Cover ... 34
4.6.3. Facility Layouts ... 35
4.7. Findings ... 37
4.7.1. Improvement 1 Handling Trolley... 37
4.7.2. Improvement 2 Painting Cover ... 40
4.7.3. Improvement 3 Layout Arrangement ... 42
4.8. Result Review ... 43
4.8.1. Project Timeline ... 43
4.8.2. Movement Frequency... 44
4.8.3. Workstation Performance... 45
4.8.4. Line Productivity ... 46
4.8.5. Cost Benefit Review ... 47
4.9. Standardisation ... 48
4.9.1. Operator Movement ... 48
4.9.2. Work Elements ... 49
4.10. Summary of the Implementation ... 49
4.10.1. Supporting Equipment ... 49
4.10.2. Re-layout Planning ... 49
4.10.3. Benefit of the Project ... 50
CHAPTER V CONCLUSION AND RECOMMENDATION ... 52
5.1. Conclusion ... 52
5.2. Recommendation... 52
REFERENCES ... 53
APPENDIX 1 – Combination Work Standard Table (Initial Condition) ... 55
APPENDIX 2 – Combination Work Standard Table (After Improvement) ... 56
ix
LIST OF TABLES
Table 2. 1 Example of Work Standard Table ... 9
Table 2. 2 Example of Combined Work Standard Table ... 9
Table 2. 3 Example of From-To Chart ... Error! Bookmark not defined.15 Table 4. 1 Overtime Requirement A/S Machining Line ... 21
Table 4. 2 Plan of Project Timeline April – May 2016 ... 21
Table 4. 3 Work Standard Table ... 24
Table 4. 4 “5-Why” Analysis for Finding Root Cause ... 26
Table 4. 5 Alternative Evaluation for Problem 1 ... 33
Table 4. 6 Alternative Selection for Handling Trolley ... 33
Table 4. 7 Scoring Chart for Problem 1 ... 34
Table 4. 8 Alternative Evaluation for Problem 2 ... 34
Table 4. 9 Scoring Chart for Problem 2 ... 35
Table 4. 10 Flow Matrix for CAFT Input ... 35
Table 4. 11 Design Requirement for Trolley ... 38
Table 4. 12 Specification Requirement for Painting Cover ... 41
Table 4. 13 Project Review ... 44
Table 4. 14 Movement Frequency after Improvement... 44
Table 4. 15 Improvement Result ... 46
Table 4. 16 Overtime Cost Estimation ... 47
Table 4. 17 Work Standard Table ... 49
x
LIST OF FIGURES
Figure 2. 1 Rear Axle Assembly (Illustration) ... 5
Figure 2. 2 Axle Shaft for MPV Car and SUV Car (Illustration) ... 5
Figure 2. 3 Line Performance of PT XYZ (Example) ... 7
Figure 2. 4 Workstation Processing Time in Line A of PT XYZ (Example) ... 7
Figure 2. 5 PDCA Cycle Breakdown to Seven-Steps ... 10
Figure 2. 6 Primary Design Process of Engineering Design ... 12
Figure 2. 7 Pattern of Facilities Design Process ... 14
Figure 2. 8 Example of a Flow Pattern ... 14
Figure 2. 9 Example of Relationship Chart ... 15
Figure 2. 10 Example of Relationship Diagram. Error! Bookmark not defined.16 Figure 3. 1 Research Framework ... Error! Bookmark not defined.19 Figure 4. 1 Line Productivity of Mid-April 2016 ... 20
Figure 4. 2 Process Flow in Axle Shaft Line ... 22
Figure 4. 3 Work Station Cycle Time of A/S Machining Line ... 22
Figure 4. 4 Production Process Flow ... 23
Figure 4. 5 Yamazumi Chart of WS 5 ... 25
Figure 4. 6 Fishbone Diagram in Finding Root Cause of Problem in WS 5... 27
Figure 4. 7 Painting Cover (Left: SUV; Right: MPV) ... 28
Figure 4. 8 Work Station 5 Layout... 29
Figure 4. 9 Handling Trolley Conceptual (Left: In-Line; Right: Square) ... 30
Figure 4. 10 Painting Cover (Illustration) ... 31
Figure 4. 11 Brushing Area (Painted Area) ... 31
Figure 4. 12 Activity Relationship Chart in Station 5 ... 32
Figure 4. 13 Activity Relationship in String Diagram ... 32
Figure 4. 14 Initial Layout Scheme for Workstation 5 ... 36
Figure 4. 15 Iteration 1 for Layout Arrangement ... 36
Figure 4. 16 “4-in-1” Handling Trolley ... 39
Figure 4. 17 Detailed Drawing for Trolley ... 40
xi
Figure 4. 18 Four-in-One Painting Cover ... 41
Figure 4. 19 Painting Booth Modification ... 42
Figure 4. 20 New Layout Arrangement ... 43
Figure 4. 21 Yamazumi Chart after Improvement ... 45
Figure 4. 22 Workstation Processing Time after Improvement ... 45
Figure 4. 23 Line Performance on June 2016 ... 46
Figure 4. 24 Reduction in Personnel Movements (Left) and Cycle Time (Right) 50 Figure 4. 25 Throughput Result (Left) and Overall Performance (Right) ... 51
Figure 4. 26 Labour Overtime (Left) and Cost Reduction (Right) ... 51
xii
LIST OF TERMINOLOGIES
Yamazumi chart : Stacked bar chart consists of the work elements
Cycle time (C/T)
: The period required to complete one cycle of an opera- tion, or to complete a function, job, or task from start to finish
MPV : Abbreviation of “Multi-Purpose Vehicle”, a family car or pick-up cars; similar with “APV” (All-Purpose Vehicle) depends on the manufacturer
Processing time : Time of completion a job
Productivity : A measure of how well a system converts an input into a product/output. The rate is measured by dividing output by the input/requirement.
v
ABSTRACT
Car manufacturer nowadays has high demand. PT BSC as a supplier of car com- ponents (Rear Axle Unit) has a project to increase its productivity to fulfil its cus- tomer demand, whilst reducing its labour cost. The new policy makes the perfor- mance of production line become lower with axle shaft machining is only 68% for 101.5” cycle time and 34 unit/hour production rate. The seven-step PDCA is in- troduced to tackle the problem with equipment design and facilities design are mixed to accommodate the improvement proposal. The Fishbone analysis result- ing five root causes suspected as waste that causing a high cycle time of A/S ma- chining line with only four root causes are feasible to be solved. High frequency task, long distance machine placement, and ineffective painting process are the problem that faces in this study. The alternatives of trolley, painting cover, and layout arrangement is proposed to overcome those obstacles and increase the productivity, which reduce overtime cost in response to lower labour cost. New equipment and arrangement of layout resulting in productivity increase from 68%
to 82% or by 14%, overtime can be reduced from 3.4 hours to only 1.3 hours which affecting up to 60% reduction estimation for labour cost.
Keywords: productivity, equipment design, facility layout, labour cost, process waste, seven-step PDCA,
1
CHAPTER I INTRODUCTION
1.1.Problem Background
Currently, passenger car in Indonesia is booming; which has reached more than 12.000.000 units in 2014 (Badan Pusat Statistik Indonesia, 2017). This demand pushes the manufacturer to increase its production capacity. One of the manufac- turers, Toyota Motor Manufacturing Indonesia (TMMIN), has upgraded its capac- ity up to 250.000 units/year in 2014 (PT TMMIN, 2015). The other manufactur- ers, did the expansion and make-up Indonesian Automotive-Industries’ capacity up to ~1.5 million units/year (Kementrian Perindustrian Republik Indonesia, 2016).
The supplier is justifying its production process to be more productive, better quality, and optimum in cost to fulfil the rising capacity of its customer. There are several alternatives to achieve the target, such as facilities design and handling system (Halim, et al., 2015); industrial automation or supporting tools and equip- ment (Neumann, et al., 2002). In this case, PT BSC in Karawang—a supplier of rear axle (R/A) for Toyota (TMMIN)—is required to increase its productivity. PT BSC has five production lines which consists of housing assembly (H/A), hous- ing–end machining (H/E), axle shaft machining (A/S), painting (P/B), and R/A.
In April 2016, the management, conduct a man power reduction with the aim to reduce labour costs in the amount of IDR 100 million/year/person. This action affects its production floor productivity and requires the company to review the line performance. The result shows that A/S (68%) is the least productive among the other lines. This line only capable to produce 34 pairs/hour with a cycle time of 101.5 seconds. The condition has a consequence to fulfil 119 pairs/shift by 3.4 overtime (O/T) hours/shift/day. This costs IDR 76.000/MP/hour or ~IDR 2.5 mil- lion/day (10 MP/day; 7 working hours), it is more than IDR 600 million/years (22 working days/month; 12 months/year).
2 Das, et al., (2014), said that low productivity is caused by waste, such as waiting time, defective product, handling, layout, inventory, etc. The company also sug- gests that manual tasks and handling are affecting the productivity. The poor working method has contributed to the increasing of processing time. The higher processing time can reduce the production rate (output) that impact in low produc- tivity.
From the initial observation of the company, it was known that there were prob- lems on handling method and facility layout. These factors affect the travel dis- tance between the posts. The equipment is impacting the material handling meth- od which affecting the handling capacity and require to add more tasks. Therefore, it is needed to investigate the work station (W/S) that has problematic issue to di- rect the improvement.
The investigation in this study uses a continuous improvement strategy of PDCA which divided into seven-step processes. Previously, this method was used to re- duce corneal injury rate and suggests that the method gives simpler and cost- effective (Vetter, et al., 2012). In industrial application, Santos, et al., (2015) pre- sent a case in the automotive industry in improving the working condition and putting lean manufacturing to reduce 80% of the defect rates. This method then combined with engineering design and facilities design steps to suggest the proper improvement alternatives for the production floor.
The initial observation in A/S resulting that the fifth W/S has the highest cycle time among the four others. It takes 101.5 seconds to produce a pair of axle shaft whilst the T/T is only 71 seconds. As it mentions in advance about the potential factors, thereof, the work analysis, facilities, and equipment investigation are fo- cussing to the fifth station. The review of this station is focused on the manual job which grouped into “handling”, non-added value, and irregular jobs. From those factors, the possible improvement is proposed and implemented, such as proper supporting tools and/or layout re-arrangement.
3 1.2.Problem Statement
From the background, it can be drawn the statements, which are:
What kind of proper support equipment that can help to increase the per- formance of the A/S machining line?
Which facility layout arrangement that might improve the productivity of the A/S machining line?
How much is the benefit of those improvements?
1.3.Objectives
According to the statement, this study aims to:
Design and propose equipment that fit to help increasing the productivity.
Provide and propose layout alternatives that can help to increase the produc- tivity.
Estimate the cost benefit of the improvement in reducing the labour cost.
1.4.Scope
Due to the limitation of time and authorities from the company, the research only conducts with condition below:
The observation is done in A/S machining line.
Observation is conducted during work days (Monday – Friday).
The observed shift is only for shift one (08:30 – 16:00).
The type of products only MPV and SUV.
Any improvement is addressed to improve the workforce task.
Labour cost estimation is for overtime work.
1.5.Assumption
In order to calculate, analyse, and suggest the new model, there are some assump- tions that should be set. Those assumptions are:
All of the manpower has the same level of skill.
Machines and equipment are running normally.
Handling process and method for all models are similar.
Materials that being process has its fix requirement from the customer.
4
There are two working shifts/day and seven working hours/shift with third shift may use for overtime (maximum overtime is two hours/shift).
The working hour is estimated to 14 hours per day, 22 workdays/month, 12 months in a year, and five workdays per week, with 52 weeks a year.
1.6.Research Outline Chapter I Introduction
The introduction contains a brief explanation of the current condi- tion at the factory, and its business environment. This chapter also briefly review some previous research in other industry sector. This section gives research statement which leads to the objectives and mentioning the limitation and assumption of the research.
Chapter II Literature Study
This chapter explains company’s product briefly, also explain the materials that used in this study from the analysis till standardisa- tion of the improvement. Those data and literature are gathered from internet, books, journals, or report articles.
Chapter III Research Methodology
In this chapter, the methods and the framework of the research are explained. It is also the brief step of the methodology that use for data analysis.
Chapter IV Data Collection and Analysis
This section shows the analysis and result of the project. It starts with searching the problematic station and finding the waste. After that, the study will assess those wastes whether to be reduced or eliminate, and proposing improvement and evaluation. In the end it defines the standardisation that can be used as the result of the pro- posed improvement, also present the result of the project.
Chapter V Conclusion and Recommendation
The fifth chapter is the summary of the project, thus briefly review the project and presenting its result. This section also defines the suggestion for the future project/improvement.
5
CHAPTER II
LITERATURE STUDY
2.1.Product Knowledge – Axle Shaft
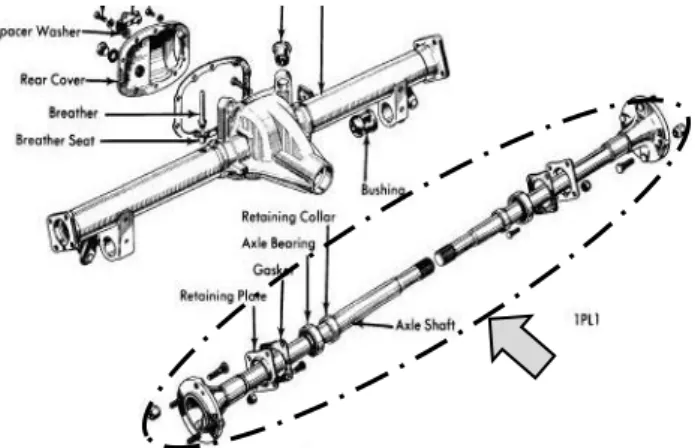
The rear axle unit is the last sequence of the power train system which delivering the power to the rear wheels (PT Toyota Astra Motor, 2003). The rear axle unit has its mechanism which consists of axle shafts (inside) with other component and bear the rear weight of the car (Figure 2.1).
Figure 2. 1 Rear Axle Assembly (Illustration)
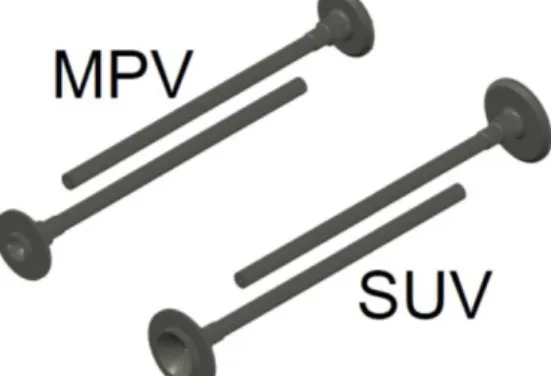
The axle shaft (circled in Figure 2.1) has many types and adjustment depend on car models. In this case, there are two models which are MPV and SUV. Those models are illustrated in Figure 2.2 below. These shafts have approximately 75 cm long each with 3.5 cm in shaft diameter; it weighted about eight kilograms each, and made from steel alloy, thus considered as heavy to be manually handled.
Figure 2. 2 Axle Shaft for MPV Car and SUV Car (Illustration)
6 2.2.Productivity
Productivity is the measure of a work performance. In manufacturing field, it is the measure of a work in producing a certain amount of product. It is used by the company to review and measure its shop floor performance. The measure of productivity is calculated from the throughput rate divided by the customer de- mand (Formula 2 – 1).
𝑃𝑟𝑜𝑑𝑢𝑐𝑡𝑖𝑣𝑖𝑡𝑦 = 𝑇ℎ𝑟𝑜𝑢𝑔ℎ𝑝𝑢𝑡 𝑟𝑎𝑡𝑒
𝐷𝑒𝑚𝑎𝑛𝑑 × 100% (2 – 1)
In assessing the performance, the company sets the desired rate; which is the min- imum requirement of the productivity. By using this rate, the company will be able to decide whether the workstation is performing well or not. In calculating the throughput rate (unit/hour), it is need to know the workstation processing time (T). The processing time is the aggregate of the completion time of each job (Tej) (Formula 2 – 2).
𝑇 = ∑
𝑛𝑗=1𝑒𝑇
𝑒𝑗 (2 – 2) A low processing time, indicates higher productivity rate of the line and vice ver- sa. The parameter to indicate whether there is a problem or not in the line is by comparing processing time with takt time as the parameter. Takt time can be cal- culated by the total production time available over total customer demand (For- mula 2 – 3). The minimum possible value is the highest processing time between the stations (bottleneck station). Therefore, if the value exceeds the takt time, this condition might become a problem and should be solved immediately.𝐶 = 𝑃𝑟𝑜𝑑𝑢𝑐𝑡𝑖𝑜𝑛 𝑡𝑖𝑚𝑒 𝑝𝑒𝑟 𝑑𝑎𝑦
𝑇𝑎𝑟𝑔𝑒𝑡 𝑜𝑢𝑡𝑝𝑢𝑡 𝑝𝑒𝑟 𝑑𝑎𝑦 = (𝑇𝑜𝑡𝑎𝑙 𝑝𝑟𝑜𝑑𝑢𝑐𝑡𝑖𝑜𝑛 𝑡𝑖𝑚𝑒−𝐴𝑙𝑙𝑜𝑤𝑎𝑛𝑐𝑒)
𝑅𝑒𝑞𝑢𝑖𝑟𝑒𝑑 𝑜𝑢𝑡𝑝𝑢𝑡 (2 – 3)
2.2.1. Tools
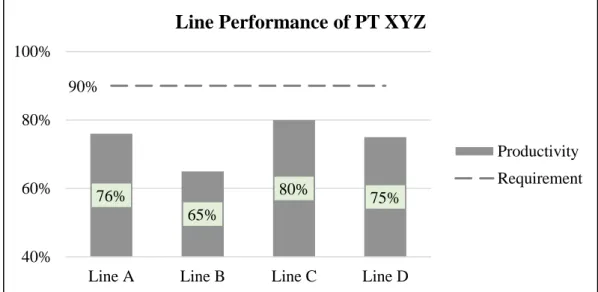
Productivity is usually presented in a bar chart. The productivity rate of each pro- duction floor is shown in percentage. On top of the bars, there is company’s productivity rate requirements line which varies from each companies. The exam- ple of this chart is given in Figure 2.3. In the presentation, it shows that all of the production lines have low productivity; hence, the company assesses the factors that might responsible for the productivity.
7 Figure 2. 3 Line Performance of PT XYZ (Example)
Yamazumi chart is a stacked bar chart that shows processing time of each work element which grouped into “added-value”, non-added value, and auto/machine.
The dash line above the bars is the takt time (countermeasure) that required by the company (maximum processing time). Figure 2.4 is a Yamazumi chart example.
This chart shows six task categories in the work station. The chart indicates that the second station has a bit exceed the limit, so it needs to be investigate further.
Figure 2. 4 Workstation Processing Time in Line A of PT XYZ (Example) 76%
65%
80% 75%
90%
40%
60%
80%
100%
Line A Line B Line C Line D
Line Performance of PT XYZ
Productivity Requirement
0 40 80 120 160
Station 1 Station 2 Station 3 Station 4
Yamazumi Chart of Line A
Machine Automation Walk Irregular Handling Manual Takt Time
8 2.2.2. Waste
Waste is the non-value-added task/activity that must be eliminated in the process of manufacturing. There are seven types of waste that affecting the performance of the production line. Those wastes are:
1. Transport. This type of waste is the materials movement from one station to another. The transportation-waste may cause by lack of capacity in handling, not adequate equipment, or other factors.
2. Inventory. Inventory can be a waste because it has too much and not circulated well to another department. The inventory is consuming more space to store, more time to handle, and consume more energy in maintaining the product.
3. Motion. This waste is the unnecessary movement by the operator or machine. It may cause by the lack of equipment design or the materials that are not handy.
4. Idle. Delay or waiting time is waste that are surely must vanish from the pro- cess. This waste is caused by the unbalance workload among the station, starv- ing process that waits materials from the preceding post, or machine error.
5. Over-Processing. In example at the painting process, the actual area that needs to be paint is only on the side, but the operator paints the entire surface, so it wastes time, materials, and movement.
6. Overproduction. This waste is because the company use its ma- chines/equipment 100% which require more materials and workforce and pro- ducing unnecessary amount of product.
7. Defects. Defective products require to be repaired to reduce the product waste.
2.3.Work Analysis
2.3.1. Work Standard Table & Combined Work Standard Table
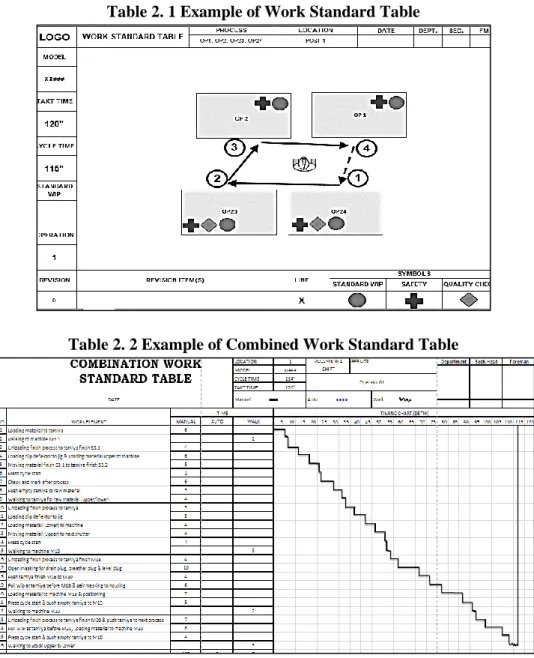
A work standard table is the visualisation of the standardised operator movement in the work station. The example of this table is shown in Table 2.1. A combined work standard table presents the detailed work element in the sequence based on its category. There are including the time and work span of the task. This table is presented in the Table 2.2.
9 Table 2. 1 Example of Work Standard Table
Table 2. 2 Example of Combined Work Standard Table
2.3.2. Material Handling
Material handling is an activity in transferring the parts/materials from one station to the other station/department. This activity can be done manually or automated using robots, automated guided vehicle, or other method. A manual handling is considered as non-value-added activity and considered as waste (Heragu, 2008).
To determine the handling of materials, there are several aspects that need to be considered; especially for manual handling method. A manual handling not only concern about the product, but the worker safety, such as (ergonomic, worker’s capacity, etc.) and worker’s movement. In the handling for manuals, the product itself may hazardous to the workers because of its temperature, chemical composi- tion, or other factors.
10 2.3.3. Anthropometry
Anthropometry is the human body measurement study of its bones, muscles, and tissue dimension (weight, height, and size). The measure is used as one of the fac- tors in determining the product dimension. There is certain standard of parameter that are used to define the safest/best position of the human body in order to make a product or other equipment that use human interface.
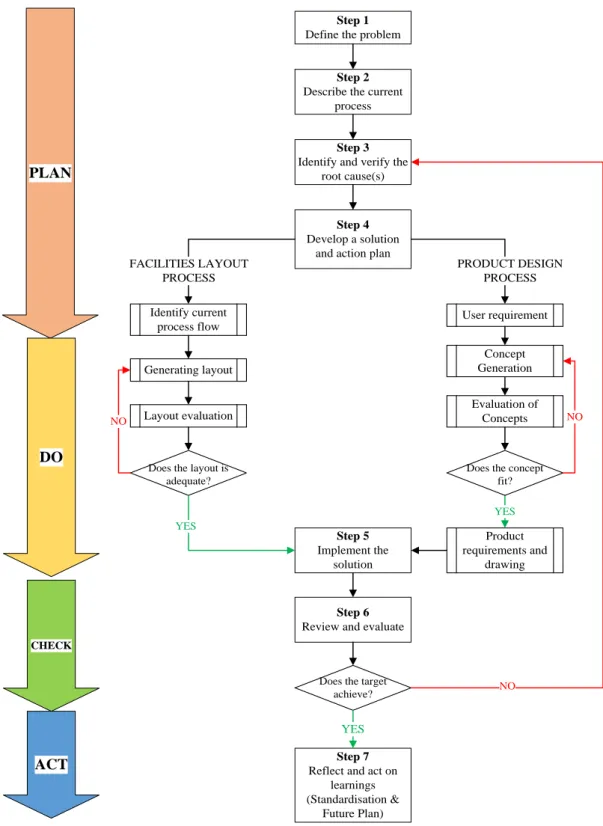
2.4. Plan, Do, Check, and Act (PDCA) Cycle
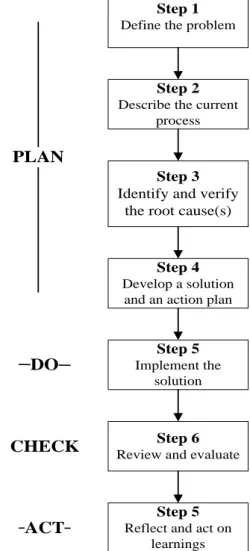
Plan, Do, Check, and Act (PDCA) cycle is part of the continuous improvement cycle that widely used. This method was elaborate and modified to fit the needs by breaking it down to several steps, or combining with other method. This cycle can be breakdown in more detail. One of them is to define to seven steps (Vetter, et al., 2012). Those steps are shown in the Figure 2.5.
Step 1 Define the problem
Step 2 Describe the current
process
Step 3 Identify and verify
the root cause(s)
Step 4 Develop a solution
and an action plan
Step 5 Implement the
solution
Step 6 Review and evaluate
Step 5 Reflect and act on
learnings
PLAN
DO
CHECK
ACT
Figure 2. 5 PDCA Cycle Breakdown to Seven-Steps
11 2.5. Engineering Design
In the work of engineers, engineering design is an important and on-going activi- ty. In an improvement process, engineering design is used to determine the im- provement that can be applied. This process is the building of a system, compo- nents, or other process to meet the requirements. In which combining basic sci- ence, math and engineering to be applied in converting resources optimally in ful- filling the objective. The aspects of the design such as setting goals and criteria, synthesis, analysis, construction, and simulation and evaluation. Along with the process of design, the factors are considered such as economy, safety, aesthetics, etiquette, and its impact in society (Oakes & Leone, 2015).
2.5.1. Design Process
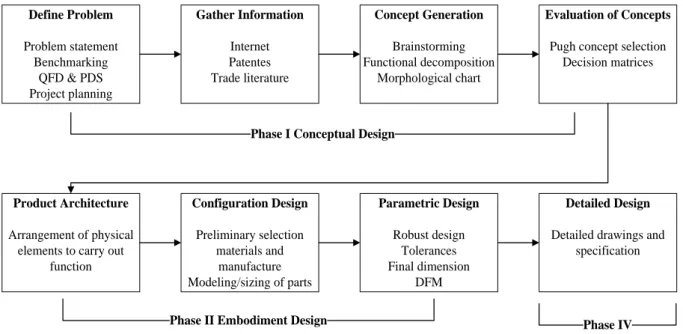
Dieter (2000) presents a complete design process into seven phases. Those are:
1. Phase I Conceptual Design – In this phase, the design is initiated to the point of creating solutions and define the best concept. In this phase the activities are:
Identification of user needs—to understand the requirement of the user.
Problem definition—to create a statement that describes what has to be ac- complished to satisfy the customer.
Gather Information—to specify the standard requirement of the product.
Conceptualisation—to broadly set potential improvement.
Concept selection—to find the most valuable concept. In the selection, there are some factors that must be considered, such as, the urgency of the im- provement, the cost of making the equipment, etc.
Refinement of the Product Design Specification—to give certain design pa- rameters in which the product will be made.
Design review—to assure that the proposed design is achievable and eco- nomically reasonable.
2. Phase II Embodiment Design – This phase is to define a structured develop- ment in the design concept such as strength, material, dimension, appearance, and compatibility of the product.
12
Product Architecture—dividing the overall system into modules. It is decid- ed on how the component to be assembled to carry out the product function.
Configuration Design of parts and components—to determine the configura- tions, such as holes, ribs, splines, or curves. It is to more specify the materi- als that used and the making of the component.
Parametric Design of parts & components—to establish the right dimension and tolerances. This is to examine the part, assembly, and system for ro- bustness (consistency of a component performance in various conditions).
3. Phase III Detail Design – In this phase, the complete engineering description of the improvement is presented. The arrangement form, detailed dimensions, tol- erances, properties, materials, final drawing, and the making process are pre- sented. This is considered as the end of the basic design process, thus still con- tinue until seventh step. This primary process (first step – eight steps) is pre- sented in the Figure 2.6.
Product Architecture
Arrangement of physical elements to carry out
function Define Problem
Problem statement Benchmarking
QFD & PDS Project planning
Gather Information
Internet Patentes Trade literature
Concept Generation
Brainstorming Functional decomposition
Morphological chart
Evaluation of Concepts
Pugh concept selection Decision matrices
Configuration Design
Preliminary selection materials and
manufacture Modeling/sizing of parts
Parametric Design
Robust design Tolerances Final dimension
DFM
Detailed Design
Detailed drawings and specification Phase I Conceptual Design
Phase II Embodiment Design Phase IV
Figure 2. 6 Primary Design Process of Engineering Design
4. Phase IV Planning for Manufacture 5. Phase V Planning for Distribution 6. Phase VI Planning to Use
7. Phase VII Planning for Retirement of the Product
13 2.5.2. Product Design Specification
Product design specification is the controlling documentation of the finished de- sign. It is set in certain parameters of the deigned product above the detailed engi- neering specification. There are lots of parameters that can be set, such as materi- als, ergonomics, product cost, customer preferences, size, weight, maintenance, safety, etc., (Matthews, 2012).
2.6.Facilities Design
Facility design is used to make new layout or revise the existing layout to make improvement/optimisation (Heragu, 2008). In this case, the facilities design pro- cess is to improve the current condition of a production line to be more efficient.
2.6.1. Systematic Layout Planning (SLP)
There are four main phases in planning the industrial facilities (Muther & Hales, 1999). Those phases are:
1. Phase I Orientation – Scoping the project and schedule setting. Then interpret the requirements into more tangible; continue, with defining the location of the facility. Afterwards, identify the external physical influences to establish non- physical influence.
2. Phase II Overall planning – Convert the tangible requirements, external consid- erations, and internal influences into an overall plan for the facility. This activi- ty includes determining material flow, adjacency requirements & station space.
3. Phase III Detail planning – Provide details about the layout and location of each specific part that divine in Phase II. The similar technique is used as in the previous phase, but in this step it is more to detail on each department.
4. Phase IV Implementation – The employees that are affected, supervisors, and managers have to be approve the proposed layout in order to prepare the draw- ing. The drawings show much detail because it is used to plan the movement of each department; thus economic and time factors are considered.
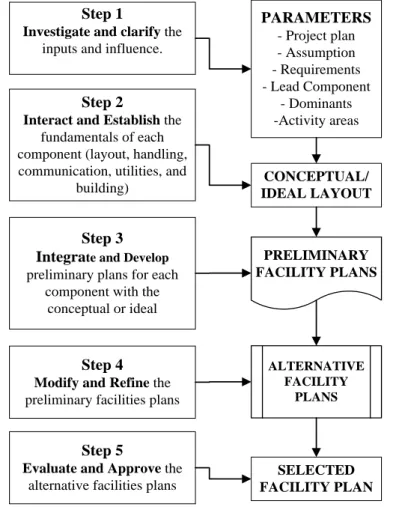
14 From those phase, the facility layout is breaks into five steps. The steps might slightly similar to any design step; yet those steps are following the needs in the facilities design process. This process is shown in Figure 2.7.
Step 1
Investigate and clarify the inputs and influence.
PARAMETERS - Project plan - Assumption - Requirements - Lead Component
- Dominants -Activity areas
CONCEPTUAL/
IDEAL LAYOUT
PRELIMINARY FACILITY PLANS
ALTERNATIVE FACILITY
PLANS
SELECTED FACILITY PLAN Step 2
Interact and Establish the fundamentals of each component (layout, handling, communication, utilities, and
building)
Step 3 Integrate and Develop preliminary plans for each
component with the conceptual or ideal
Step 4
Modify and Refine the preliminary facilities plans
Step 5
Evaluate and Approve the alternative facilities plans
Figure 2. 7 Pattern of Facilities Design Process
2.6.2. Flow Process Pattern
The flow pattern is defining the path of the materials that processed in the work- station. This pattern is used as an initial overview of the production line. Figure 2.8 shows the example of flow pattern in a company.
STATION 1 STATION 2 STATION 3
FINISHING
Figure 2. 8 Example of a Flow Pattern
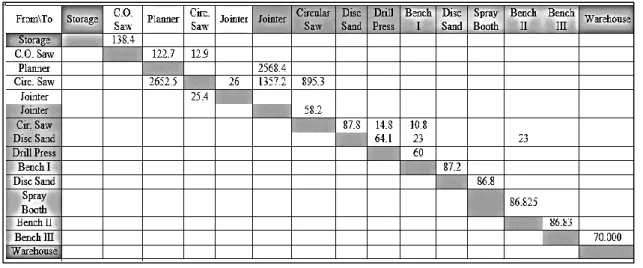
2.6.3. From-To Chart
From-To chart is a matrix which the value is defined from the product routing.
The chart shows the total weight, or the movement frequency of each depart-
15 ment/station. The Table 2.3 below, shows the example of “From-To” chart of a cross departmental relation.
Table 2. 3 Example of From-To Chart
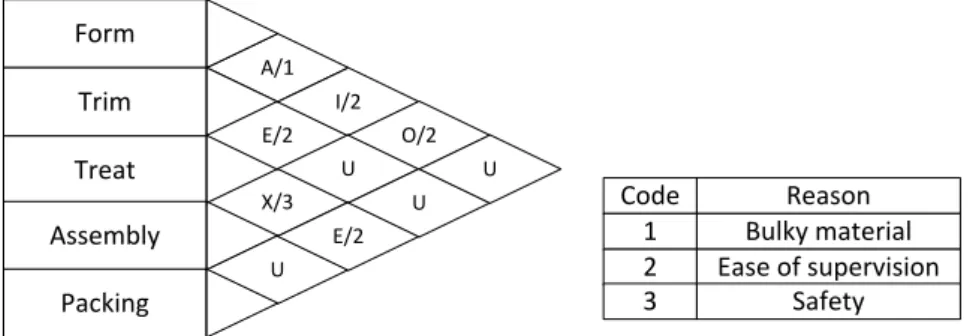
2.6.4. Relationship Chart
A relationship chart shows the relationship adjacency among the station in the process. It has six classes to specify the importance of each relation. Those classes are alphabetically symbolised (A, E, I, O, U, and X). A to X is defining the most necessary to least-necessary relationship respectively; in which X is the undesira- ble relationship which the assigned post/station is not desired to be placed close to the related post. The example is shown in Figure 2.9 below includes the reason in determining the value.
A/1
X/3 E/2
I/2 U
O/2
Form Trim Treat Assembly
Packing
U E/2
U U
Code 1 2 3
Reason Bulky material Ease of supervision
Safety
Figure 2. 9 Example of Relationship Chart
2.6.5. Relationship Diagram
Relationship diagram (string diagram) is being arranged based on the relationship chart value. There are four strings for A, three for E, and so on, except “U”
(blank) and X (dash/zigzag). Figure 2.10 illustrates the string diagram.
16 Figure 2. 10 Example of Relationship Diagram
2.6.6. Computerised Relative Allocation of Facilities Technique (CRAFT) This software is to examine the facility layout problem using algorithm. It begins with initial layout arrangement and continues to arrange the station by exchanging the posts’ pair insightful to reduce the material transportation cost. It does not give the optimal layout (relative); however, the outcome is close to the ideal arrange- ment, which can be later redressed to suit the need of the format organiser. In overall features, this software requires assumptions that move cost is independent of the equipment utilized & are linearly related to the distance of the move; also the distance matrix used is the Euclidean between the centroids; and the software is being a path-oriented method, which allows the use of dummy departments to represent fixed areas.
There are six input requirements for CRAFT:
1. Initial layout 2. Flow data
3. Cost per unit distance
4. Total number of departments
5. Fixed departments and their location 6. Area of department
There are some procedures for using CRAFT:
1. Determine the department centroids and calculate the distance.
2. Calculate transportation cost for the layout.
3. Consider department exchanges.
4. Determine transportation cost of each department interchange.
5. Select & implement the interchange that offers the greatest reduction.
6. Repeat the procedure for the new layout until no interchange is able to reduce the transportation costs.
17
CHAPTER III
RESEARCH METHODOLOGY
3.1. Research Methodology
This research employed PDCA cycle which consists of four phases (plan, do, check, and act). The method is being elaborated into seven steps of problem solv- ing process. These steps are initiated from the problem identification, understand- ing the condition, root cause analysis, solution findings, until evaluation and rec- ommendation (Vetter, et al., 2012). These seven steps are the general frameworks of the research. In this study, these works use quantitative approach which uses empirical data as the support.
3.2.Data Collection
The data are mined through primary observation and secondary data from compa- ny and other resource. Company data mining is including the previous study, de- mand, process analysis and the system in the production line. Then, the direct ob- servation is to get the time and motion study, also analyse the working area. Those data are quantitative because mostly are need to be calculated to find the exact analysis and planning.
3.3.Research Setting
The research was done on the axle shaft machining line. The focus is to increase the productivity by designing new equipment and optimising the layout arrange- ment. The process that being observed is manual tasks for two types of shaft—
SUV and MPV—which has the same method in handling. The observation in ob- taining the detail of works is done during first shift from Monday to Friday. In this study the factor that being observed is work method, whilst ignoring the materials, machine, and man/worker’s condition because these factors are already affixed by the company. The machine assumed to be working normally, which the material is not being the concern due to customer requirement; thus, the workforce assumed to have the same standard skill as required by the company.
18 3.4.Analysis
3.4.1. Productivity
The productivity is the main focus of this research. The company data were used to define the problematic production line. It is used as the parameter of success in this research. In observing the productivity, the station processing time is ob- served as the initial data for the manual jobs. From the result, the root causes of the productivity problem are defined and being analyse. Those findings are used as the base data to suggest further improvement.
3.4.2. Product Design
The process of product design follows the primary design process which adequate to fulfil the needs in this study. The process is substituted into the fourth step of the cycle. Designing process is covering the proposal of new equipment alterna- tives for improvement. There are some aspects that being considered in the pro- cess of design regarding product safety, handling method, ergonomic, and product endurance.
3.4.3. Facilities Design
In general, the improvement process of facility layout design is following the four phases of systematic layout planning. The steps are adapted into the “fourth-steps”
of the cycle. In doing the design, the considerations are in the process flow, han- dling method, and the area of the station. Those considerations are used to present the alternative in relationship chart, and arrange the position of the post.
3.5.Findings
The indicators that define whether this study is success or not is specified by the achievement to increase the productivity up to at least 78%. It is indicated by the reduction of overtime requirement to be zero or at most two-hour overtime per shift; in the other word, the maximum cycle time is 90”.
19 3.6.Research Framework
The framework is a combination of seven steps process, engineering design, and facility design. Those are with several adaptations to the needs of this study. The framework is presented in the Figure 3.1 below.
Product requirements and
drawing User requirement
Concept Generation
Evaluation of Concepts Identify current
process flow
Generating layout
Layout evaluation
Step 1 Define the problem
Step 2 Describe the current
process
Step 3 Identify and verify the
root cause(s)
Step 4 Develop a solution
and action plan
Step 5 Implement the
solution
Step 6 Review and evaluate
Step 7 Reflect and act on
learnings (Standardisation &
Future Plan)
PRODUCT DESIGN PROCESS FACILITIES LAYOUT
PROCESS
YES Does the concept
fit?
NO
Does the layout is adequate?
YES NO
Does the target achieve?
YES
NO
PLAN
DO
CHECK
ACT
Figure 3. 1 Research Framework
20
CHAPTER IV
DATA COLLECTION AND ANALYSIS
4.1. Initial Observation
The increasing capacity of car manufacturer affects the demand for raw material.
PT BSC as a car component (axle shaft) supplier, required to fulfil its customer demand, whilst the management has a plan to reduce its labour cost. These new policies affecting the productivity of its production floor. The result of company review indicates that all of the production line has low performance. Among the line, axle shaft (A/S) machining line has the lowest performance at only 68%
(Figure 4.1). Therefore, the problem identification is needed for A/S line to im- prove its productivity.
Figure 4. 1 Line Productivity of Mid-April 2016
4.2. Defining the Problem
Figure 4.1 shows that the productivity target of axle shaft is 90%. It means that there is a gap between the target and actual performance. The production target for this line is 46 pairs in an hour; thus, 322 pairs in a shift with estimation of sev- en working hours per day is the minimum requirement to perform without over- time work. Currently, the actual line performance is only 68%, which means that the throughput rate is 34 pairs/hour. This condition requires overtime work for about 3.4 hours/shift as shown in the Table 4.1.
70% 76% 73% 68% 77%
93% 93% 93%
90% 90%
40%
60%
80%
100%
R/A P/B H/A A/S H/END
Line Productivity April 20, 2016
TARGET
21 Table 4. 1 Overtime Requirement A/S Machining Line
Delay rate Pairs
Capacity/hour 34
Demand/hour 51
Gap Hourly 17
Per shift 119 Req. O/T (hour) 3,4
The overtime work is performed by all of the workers (five man powers) in one shift or 10 workers a day; by estimating the labour cost as IDR 76,000 per hour/worker, it will cost about IDR 2,584,000 /day. Further calculation, the one- year projection of this cost (assume: 22 working days/month, 12 months/year) will be about IDR 682 million/year. If it is compared to the benefit of labour cost re- duction of IDR 200 million/year, the company still loses about IDR 482 mil- lion/year. This projection of 241% deficit puts the urgency to overcome the prob- lem immediately. The company asked for overcoming this condition by no longer than seven weeks; thus, the plan for the project is shown in the Table 4.2 below.
Table 4. 2 Plan of Project Timeline April – May 2016
ACTIVITY PLAN April May
III IV I II III IV
PLAN
1 Problem finding
2 Current observation 3 Root cause identification 4 Solution development
DO 5 Implementation
CHECK 6 Review and evaluation
ACT 7 Standardisation
The second investigation is to find detailed problems that are needed to be solved in the axle shaft production line. The assessment was done for its workstation pro- cessing time (workstation cycle time; C/T) as the performance indicator of the production line. The production flow in this line was reviewed to understand the process. This production flow is shown in Figure 4.2.
22 Figure 4. 2 Process Flow in Axle Shaft Line
From the Figure 4.2 above, Station 2 and 5 have more tasks than the other lines. It is indicated that those stations might have “low-productivity”. It is because the more tasks mean the more time to complete the job. In order to assure the state- ment, an observation for the workstation cycle time was conducted. The result of this assessment is shown in Figure 4.3 below.
Figure 4. 3 Work Station Cycle Time of A/S Machining Line
The result in Figure 4.3 shows that Station 2 and 5 are the post that the processing time are high; thus, the fifth station being considered as the problematic-station because the cycle time has exceeded the takt time. Therefore, this station is sus- pected to be the main problem; thus, this station is the interest in this study that needs to be solved.
4.3. Current Condition
From the previous finding, the investigation in this study directed to understand the current process of WS 5. In this post, there are three aspects that being ob- served. Those aspects are production flow, operator movement, and work ele- ments of the workers. The observation is done for manual task as the company’s consideration that manual job to be improved.
60,7 65,6
48,0 52,0
101,5 71
25,0 45,0 65,0 85,0 105,0
WS1 WS2 WS3 WS4 WS5
WS C/T (second)
Work Station Cycle Time v.s Takt Time (T/T)
T/T
23 4.3.1. Production Process
The first observation is the production flow in Station 5. The station consists of two machines (Inspection - OP15 & Washing – OP16), a WIP pallet, one not- good (N/G) product pallet, a painting booth, and delivery trolley (F/G pallet). The flow of material in this workstation can be seen in the Figure 4.4 below.
WIPWIP
INSPECTION INSPECTION INPUT
INPUT OUTPUTOUTPUT
INPUT INPUT OUTPUT
OUTPUT PAINT
-ING PAINT
-ING F/G
PALLET F/G PALLET
SUB ASSY SUB ASSY
WASHING WASHING
Figure 4. 4 Production Process Flow
The process in Figure 4.4, shows that the task is begin by taking the blank part at WIP to be inputted in OP15, then being check in the inspection chamber. After- wards the shaft proceeds to the output, then being transferred to OP16. Then next process, is being painted and put to transfer trolley and delivered to the sub as- sembly line. Due to the company plan for future expansion, each of those posts has different capacity. The inspection has capacity of one shaft and two work-in- process inside the machine; whilst washing has capacity of four shafts and twelve WIP in the machine. The painting booth has four shafts capacity without any WIP; and the transfer trolley has capacity of 24 units (12 pairs) only.
4.3.2. Operator Movement
After the process flow being observed, the investigation goes to the workers’
movement. Due to the different capacity among the post, the movement of work- ers is increasing to fulfil the required capacity. The workers’ movement is shown in the work standard table in Table 4.3 (not to scale).
24 Table 4. 3 Work Standard Table
Model
WORK STANDARD TABLE
Process Location
All Models
WIP, Inspection, Washing,
Painting, Delivery Workstation 5 T/T
Washing WIP
Input Inspection Output
Input Output
Painting
Delivery Pallet Defect
Pallet
Sub Assy
1, 8, 15, 20
2, 9, 16, 21 3, 10, 17, 22 4, 11, 18, 23
5, 12 6, 13
25, 27 28
7, 14
19
24 26
71”
C/T 101.5”
Prod.
Line Axle Shaft
From the work standard table above, the total movement of the operator is 28 with some relation has higher frequency then the others. This number consists of walk- ing and material handling tasks, but not including the irregular task. There are two irregular tasks at this station; those are delivery to sub assembly and product de- fect handling. The delivery is done if the trolley is fulfilled of 12 pairs; whilst the defect product is if the shaft does not pass the inspection (dashed line).
4.3.3. Work Elements
The observation is focused on presenting the detailed work element of the man- power. The elements are divided into several groups of task, such as manual task, manual handling, irregular task, and walking. Those activities are considered as
“value added” and “non-value added”. The non-value added tasks such as walk- ing, manual handling and irregular task (considered as waste). Those wastes are the activities that being fixed in this study to improve the productivity. The work element table is shown in Appendix 1.
25 4.4. Root Cause Identification and Verification
The searching for the root cause of the waste is conducted in this step. The aim is to find as much as possible cause from the aspects of work method (the other as- pects are assumed not affecting the waste). The first will be visualising the waste, then analyse those causes using a Fishbone diagram, and finally, verifying those causes to assure it is the real cause and feasible to be solved in this study.
4.4.1. Yamazumi Chart
The workstation processing time is grouped for each of the activity. Those groups are then stacked into a Yamazumi chart of Workstation (WS) 5 (Figure 4.5). As the result of the previous observation, this chart shows the types of activities.
These activities are Manual task (Man), Material Handling (MH), Walking (Walk), and Irregular Job (IJ); in which excludes machining and automated task (the study is focused on the manual job).
Figure 4. 5 Yamazumi Chart of WS 5
From the Figure 4.5, the highest waste proportion of the processing time is walk- ing (36.6%), followed by handling (34.1%), and manual takes (29.3%). This con- dition can be associated with the fact that there is a high frequency of movement (28 times), high frequency tasks (repeated tasks), and walking distance. Therefore, the next analysis will be finding the root causes based on those factors.
25,0 26,1 28,0 22,4
0,0 71,0
Yamazumi Chart WS 5 April 20, 2016
IJ Walk MH Man
26 4.4.2. Fishbone Analysis
The Fishbone analysis is the root cause visualisation of the problem that being faced. In examining the investigation, this study uses a “5-why” analysis. This method is to question any possible causes of the problem until five times; or if it is final and cannot be answered, this final answer is suspected to be the root cause.
In doing so, there are other opinion in determining the root cause from the produc- tion supervisor and leader. Table 4.4 shows the result of “5-why” analysis.
Table 4. 4 “5-Why” Analysis for Finding Root Cause
From the table above, it can be seen that some of the problem has final answer after five times, but some others only half. It is because indeed the company al- ready set some of future plan in the current line, so it just needs to wait for the ex- ecution by the company. Further, the result of this table is plotted in the fish bone
27 analysis diagram to see the path of the problem. The root is focused on the work method factor based on the finding of the previous observation. The Fishbone di- agram is presented in Figure 4.6 with the main problem is “the cycle time of work station five is higher than the takt time (C/T WS 5 101.5”)”.
Figure 4. 6 Fishbone Diagram in Finding Root Cause of Problem in WS 5
There are five root causes as the result of the fish-bone analysis in Figure 4.6.
Those causes are derived from work method into three categories of walking, handling, and high frequency in painting. The first is that there is no supporting equipment, followed by limited painting cover, machine arrangement, different machine capacity, and the fifth is about weight of the shaft.
4.4.3. Root Causes Verification
The next step in this identification is the verification of the five root causes from the fish-bone diagram. These root causes need to be verified to assure that those causes are feasible to be solved in time with the cost as low as possible.
28 1. The first cause is the out-of-date handling method. This condition leads to lack of handling equipment when transferring the material from output washing to painting. During the observation, the handling from output washing to painting is only done by hand. It is can be seen in Appendix 1, in which the handling session for painting, the operator repeats the task twice due to the limited ca- pacity. This condition was applied because there were two workers, but now it is only one workforce, so it needs to be updated. This problem might be tackled by providing equipment to help the operator.
2. The second cause is limited painting cover which caused by un-updated meth- od. This condition reduces the painting capacity for one work force. As it stat- ed, there is only one cover for each model. It makes the operator must pick- and-place the cover several times during the process (hand movement waste). It is might necessary to overcome by suggesting improvement for painting cover.
The illustration of current cover can be seen in Figure 4.7 below.
Figure 4. 7 Painting Cover (Left: SUV; Right: MPV)
3. The third problem is because the placement of the machine/posts is not yet up- dated (too far for one worker). This condition pushes the worker to walk more when handling the materials or reaching the next sequence. The measure of this distance is based on any possible walking path between the machine/post.
This distance can be seen in the Figure 4.8 (general arrangement only due to confidential data).
29 Figure 4. 8 Work Station 5 Layout
4. The fourth problem is high frequency tasks in the beginning of the cycle due to un-balance capacity among the machines. This problem is occurring the most between inspection and washing. The company has a plan to install an addi- tional production line, so the capacity for washing can be increased. Therefore, this cause is not being the interest of the research due to the company’s plan.
5. The fifth cause is the material weight (8kg/shaft) assumed to be heavy due to customer’s material requirement. This is impossible to be solved from the per- spective of material factor because it is a requirement from the customer; hence its solution is to modify the handling method which associated with the first problem.
The verification finds that there are only three main causes which almost all of the root causes are due to an obsolete working method. These old methods are di- rected for two workers, but after man power reduction, there is only one person.
Therefore, the update for one man-power is needed to increase the productivity.
30 4.5. Developing Alternatives
There are three main causes that derived from the verification. The first is an equipment problem to help the process of handling (cause 1 and 5), the second is an equipment problem in painting (cause 2), and the last is the facilities problem for machine positioning (cause 3).
4.5.1. Problem 1 Handling Equipment
The first problem (handling) is because the lack of equipment. The alternatives to this problem must be able to accommodate the handling capacity (four units) from washing to painting and the weight of the shaft (~32 kg/transfer).
1. Alternative 1 – Trolley. The concept is to provide a trolley with adequate ca- pacity of four shafts. This trolley can reduce the walking frequency from wash- ing to painting. Besides that, by using a trolley, the operator does not need to carry a 16-kilogram shaft to painting (two shaft/handling). For the sake of de- velopment, there are two kinds of trolley that are possibly to be installed. These two trolleys are varied on its shaft arrangement.
a. In-line trolley. As it named, this arrangement of the trolley is in-line. This trolley concept is shown in Figure 4.9 (left).
b. Square trolley. The square trolley has a square-like arrangement shape (two rows; two column). The conceptual method of this alternative is shown in Figure 4.9 (right).
Figure 4. 9 Handling Trolley Conceptual (Left: In-Line; Right: Square)
31 2. Alternative 2 – Automated handling. The second alternative is to use an auto-
mated system to handle the shaft. This method seems to give significant impact to the overall process, because the manual job is replaced by a robot.
4.5.2. Problem 2 Painting Cover
In the painting post, there are four pads at the booth arranged in-line (capacity of four shafts/batch). The cover must be able to cover all four shafts. The alternative to this problem is presented below.
1. Alternative 1 – In-line painting cover
This cover accommodates four shafts that placed in a row. The position is fol- lowing the current condition of painting booth with four capacities. The con- cept is presented in the Figure 4.10 below.
Figure 4. 10 Painting Cover (Illustration) 2. Alternative 2 – Square painting cover.
The square cover is accommodating four shafts that placed on the trolley (if Problem 1 use trolley as its solution). In this concept, the operator does not need to load the shaft to the booth; instead, it just needs to push the trolley into the booth and start to paint. This concept is presented in Figure 4.11.
Figure 4. 11 Brushing Area (Painted Area)