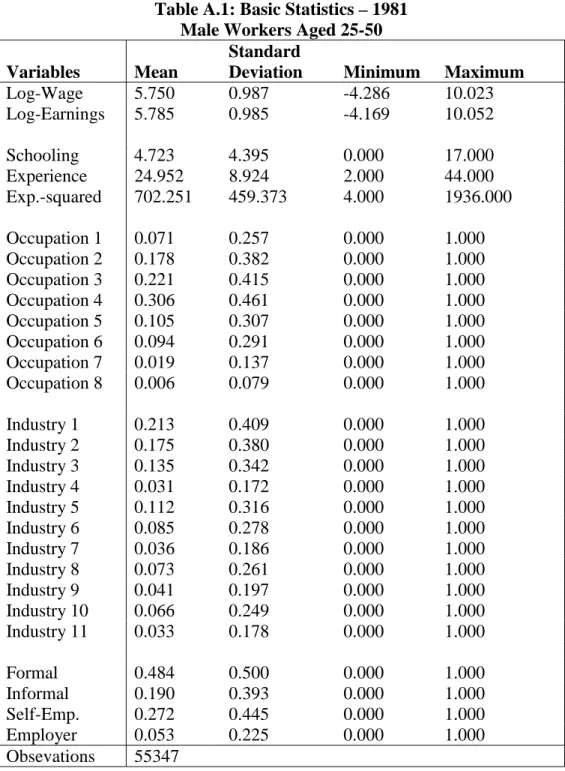
I find that most of the sources of these changes are due to changes in (i) unobserved skill prices and (ii) observed skill prices related to industry, occupation, and occupational status. In general, most of these studies find that the change in the distribution of workers. The number of Brazilian prime-age workers increased between 1977 and 1989, but this dispersion is not strongly related to the changes in wage inequality observed during this period.
In this paper I analyze the determinants of the changes in the wage inequalities among the Brazilian first-year labor force between 1981 and 1997. This methodology allows me to distinguish the change of the joint distribution of the workers' characteristics from the changes in the prices which is associated. with them. Similar to previous studies, I find that changes in the distribution of schooling and potential experience and the returns associated with them do not explain the inequality changes.
The rising wage inequality between 1981 and 1989 was due to increases in the observable skill prices, increase in the distributions of observable skill and of the joint distribution of. In part three, basic facts about changes in the wage structure among male workers at first year are presented.
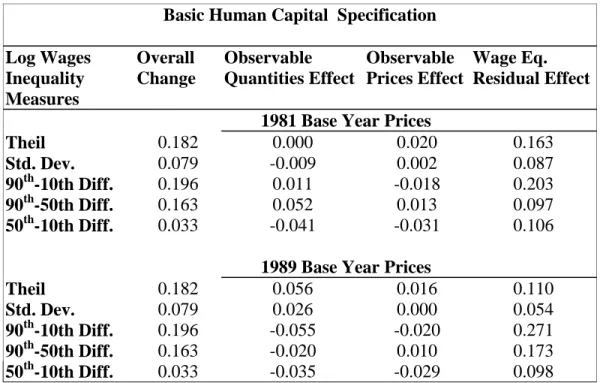
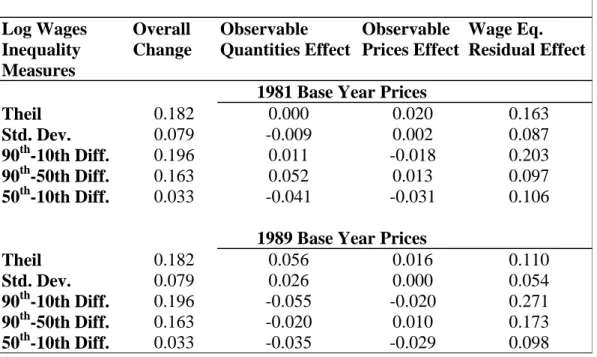
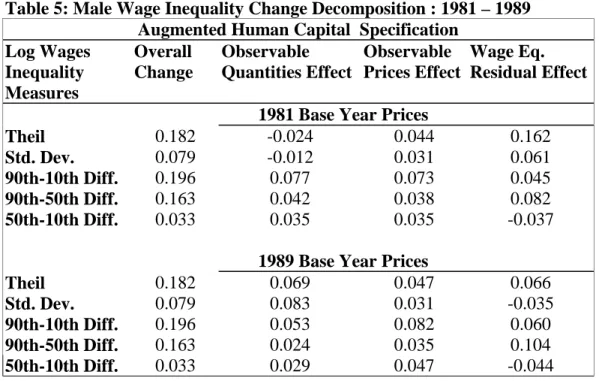
The Joint Impact of Schooling and Potential Experience on Wage Inequality Changes In order to evaluate the role of schooling and potential experience in explaining the inequality
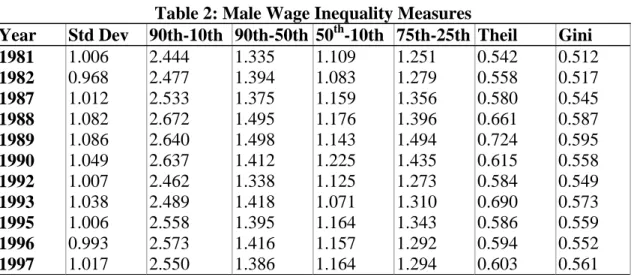
Finally, the effect of the changes in the wage residuals on the change in inequality is captured by the difference between Yit, the actual distribution in year t, and Y(2)it, the other hypothetical distribution. The specifications of the wage equation use the human capital variables - years of schooling, years of potential experience and its square - and also add indicator variables for industry, occupation and occupational status.8 Previous studies have emphasized the explanatory role of occupational status. the changes in inequality in the 1980s. These results clearly show that overall wage inequality increased during this period, and that this increase was greater at the top of the wage distribution.
Third, the observable price effect is negative at the bottom of the wage distribution and positive at the top. Thus, most of the change in wage inequality between 1981 and 1989 cannot be explained by changes in the joint distribution of education and potential experience, nor by changes in the observable prices of these skills. In contrast, overall wage inequality among young male workers decreased steadily between 1989 and 1997, largely due to a decline in the distribution of wages at the top of these distributions.
The observable price effect is also positive and contributes somewhat to widening the wage gap. In other words, the changes in the joint distribution of education and potential experience and their returns are not related to the changes in inequality of the 1980s and 1990s.
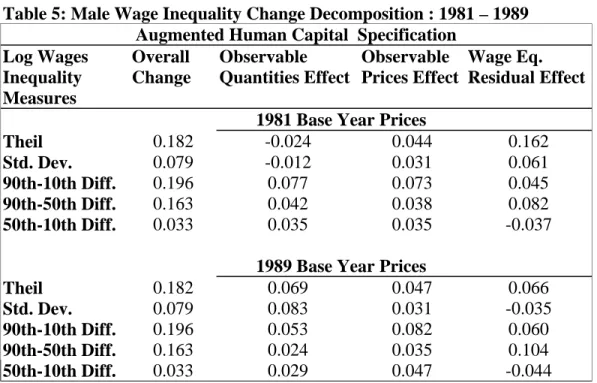
The Joint Impact of Industry, Occupation and Occupation Status on Wage Inequality Changes
That is, the joint changes in the unobservable skill prices and unobservable skill distribution are the main drivers behind both the increase in inequality between 1981 and 1989 and the decrease in inequality between 1989 and 1997. This suggests that the changes in the returns associated with industry, occupation and occupational status adversely affecting those workers at the lower end of the wage distribution. The wage inequality changes are mainly a result of changes in the unobservable skills' prices and.
The key elements in explaining the increase in inequality in the 1980s and the decrease in inequality in the 1990s appear to be price changes in the observed and. Also, a change in the distribution of unobservable skills cannot be ruled out. However, unobservable price changes are more likely to play a more important role than unobservable characteristics for two reasons: (i) observable price effects and residual effects move in the same direction in most cases, and (ii) observable characteristic effects move in the opposite direction to the residual effect in the nineties.
Why do the joint observable prices and premiums for skills associated with industry, occupation, and occupational status, and the plausible unobservable prices for skills, rise in the 1980s and fall in the 1990s? It is possible that changes in the supply and demand for workers with different skills can explain these patterns.
The Supply and Demand Explanation
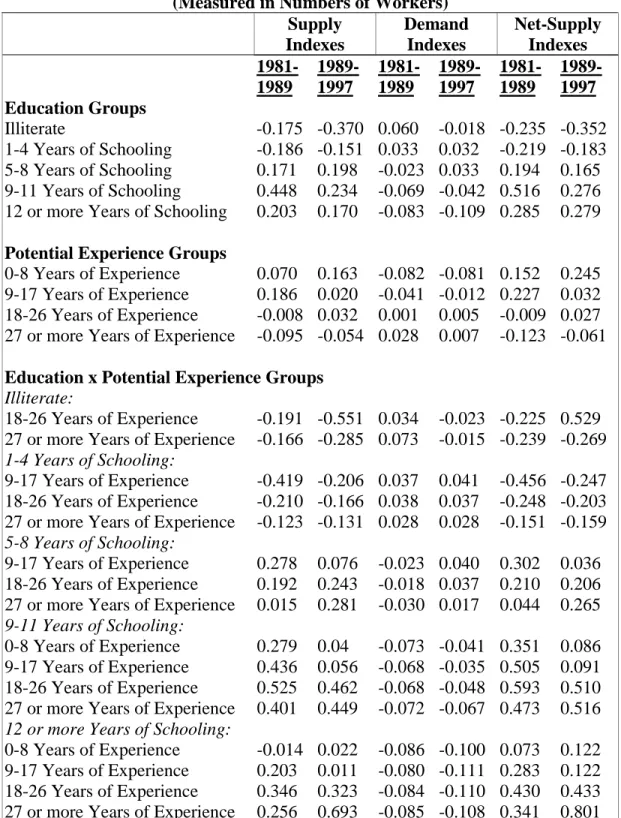
Business industry cells are constructed so that the "output" of a particular employment group is considered an intermediate product. These demand indices reflect the extent to which the business-industry structure favors skill group k relative to 1989 weights in both comparisons. In a partial equilibrium model, one expects that the differences across years in the relative wages for each skill group will be negatively related to differences in net supply ∆NSk.
Indices of supply, demand and net supply are presented in Tables 7 and 8 and are measured in logarithms of points. The supply indices in both tables show a steady increase in relatively more educated and less experienced workers in the 1980s and 1990s. In contrast to the supply indices, the demand indices show a steady decline in the relative demand for higher educated/more experienced workers over the past two decades.
12 For individuals who are not employed in the reference week, I obtain estimated hours using the coefficients from the regression of hours spent in school, potential experience, and potential experience squared from the sample of employed individuals. It is clear that there has been an increase in the net supply of higher educated/more experienced workers relative to lower educated/less experienced workers. If these indices do indeed reflect labor supply and demand forces in Brazil in the 1980s and 1990s, then we would expect, ceteris paribus, a steady decline in skill premiums over these decades.
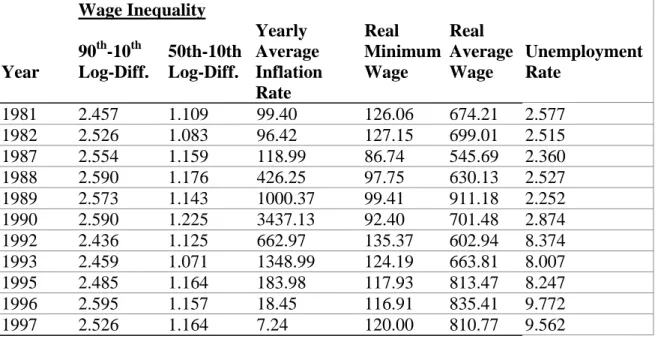
The most one can argue is that the forces of supply and demand were not consistent with wage developments in the 1980s, but could be consistent with relative wage changes in the 1990s. Yet one must reconcile this argument with the finding that observable skills prices have unequivocally widened the gap at the bottom of the wage distribution in the 1990s, as evidenced by the 50th-10th log-differential changes. This supply-and-demand story thus does not seem to be a plausible explanation for the changes in wage inequality in Brazil in the 1980s and 1990s.
Nevertheless, one cannot completely rule out this hypothesis since the supply and demand indices of Tables 7 and 8 only capture variations across industry/occupational cells. Given that the supply and demand shift as measured by equations (6), (7) and (8) is not entirely consistent with the changes in the observable skill premiums and that the remaining equation. It may be that the minimum wage policy and/or the macroeconomic instability of the 1980s and 1990s contributed to the wage inequality changes in Brazil.
The Roles of Minimum Wage Policy and Macroeconomic Instability There is an established literature on the impact of labor policies and institutions such as
The Indexation System
- An Indirect Assessment of Indexation
Indeed, Cardoso (1993) draws attention to the correlation between highly volatile earnings and inflation in the 1980s. An ideal experiment to test the impact of indexation on wage inequality changes would involve obtaining information on indexation clauses in collective bargaining agreements by occupation, industry, union, city, and year. Since this information is not available in the household surveys used in this study, I will calculate the indexation at estimated expected inflation based on information on actual inflation in the previous period.
It appears that the overall effect on the standard deviation is due to the impact on the extreme end of the wage distribution. The unexpected inflation results support the idea that workers at the bottom of the wage distribution are less able to hedge against inflation. On the other hand, the findings of the previous sections reveal that changes in wage inequality are largely due to changes in skill prices related to industry, occupation, and occupational status.
The effects of inflation, unemployment, and minimum wage on the wage distribution of the national sample of male workers are. Note that the variations in inequality are now solely due to differences in the observable prices for skills, including industry, occupation, and occupational status premiums. In this article, I show that the changes in inequality associated with changes in workers' observable and unobservable skill prices in the 1980s and 1990s cannot be consistently explained by.
I suggest that macroeconomic instability can explain the changes in inequality observed over the past two decades. These would lead to an increase in the relative wages of workers at the bottom of the distributions. Bound, John and George Johnson, “Changes in the Structure of Wages During the 1980s: An Evaluation of Alternative Explanations,” American Economic Review 82 (June.
Ferreira, Francisco en Ricardo Paes de Barros, “The Slippery Slope: Explaining the Increase in the Extreme Poverty in Urban Brazilian Review of Econometrics 19 (1999). Litchfield, "Growing Apart: Ongelykheid en armoede-tendense in Brasilië in die 1980's", LSE STICERD Besprekingsdokument n. Fiszbein, Ariel en George Psacharopoulos, "Income Inequality Trends in Latin America in the 1980's", in: Lustig, Nora (red.), Coping With Austerity: Poverty and Inequality in Latin America, The Brookings Institute, 1995, p.
Blanchflower, "A Comparison of Changes in the Structure of Wages in Four OECD Countries", i: Katz, Lawrence og Richard Freeman (red.), Differences and Changes in Wage Strucutures, University of Chicago Press, 1995, s. Barros, "Wage Inequality and the Distribution of Education: A Study of the Evolution of Regional Differences in Inequality in Metropolitan Brazil", Journal of Development Economics s.