Introduction
Navigation in the expanse
- Sensing magnetic fields
- Maps, memories, and manifolds
This has prompted greater scrutiny of the hippocampal circuit and the closely interconnected medial entorhinal cortex (MEC). This discovery has prompted the use of a toroidal manifold [45, 88] as a computational description of firing activities.
Pavlovian, operant, and reinforcement learning
- Behavioral observations and theories of learning
- Reinforcement in models and brains
- Extensions and complications
Often called the "reward prediction error," Shultz found that dopamine neuron firing rates increased proportionally to the difference between the reward the animal experienced and the amount it expected. Although this idea remains dominant, it is challenged by experiments in which lesioning the NAc leads to only modest changes in the animal's behavior.
Reductionistic vs naturalistic experiments
- The Unbearable Slowness of Training
- Observing natural behaviors in a laboratory setting
The mouse navigation experiments described in Chapter III provide a compromise between carefully controlled experiments using arbitrary, artificial stimuli and the observation of animals in the wild, in which complex behavior occurs, but many uncontrolled (and often unmeasured) factors prevent clear interpretations of the data . Learning in maze environments takes place in a fraction of the time it takes to train animals for "easier" tasks and assesses a performance that is undeniably important for the animal: finding water.
Modeling the neural implementation of rapid learning
- Constraints imposed on models by experimental data
- Neural plasticity
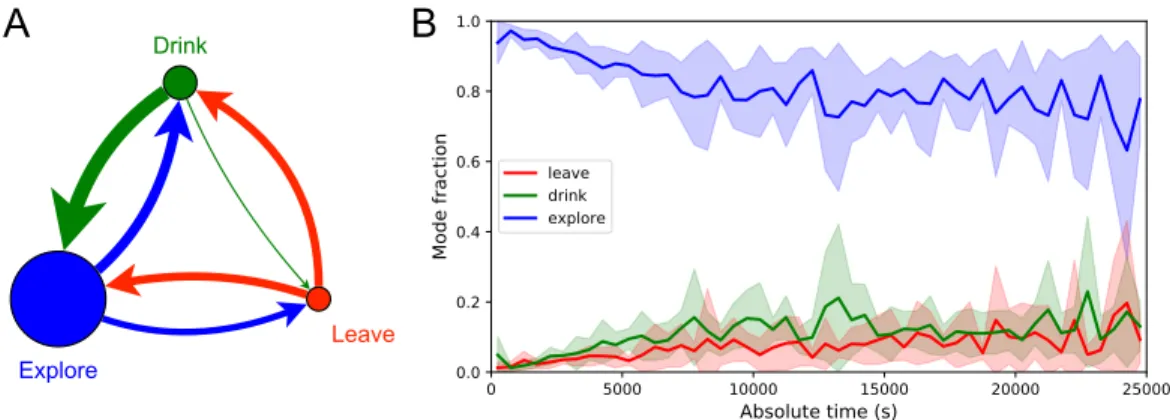
Across animals there was very little variation in the balance of the 3 modes (Figure 3.7–Figure 3.21). Thus, the state of the water location map is stored at the goal synapses.
Global Search for Global Sensation
Introduction
We are involved in a large-scale collaboration to find evidence of magnetoreception in the nervous systems of several species. Each collaborative lab presents intermittent magnetic stimuli during recording from whatever area of the nervous system they are studying among their other projects.
The data
- Craniotomies and headpost implantation for neural recordings 17
- Awake electrophysiology
- Spike sorting
The animal was restrained in the plastic tube and fixed upside down as during the habituation phase. The amplitude of the magnetic field at the location of the bird's head exceeded the strength of the Earth's magnetic field.
Mathematical basics
- Fourier series
- Fourier coefficients of a point process
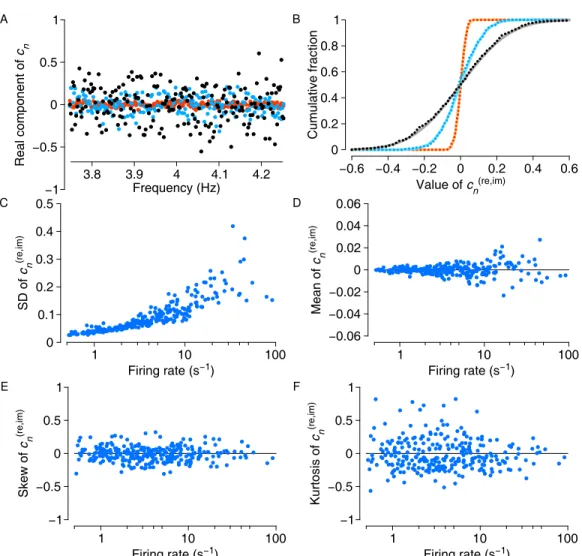
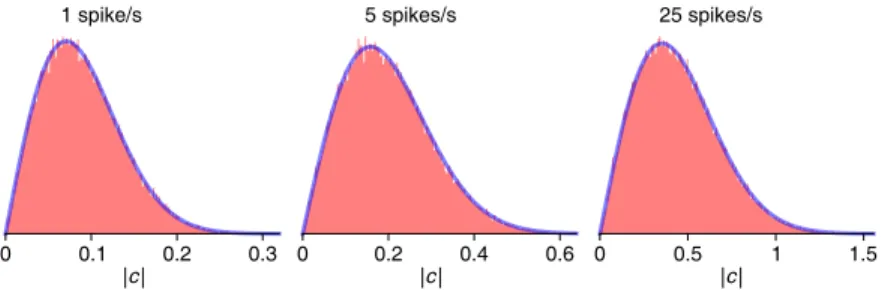
When analyzed against the frequency of the spikes, the former will yield a large (absolute) value for 𝑐𝑛, because the phasors e−2π𝑖𝑛𝑡𝑘/𝑇 are constructively aligned, producing a large sum in the complex plane. Finally, if a periodic spike train is analyzed at a frequency other than the firing rate (or its multiples), the phasors sum destructively and the resulting Fourier coefficient is close to zero (Fig. 2.1C).
Detecting modulation in spike trains
- Warm-up exercise: assuming Poisson statistics
- The Fourier components of actual spike trains
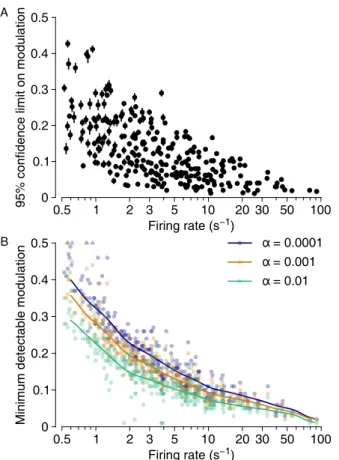
- Confidence limits on modulation
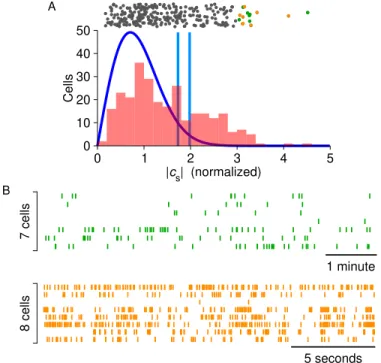
- Results from magnetic stimulation
It helps to consider some toy models for the statistics of the spike train and evaluate the predicted Fourier coefficients. The confidence limit is based on comparison with artificially modulated versions of the same spike train.
Appendix: Derivations of probability distributions
- The normal distribution in two dimensions
- Fourier coefficients of Poisson spike trains
Even in this late phase, however, the animal continued to explore other parts of the maze (Figure 3.2D). Figure 4.1 shows part of the circuit, including a single target cell that responds to the water function.
Mouse Maze Navigation
Abstract
Many mice improve incessantly from one minute to the next, suggesting moments of sudden insight into the structure of the labyrinth.
Introduction
In an effort to identify more generalizable mechanisms of learning and decision-making, one route has been to train laboratory animals on abstract tasks with tightly specified sensory inputs that are linked to motor outputs via arbitrary contingency rules. One way to formalize the act of decision-making in the laboratory is to introduce structure into the environment in the form of a maze that defines straight paths and decision points.
Results
- Adaptation to the maze
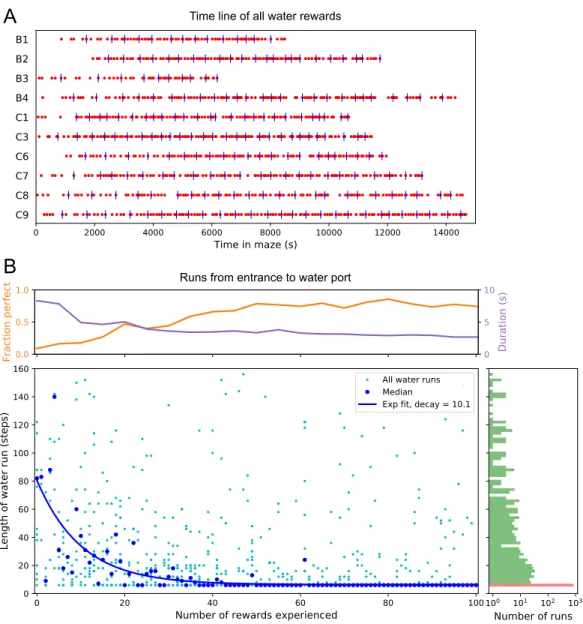
- Few-shot learning of a reward location
- The role of cues attached to the maze
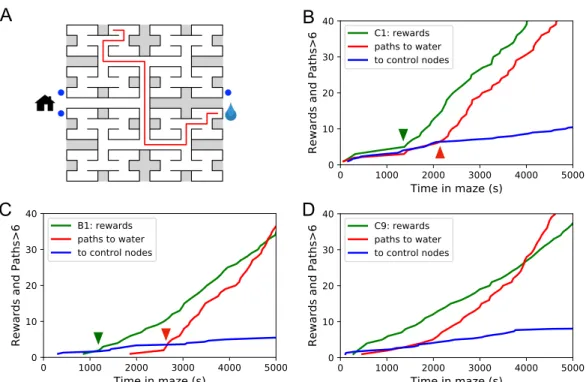
- Discontinuous learning
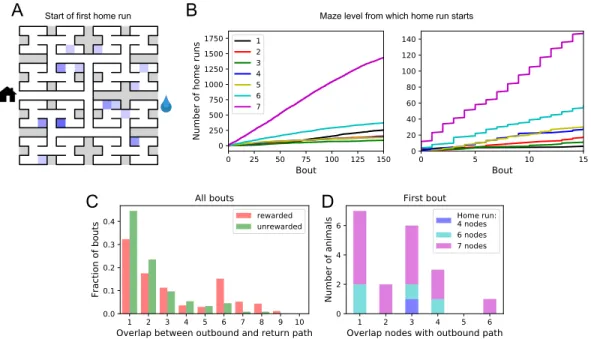
- One-shot learning of the home path
- Structure of behavior in the maze
- Models of maze behavior
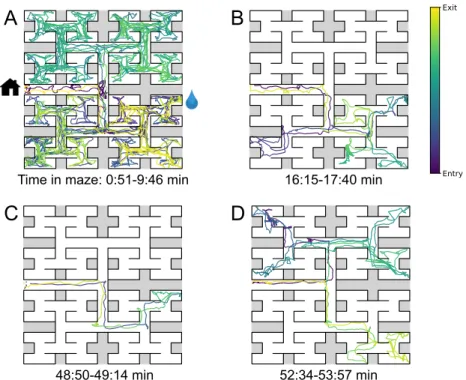
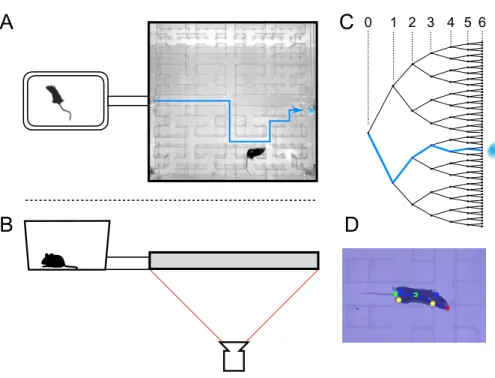
All but one mouse walked easily and frequently between the cage and the maze (Figure 3.1–Figure 3.12). Thus, we focused on all instances where the animal started at the maze entrance and walked to the water port (Figure 3.3B). The maximum distance between the water port and the end node in the opposite half of the maze involves 12 steps through 11 intersections (Figure 3.5A).
They did not fully explain the mice's behavior (Figure 3.9D), which accounted for ~87% of the animals' performance (compared to 60% for the random walk).
Discussion
- Summary of contributions
- Historical context
- How fast do animals learn?
- Sudden insight
- Exploratory behavior
- Mechanisms of navigation
For example, Small [223] built a model of the maze in Hampton Court Gardens scaled to the size of a mouse. Due to the unstructured nature of the experiment, the rat may adopt different policies to reach the water port. Presumably this difference in performance reflects some ongoing changes in the animal's internal maze model, what Tolman called the "cognitive map."
By all accounts, the animals spent much of the night exploring the maze (Figure 3.1–Figure 3.13).
Methods and materials
- Experimental design
- Maze construction
- Reward delivery system
- Cage and connecting passage
- Animals and treatments
- Video recording
- Animal tracking
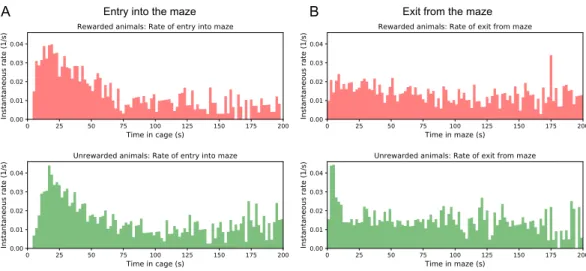
- Rates of transition between cage and maze
- Reduced trajectories
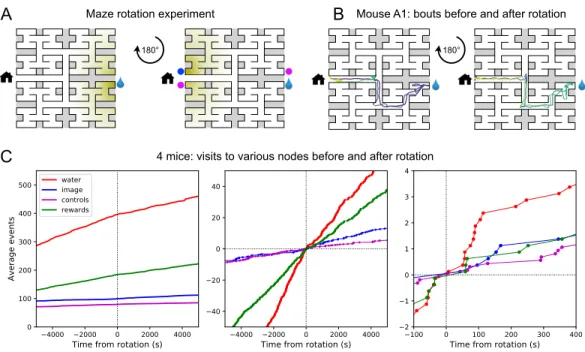
- Maze rotation
- Statistics of sudden insight
- Efficiency of exploration
- Biased random walk
- Models of decisions during exploration
- Data and code availability
For water deprivation, the animal was transferred from its home cage (generally in the group housing) to the maze cage ~22 h before the start of the experiment. All subsequent analysis was based on the trajectory of the animal's nose, consisting of positions 𝑥(𝑡)and 𝑦(𝑡) in each video frame. At an increasingly coarse level, one can ask when the animal passes through the nodes of the binary tree, which are the decision points of the maze.
The purpose of this analysis is to measure how effectively the animal explores all end nodes of the maze.
Figure supplements
Cumulative number of rewards, visits to the waterport, the image of the waterport and control nodes plotted against time before and after the maze rotation. Summary of the steps in the speed of long paths to water detected in 5 of 10 rewarded animals. The fit parameter 𝑏 for all animals, comparing the first with the second half of the night.
Mean and standard deviation of the 4 biases in Figure 3.9A-B across animals in the rewarded and non-rewarded groups.
Acknowledgments
Target cells: These neurons mark the locations of special resources on the map of the environment. In many real-world environments, the topology of the map (how are locations connected?) is likely to be more stable than the targets (which locations are of interest?). During exploration, the circuit learns the topology of the environment, in particular by updating the synapses in the map network (min. Fig. 4.1B).
Evolution of mapping matrix (∥M∥and∥dM∥) and goal matrix (∥G∥ and∥dG∥) during exploration of the binary tree of Fig 4.4A i.
A Simple Circuit Model of Cognitive Mapping
Abstract
An animal entering a new environment typically faces three challenges: exploring space for resources, remembering their locations, and navigating to those targets when necessary. Experimental work in reconnaissance, mapping and navigation has mainly focused on simple environments – such as an open arena, a pond [168] or a desert [174] – and much has been learned about neural signals in various brain regions under these conditions . [53, 227]. However, many natural environments are very limited, such as a system of burrows or trails through the undergrowth.
Nature may have evolved a general mechanism for searching and navigating the ancient chemotaxis pole.
Introduction
A mouse can navigate to the location of food by simply following an upward odor gradient. Suppose the mouse discovers some other interesting location that does not emit an odor, such as a water source or a maze exit (Figure 4.1A). Ideally, a mouse would carry several such scent tags with it so that it can mark different targets, each with its own specific recognizable scent (Figure 4.1A middle and bottom).
Instead, we propose a mechanism by which the mouse brain can calculate a "virtual odor signal" that decreases with distance from a chosen target.
A circuit to implement endotaxis
- Why does the circuit work?
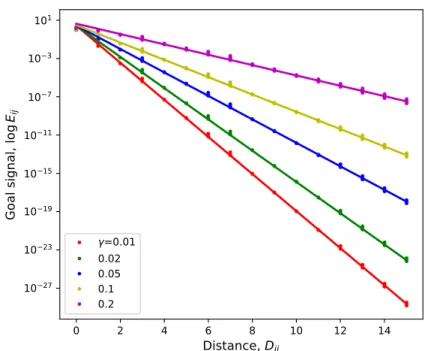
The key insight is that goal cell output falls systematically with the animal's distance from that goal. This leads to a Hebbian strengthening of the excitatory synapses between the two corresponding map cells (Figure 4.2A-B). In this way the recurrent network of map cells learns the connectivity of the graph that describes the environment.
After this map learning, the resulting network of maps is a hump of activity centered on the current location𝑥 of the animal and falling with distance along different paths in the graph (Figure 4.2C).
Performance of the endotaxis algorithm
- Simultaneous acquisition of map and targets during exploration 86
- Change in connectivity
- Appearance of new targets
- Choice between multiple targets
This produces a signal in the target cell that decreases as the distance from the agent to the target increases. through the synapses in the map network. The agent starts walking randomly from the entrance (i) and gradually discovers the other two target locations (water at time iii, insect at time iv). With every step the agent takes, the map network is updated and the range of the entrance odor spreads further (Fig. 4.3B top).
As the agent further explores the environment, the virtual odors spread accordingly to the new locations visited (Figure 4.3B i-iv).

Discussion
- Summary of claims
- Animal behavior
- Brain circuits
- Neural signals
- Learning theories
- Outlook
Indeed, many cells located in the rodent hippocampus appear within minutes of the animal entering an arena [84, 267]. The value function is modified through reward experience when the agent reaches a valuable resource; in endotaxis, this occurs through the updating of synapses in the target network (Gin Fig 4.1B). Model-based reinforcement learning, the agent can learn a prior model of the environment and use it to update a value function.
In contrast, the map matrix in the endotaxis mechanism is built on a policy of random exploration independent of the reward landscape.
Supplement
- A neuromorphic function to compute the shortest distance
- Linear approximation of the endotaxis network
- Limitations of the linear model
- Endotaxis with non-linear activation functions and noise
- Simulations
The agent evaluated the target signal at each of the neighboring nodes and stepped to the one with the highest value. Long-term potentiation of synaptic transmission in the dentate gyrus of the anesthetized rabbit after perforant path stimulation. The origin and role of pathway integration in hippocampal cognitive representations: computational insights into open questions.
Transduction of the geomagnetic field as evidenced by alpha band activity in the human brain.
Future Directions
Sensing magnetism
The work contained herein serves only as an initial foray into a hopefully long-term and productive investigation of the neural mechanisms of magnetic sense that are thought to underlie animals' astonishing ability to migrate long distances. The approach assumes that neurons somewhere increase their firing rate when the magnetic field around the animal changes. Efforts are currently underway in the laboratory to expand both the range of participating laboratories and the range of species tested in our laboratory to include pigeons, butterflies, and waders.
This would provide tremendous opportunities for advancement, both in basic neuroscience research and potentially in translational medicine.
Maze navigation
Perhaps olfaction is necessary for initial learning of the environment, although it is not essential for recall of this information late in the experiment. Requirement of prefrontal and midbrain regions for rapid executive control of behavior in rats. The hippocampus as a spatial map: preliminary evidence from unit activity in freely moving rats.
The role of dopamine in the nucleus accumbens in the expression of pavlovian conditioned responses.
Fourier analysis of point processes
Fourier coefficients from artificial spike trains that obey Poisson
False positive detections resulting from incorrect assumption of
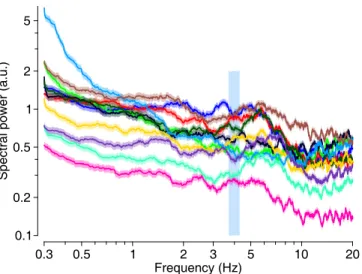
Multitaper power spectra of several spike trains
Fourier coefficients follow a Gaussian distribution to good approximation. 24
Detectability of stimulus-induced modulations
Analysis of recordings during magnetic stimulation
The maze environment
Sample trajectories during adaptation to the maze
Few-shot learning of the path to water
Navigation is robust to rotation of the maze
Sudden changes in behavior
Homing succeeds on the first attempt
Exploration is a dominant and persistent mode of behavior
Exploration covers the maze efficiently
Turning biases favor exploration
Preference for certain end nodes during exploration
Recent history constrains the mouse’s decisions
Occupancy of the maze
Fraction of time in the maze by group
Transitions between cage and maze
Speed of locomotion
Definition of node trajectories
Navigation before and after maze rotation for each animal
Speed before and after maze rotation
Long direct paths for all animals
Statistics of sudden changes in behavior
Three modes of behavior
Efficiency of exploration
Bias statistics
Markov model fits
A mechanism for endotaxis
The phases of endotaxis during exploration, goal-tagging, and navigation. 85
Endotaxis can operate in environments with diverse topologies
Endotaxis adapts quickly to changes in the environment or the target
The goal signal and the choice of 𝛾
Performance of models with linear vs logrithmic map cell activation. 109