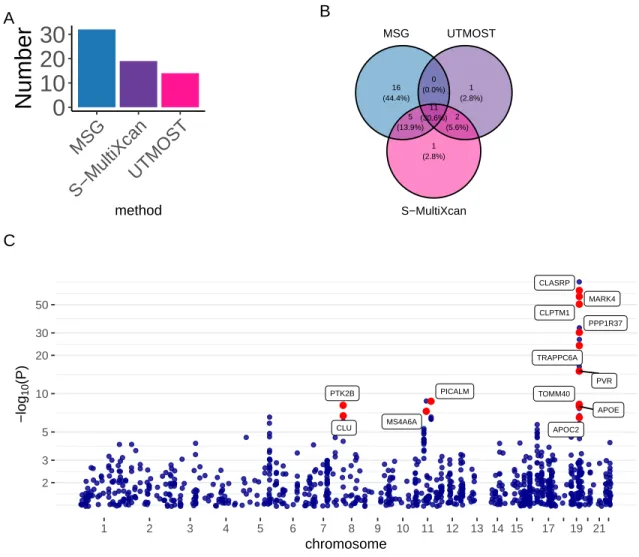
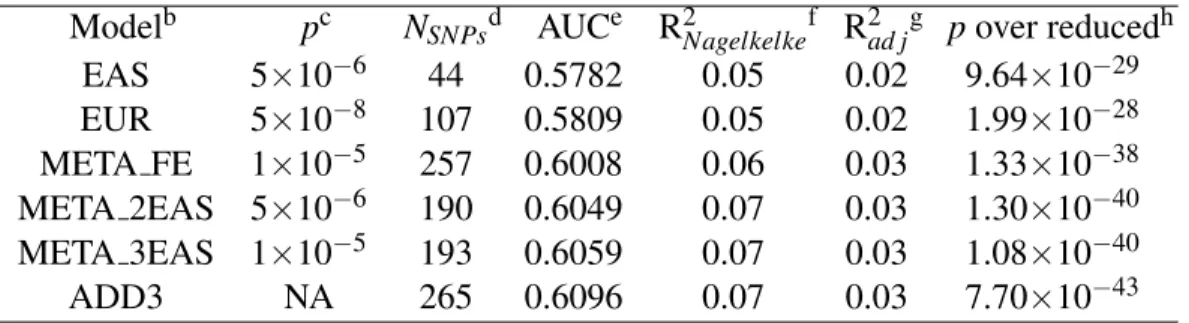
15 2.4 Application of different methods to IGAP Alzheimer's disease.. of the number of significant genes using the different training models. PRSs are derived from EAS, EUR GWASs and fixed effect meta-analysis of EAS and EUR (denoted as META FE).
Introduction
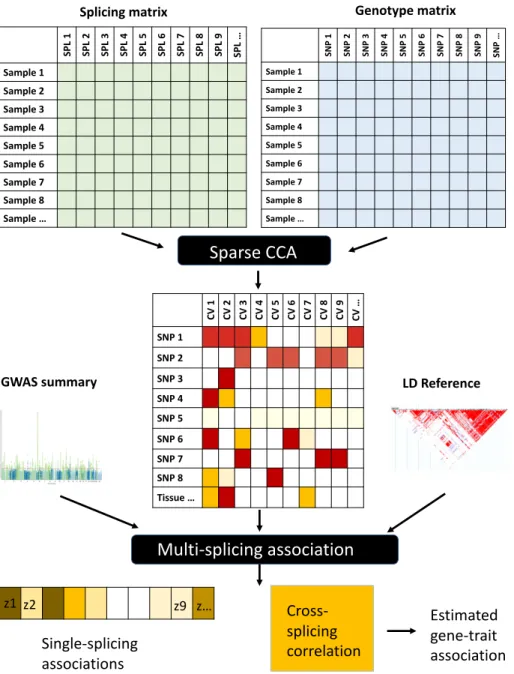
These approaches can be characterized by their strategy: (A) Early: combining data from different sources into a single dataset on which the model is built, (B) Intermediate: combining data by inference from a joint model, and (C ) Let: Build models for each dataset separately and combine them into a unified model (Gligorijevi´c and Prˇzulj, 2015; Rodosthenous et al., 2019). Here we propose an intermediate integration approach, the so-called multidimensional splicing gene (MSG) approach, to directly integrate the correlated splicing events into the model building process based on sparse canonical correlation analysis (sCCA) ( Witten et al., 2009 ).
Results
MSG model building overview
We estimated the predicted joint correlation matrix based on the weights in CV and LD information from a reference panel. We determine the significance of the inferred gene-level multiple association using single-join associations and the psuedo-inverse matrix in a χ2 test.
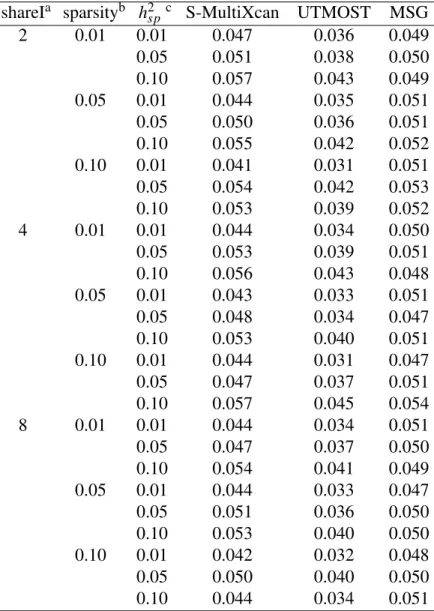
Simulations: type I error and power analysis
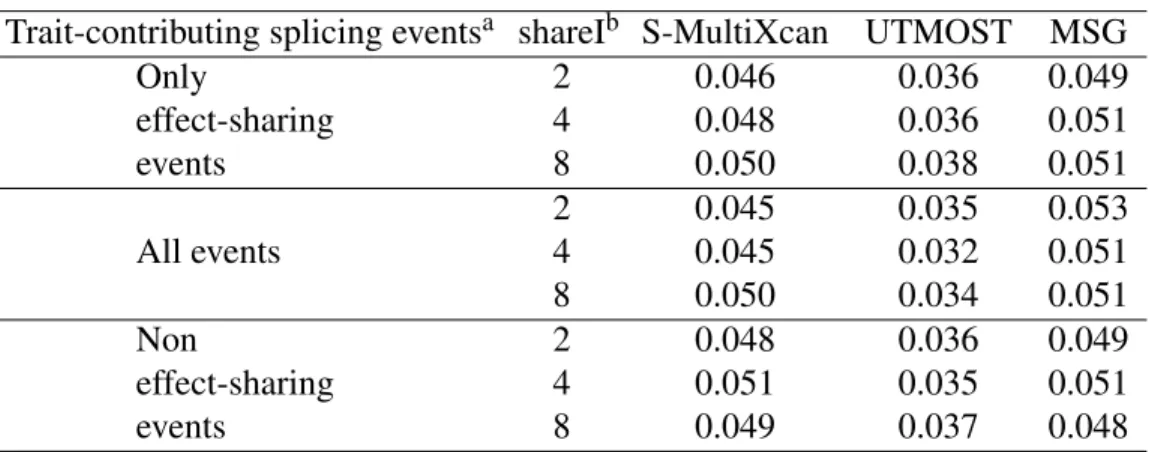
- Type I error
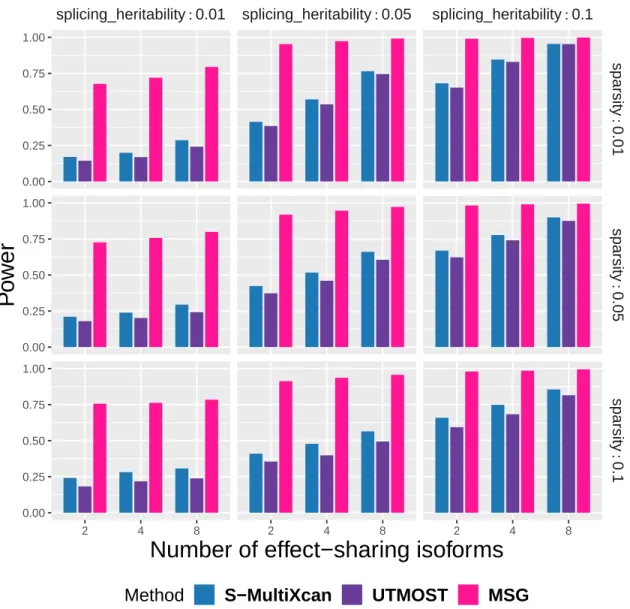
- Power
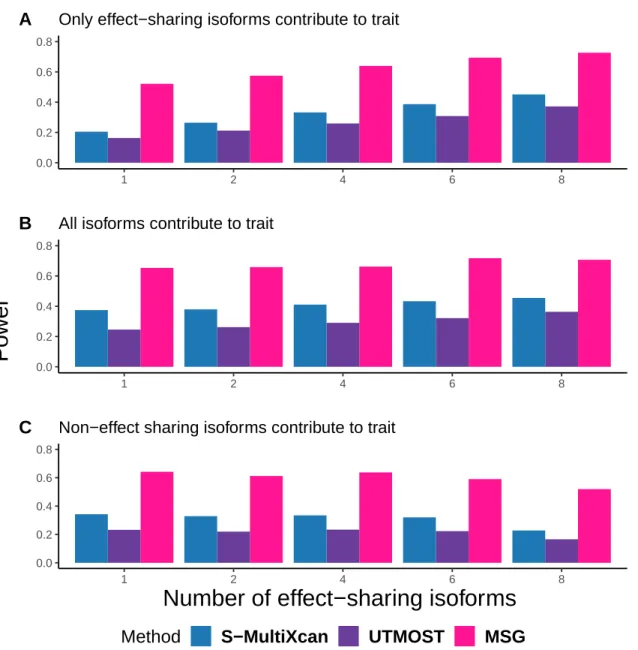
For each subplot, the x-axis represents the number of effect-sharing splicing events and the y-axis represents the proportion of significant genes within 2000 simulations. For each subplot, the x-axis represents the number of effect-sharing splicing events and the y-axis represents the proportion of significant genes within 2000 simulations under a p-value cutoff at 5×10⁻⁶, which was chosen to include the Bonferroni correction real data application. A) Only split events where effects are shared contribute to the property. B) All splitting events contribute to the property. C) Only splitting events with no shared effects contribute to the property.
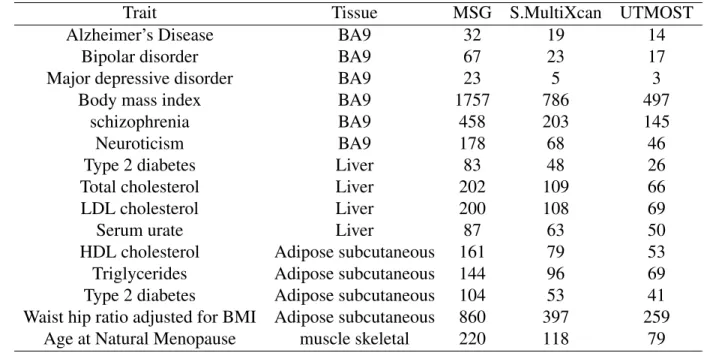
Application to complex human traits
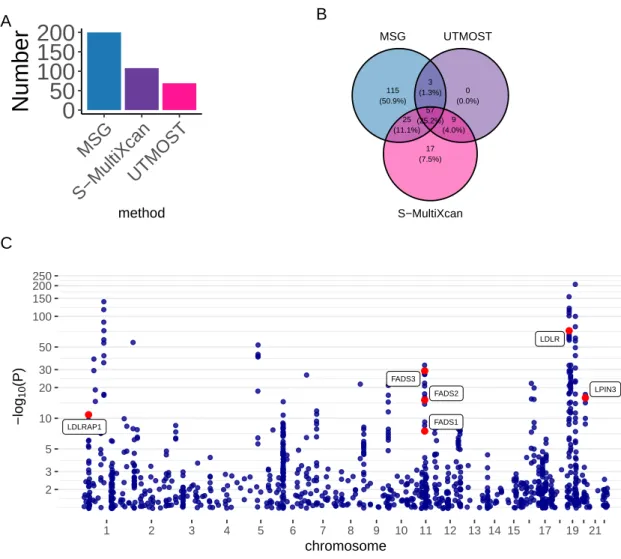
- Summary of applications to 15 traits
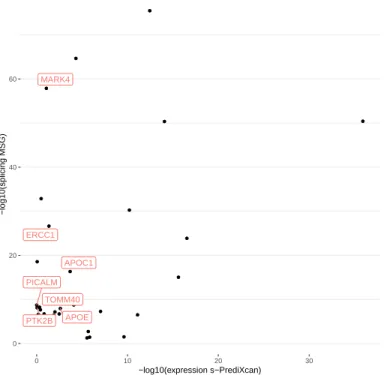
- Application to Alzheimer’s disease
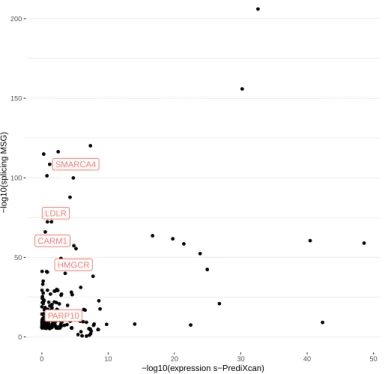
- Application to LDL-C
- Application to Schizophrenia
102 of the 200 significant MSG genes are within 500 kb of the 20 lead GWAS significant SNPs (see the complete list of these genes in Table S2). We found 27 of the 56 expression genes overlapped with the significant binding genes identified by MSG.
Discussion
Meanwhile, predictions in S-MultiXcan/UTMOST may tend to capture the total phenotypic variance, which includes both genetic and non-genetic variation (Aschard et al., 2014), and thus are less powerful than MSG in the application to multidimensional splicing data. These desirable properties of sCCA on correlated data have also been suggested in previous applications to multi-tissue expression data (Feng et al., 2021). Second, when combining signals from multiple canonical splicing vectors, we used SVD approach following S-MultiXcan (Barbeira et al., 2019).
Further causal analysis using methods such as FOCUS (Mancuso et al., 2019) and experimental validation are needed to determine causal genes.
Software and resources
Materials and methods
- MSG framework
- Simulations
- Datasets
- Alternative methods
- Compilation of well-known trait associated gene lists
BandV solutions are obtained using an iterative algorithm (Witten et al., 2009; Witten and Tibshirani, 2009). As individual-level GWAS studies are usually not available, our MSG approach focuses on using GWAS summary statistics and a reference panel to perform an association test following previous work (Gusev et al., 2016; Barbeira et al., 2019; of relevant tissues for each trait, we used top tissues enriched for trait heritability provided by the LARGEST supplementary materials (Hu et al., 2019).
For multidimensional cleavage data analysis, we compared the performance of our MSG approach with two current state-of-the-art methods in the main text: S-MultiXcan (Barbeira et al., 2019) and UTMOST (Hu et al., 2019).
Supplementary Materials
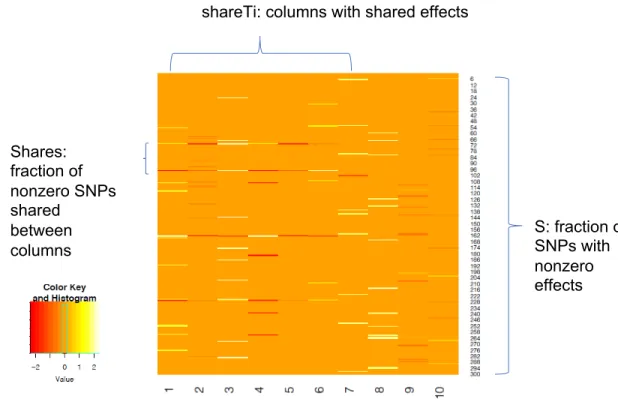
Illustration of W matrix
The authors performed intensive hand curation to confidently identify AD-associated genes (positive genes) from several disease gene sources including AlzGene, AlzBase, OMIM, Dis-Genet, DistiLD and UniProt, Open Targets, GWAS Catalog, Differentially Expressed Genes . (DEGs) in ROSMAP, and published literature. We obtained LDL-C-related genes from a previous curated list (Zhou et al., 2020) that includes genes from the literature and KEGG pathways.
Effect of reference panel sample size on type I error for MSG
Compilation of well-known trait associated gene lists
- Compilation of AD-associated genes
- Compilation of LDL-associated genes
- Compilation of SCZ-associated genes
Since there are many genes previously associated with SCZ, we focused on genes associated with SCZ via splicing from literature.
Introduction
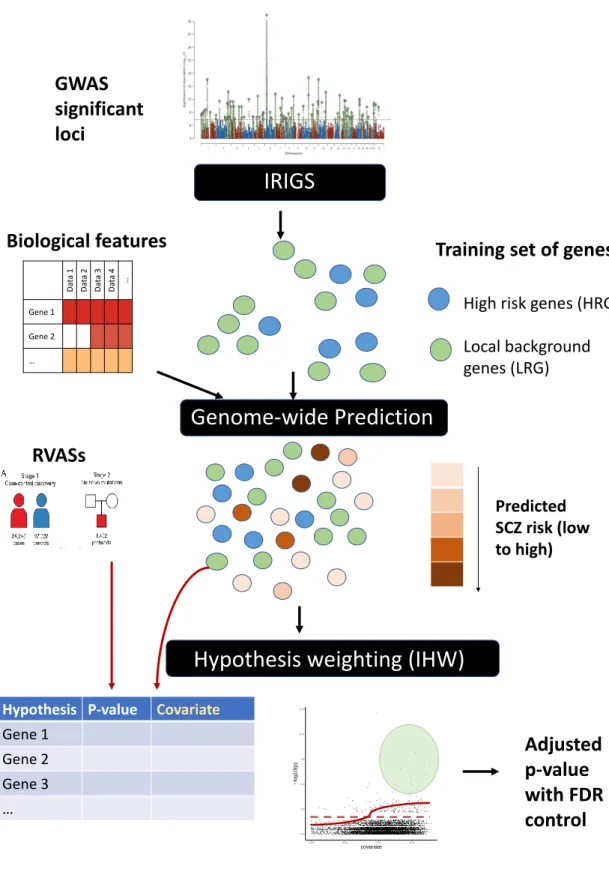
Recently, many hypothesis weighting methods have been developed, and a detailed comparison of these methods was reviewed elsewhere (Korthauer et al., 2019; Ignatiadis and Huber, 2017). Among these methods, independent hypothesis weighting (IHW) (Ignatiadis et al., 2016) has been recommended due to its powerful, robust and computationally efficient nature (Huang et al., 2020; Korthauer et al., 2019). Genome-wide association studies (GWASs) provide us with opportunities to derive scores at the gene level to facilitate discovery of RVASs, as recent findings suggest the convergence of trait-associated genes from common and rare variants (Singh et al., 2020).
To demonstrate this pipeline, we propose to detect SCZ-associated genes from p-values in recent RVAS (Singh et al., 2020) using predictions obtained from recent GWAS (Ripke et al., 2014).
Methods
- Method overview
- Obtain the training set of genes
- Feature pre-processing
- Model training and genome-wide prediction of SCZ risk
- Application of IHW for hypothesis weighting
- The SCZ RVAS data
- The ASD RVAS data
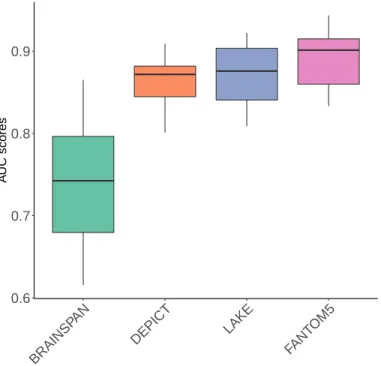
BRAINSPAN (Miller et al., 2014) is a dataset containing RNA sequencing profiling of various cortical and subcortical structures across the entire course of human brain development. DEPICT (Pers et al., 2015) provides a dataset of 14,461 'reconstituted' gene sets with a membership probability for each gene in each gene set, based on co-regulation of gene expression and previously annotated gene sets representing a broad spectrum of biological genes. logical annotations. The FANTOM5 project ( Andersson et al., 2014 ) used cap analysis of gene expression (CAGE) technique to measure promoter usage in 975 human samples.
LAKE (Lake et al., 2018) includes nuclear transcriptomic data for more than 60,000 single cells from adult human visual cortex, frontal cortex, and cerebellum from six different individuals.
Results
Evaluation of prediction scores
We then conducted a systematic empirical evaluation based on the enrichment of the SNP-based heritability by stratified LD score regression (LDSC) ( Bulik-Sullivan et al., 2015 ; Finucane et al., 2015 ) according to the ensemble score ranking . As shown in Figure 3.3, we found that the top-ranked genes are significantly enriched in SNP-based heritability by applying LDSC to a most recent SCZ GWAS (Ripke et al., 2020). The analysis used the most recent SCZ GWAS published in 2020 (Satterstrom et al., 2020).
We further evaluated the ensemble score-based gene ranking using enrichment analyzes with gene lists repeatedly implicated in SCZ (Wang et al., 2019).
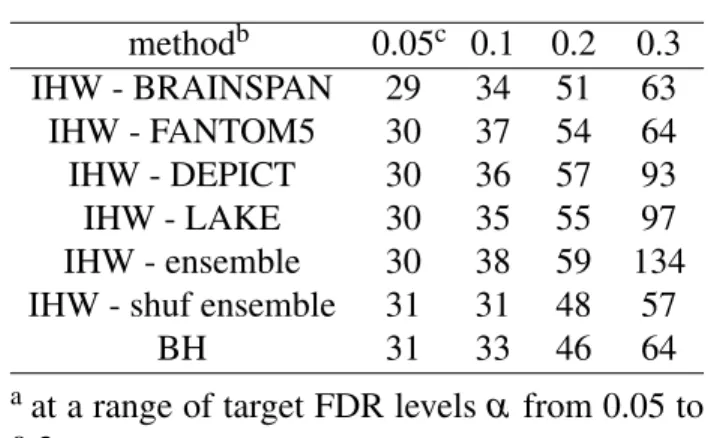
Leverage prediction as covariates to identify SCZ risk genes
We also evaluated the 64 genes that are significant by conventional BH adjustment at α =0.3 for GO term enrichment and observed that none of the GO terms are significant at the FDR=0.1 level. The lack of GO enrichment in the identified BH-regulated genes may be caused by the lack of power or specificity of the original results. CACNA2D1 is an example, not significant after traditional BH adjustment (p=0.23) but significant after IHW adjustment (p=0.065).
Another example is FABP7, not significant after traditional BH adjustment (p=0.21) but significant after IHW adjustment (p=0.065) respectively.
Leverage prediction as covariates to identify ASD risk genes
Non-synonymous polymorphisms were identified from SCZ and ASD in FABP7 ( Shimamoto et al., 2014 ). We applied gene ontology enrichment analysis to the 488 genes that are insignificant using BH adjustment but significant after IHW adjustment at FDR level α = 0.3. Previous studies have shown that deletions of COBL cause defects in the morphogenesis of the neuronal cytoskeleton in model vertebrate animals (Ahuja et al., 2007).
Previous studies have found significant reductions in GABRA1 expression in several brain regions of subjects with ASD (Fatemi et al., 2009).
Discussion
It has also been supported by case-specific CNVs in autism case-control studies (Griswold et al., 2012). Previous studies have shown that adjusting the hypothesis weights mainly affects genes with "borderline significance". Therefore, the weighting approach is most useful for genes with a marginal effect (Roeder and Wasserman, 2009).
We explored other methods that can include multiple covariate dimensions such as AdaFDR (Zhang et al., 2019) and AdaPT (Lei and Fithian, 2016).
Conclusions
There are other data sources that could potentially be included as features, such as proteomics, epigenomics. However, our application of AdaFDR did not provide improvements in the identified genes and tends to be less stable;. There may be room for further improvement in the way to integrate multiple covariates, which is worthy of future exploration.
Availability of data and materials
Abbreviations
Supplementary Materials
Introduction
Given that non-EUR GWAS are usually of insufficient sample size and that there is extensive genetic sharing across populations (Consortium et al., 2015), there are several recent studies that attempted to incorporate a large EUR GWAS and a smaller non-GWAS. -EUR GWAS to improve risk prediction in non-EUR populations. 2019) found that this approach did not work well for several anthropometric, blood count, and blood pressure traits in their Hispanic/Latino cohorts (Grinde et al., 2019). Differential linkage disequilibrium (LD) and minor allele frequency (MAF) are major contributors to the poor transmission of PRSs among populations (Wang et al., 2020b).
MAF has been used as an indication of the strength of natural selection, so the differences in selection strengths between ancestors may have an impact on PRSs (Wang et al., 2020b).
Materials and methods
- GWAS training data in samples of European ancestry
- GWAS training data in samples of Asian ancestry
- Validation data of East Asian ancestry
- Meta-analysis of EUR and EAS
- LDpred
- Assessment of PRSs
- Data Availability Statement
- Web Resources
The EUR and EAS GWAS used in the analysis are from BCAC and ABCC, respectively. In this study, we use the implementation of the P+T method in the software package PRSice-2 (Euesden et al., 2015) with the default threshold ofr2=0.2 for clustering of correlated markers and clustering windows of 250 kb. When using a model with only PRS as a predictor, we report the in-sample fit using all individuals in the validation set.
To assess the relationship between PRS and breast cancer case/control status, individuals in the validation set were binned into 10 deciles according to PRS, and the percentage of cases in each bin was determined.
Results
- Trade-off between training GWAS sample size and matched ge-
- Upweighting the EAS effect size estimates in meta-analysis im-
- GWAS effect size heterogeneity is related to LD score differences
- Effects of LD differences on genetic risk prediction
- Effect of MAF differences on GWAS effect size and genetic risk
META 2EAS: A modified meta-analysis that increases the weight of the EAS summary statistics by a factor of two;. META 3EAS: A modified meta-analysis that increases the weight of the EAS summary statistics by a factor of three;. We included PRSs consisting of EUR and EAS GWAS only, as well as modified meta-analyses that increase EAS effect size estimates by a factor of two or three.
The PRS derived from the rescaled meta-analysis that increases the EAS effect size estimates by a factor of three increased Nagelkerke's pseudo R2 prediction (obligation-adjusted R2) by and 5% (6%), respectively, compared to the PRS- of derived from EAS GWAS only, EUR GWAS only and conventional fixed-effects meta-analysis of both.
Discussion
Maximizing the power of principal component analysis of correlated phenotypes in genome-wide association studies. Genome-wide association study implicates hla-c*01:02 as a risk factor at the major histocompatibility complex locus in schizophrenia. Using eqtl weights to improve power for genome-wide association studies: a genetic study of childhood asthma.
Meta-analysis of genome-wide association studies: no efficiency gain in using individual participant data. Genome-wide association analysis of more than 120,000 individuals identifies 15 novel breast cancer susceptibility loci. Genome-wide meta-analysis, fine mapping, and integrative prioritization implicate novel Alzheimer's disease risk genes.