Investing in Corporate Bonds and Credit Risk
Frank Hagenstein, Alexander Mertz
and Jan Seifert
A N D C R E D I T R I S K
FRANK HAGENSTEIN,
ALEXANDER MERTZ AND JAN SEIFERT
Investing in
Corporate Bonds
and Credit Risk
All rights reserved. No reproduction, copy or transmission of this publication may be made without written permission.
No paragraph of this publication may be reproduced, copied or transmitted save with written permission or in accordance with the provisions of the Copyright, Designs and Patents Act 1988, or under the terms of any licence permitting limited copying issued by the Copyright Licensing Agency, 90 Tottenham Court Road, London W1T 4LP.
Any person who does any unauthorized act in relation to this publication may be liable to criminal prosecution and civil claims for damages.
The authors have asserted their rights to be identified as the authors of this work in accordance with the Copyright, Designs and Patents Act 1988.
First published in 2004 by PALGRAVE MACMILLAN
Houndmills, Basingstoke, Hampshire RG21 6XS and 175 Fifth Avenue, New York, N.Y. 10010
Companies and representatives throughout the world
PALGRAVE MACMILLAN is the global academic imprint of the Palgrave Macmillan division of St. Martin’s Press, LLC and of Palgrave Macmillan Ltd.
Macmillan® is a registered trademark in the United States, United Kingdom and other countries. Palgrave is a registered trademark in the European Union and other countries.
ISBN 1–4039–3469–X
This book is printed on paper suitable for recycling and made from fully managed and sustained forest sources.
A catalogue record for this book is available from the British Library.
Library of Congress Cataloging-in-Publication Data Hagenstein, Frank
Investing in corporate bonds and credit risk / Frank Hagenstein, Alexander Mertz, and Jan Seifert.
p. cm.—(Finance & capital market series) Includes bibliographical references and index.
ISBN 1–4039–3469–X (alk. paper)
1. Bonds. 2. Investments. 3. Credit—Management. 4. Risk management. I. Mertz, Alexander, 1973– II. Seifert, Jan, 1971– III. Title. IV. Finance and capital markets series
HG4651.H23 2004
332.63⬘234—dc22 2004048937
10 9 8 7 6 5 4 3 2 1
13 12 11 10 09 08 07 06 05 04 Printed and bound in Great Britain by Antony Rowe Ltd, Chippenham and Eastbourne.
v
List of Tables viii
List of Figures xi
Preface xx
Foreword xxi
1 Introduction 1
1.1 Background 1
1.2 Organization of the Book 2
1.3 Setting for Credit Management 4
2 Investment Process 6
2.1 Basic Structure of an Investment Process for
Credit Portfolios 6
2.2 Diversification of Ideas 9
2.3 Quantitative Analyses 13
3 Strategic Asset Allocation 23
3.1 Overview of the Top-down Research Process 23
3.2 Macroeconomic Environment 25
3.3 Valuation 46
3.4 Market Technicals 63
Contents
4 Tactical Asset Allocation 69
4.1 Overview 69
4.2 Spread Class Selection 70
4.3 Sector Allocation 76
4.4 Credit Curve Positioning 98
5 Credit Research 109
5.1 Introduction 109
5.2 The Bottom-up Approach for Industrial Companies 109
5.3 Financial Institutions 163
6 High-Yield Investing 181
6.1 Introduction 181
6.2 Description of the High-yield Market 182
6.3 Drivers of the High-yield Market 190
6.4 Crossover Credits/ Fallen Angels 213
6.5 Risk Management in High Yield 217
6.6 Relative Value 221
7 Credit Derivatives 229
7.1 Introduction 229
7.2 Credit Default Swaps 229
7.3 Collateralized Debt Obligations 237
8 Credit Indices 249
8.1 Index Selection 249
8.2 Exchange Traded Funds 253
9 The Role of Ratings 257
9.1 Reducing Information Asymmetry 257
9.2 Ratings and Credit Spreads 260
9.3 The Perspective of Buy-and-hold Investors 262
9.4 The Perspective of an Active Manager 266
9.5 Ratings and Risk Management 268
10 Portfolio Construction 269
10.1 Introduction 269
10.2 Statistical Properties of Bond Returns 272 10.3 Portfolio Optimization with Skewness and Kurtosis 273 10.4 Illiquidity and Portfolio Construction 278 10.5 Out-of-sample Performance of Optimized Portfolios 281 10.6 Long-term Characteristics of Corporate Bond
Portfolios 285
11 Total and Absolute Return Strategies with Credits 288
11.1 Multicurrency Investing 288
11.2 Asymmetric Risk Management for Corporate
Bond Portfolios 292
12 Risk Management 307
12.1 Management of Systematic Risk in Credit Portfolios 307 12.2 Reducing Nonsystematic Risk Through
Diversification 310
12.3 Modeling Default Risk in Credit Baskets 314
References 321
Index 329
viii
2.1 Stylized balance sheet 14
3.1 Factors of the Altman z-score model 47
3.2 Structure of the markets for Euro and US Dollar denominated investment grade corporate bonds as of October 2003
(in percent) 64
4.1 Selected industries and their main event risks 94 4.2 Index characteristics of the Merrill Lynch EMU Corporate
Index and the subsector automotive per Feb. 29, 2004 106 4.3 Alternative strategies to change the portfolio exposure to a
certain sector 107
5.1 Income statement according to US–GAAP 113
5.2 Balance sheet positions according to US–GAAP 115
5.3 Main working capital ratios 115
5.4 Cash flow statement according to US–GAAP 118 5.5 A classification of cash in- and outflows from operating,
investing and financing activities 118
5.6 Cash flows from operating activities (direct method) 120 5.7 Cash flows from operating activities (indirect method) 120 5.8 Computation of free cash flow from operations using the
indirect method 121
5.9 Behavior of convertible bonds in different life cycles 135 5.10 Correlation matrix among different asset classes
(Dec. 97– Jan. 04) 136
5.11 Qualitative and quantitative factors applied in the company
selection process 148
List of Tables
5.12 Major event risks for companies 156 5.13 Average principal loss rate and recovery rate according to
seniority as of Dec. 2003 158
5.14 Risk-weighting scheme for banking book items 166
5.15 Trading book capital requirements 167
5.16 Banking book capital requirements 167
5.17 Risks of bank capital to investors 170
5.18 Notching methodology of the three major rating agencies
for bank capital 170
5.19 Comparison between the cost of common equity and the
cost of Tier 1 preferred 178
6.1 Definitions of Moody’s corporate bond ratings 183 6.2 Monthly total return correlation between various asset
classes Jul. 83–1 Dec. 2003 186
6.3 Correlation of monthly returns of corporate bonds by
rating classes 1989–2003 187
6.4 Corporate average rating transition matrix in percent,
1985–2002 187 6.5 Rating transitions for high-yield corporates 1997–2003 188 6.6 The change in bond prices over a 12-month horizon 190 6.7 Cumulative average default rates 1983–2002 194 6.8 Recovery rates by security and priority in Europe and the
United States (in percent) (1982–2002) 196
6.9 Distribution of years to default from original issue date
1989–Sep. 2003 199
6.10 15 bonds from companies which were downgraded from investment grade into high yield by either Moody’s or S&P
during 2002–2003 215
6.11 Analysis approach for “Fallen Angels” and other troubled credits 216 6.12 Categories of troubled companies (December 2003) 218 6.13 Average ratings for selected US high-yield industries in
Feb. 2004 226
8.1 Criteria for the selection of benchmark indices 251 9.1 Cumulative default probabilities of corporate bonds for
the period 1970–2002 263
9.2 Recovery rates for defaulted US corporate bonds for the
period 1982–2002 263
9.3 One-year rating migration probabilities for US investment
grade corporate bonds 266
9.4 Example for the calculation of expected excess return for
a 1-year investment horizon 267
10.1 Descriptive statistics of Merrill Lynch US bond indices
during the sample period Jan. 1987–Sep. 2003 272
10.2 Composition of MRPs, TPs and ERPs based on the mean–variance (MV), shortfall risk (LPM) and Corning–Fisher (CF) framework for the sample
period Jan. 1987–Sep. 2003 276
10.3 Risk/return characteristics of MRPs, TPs and ERPs based on the mean–variance (MV), shortfall risk (LPM) and
Corning–Fisher (CF) framework for the sample period
January 1987 to September 2003 277
10.4 Composition of MRPs, TPs and ERPs based on the mean–variance (MV), shortfall risk (LPM) and
Corning–Fisher (CF) framework for the sample period Jan. 1987–Sep. 2003 after adjustment for serial
correlation in index returns 281
10.5 Risk/return characteristics of MRPs, TPs and ERPs based on the mean–variance (MV), shortfall risk (LPM) and Corning–Fisher (CF) framework for the sample period Jan. 1987–Sep. 2003
after adjustment for serial correlation in index returns 282 10.6 Second-order stochastic dominance efficient sets for the
out-of-sample performance of optimized portfolios 283 11.1 Maximum position limits for corporate bonds with an
implied investment grade rating in an absolute return
portfolio with a maximum drawdown of 0.5 percent 300 11.2 Examples for the calculation of the Herfindahl Index 302
xi
2.1 Structured investment process for the management
of credit portfolios 7
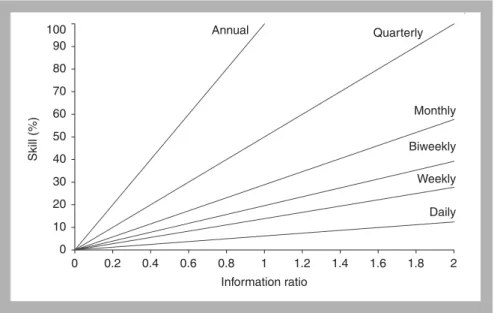
2.2 Evans–Archer diagram of risk versus diversification 9 2.3 Skill required to achieve a certain information ratio depends
on the frequency of the implementation of independent trades 11 2.4 A given information ratio is achieved by various
combinations of skill and breadth 12
2.5 Pay-off patterns for debt- and equity holders at maturity of
the liabilities 15
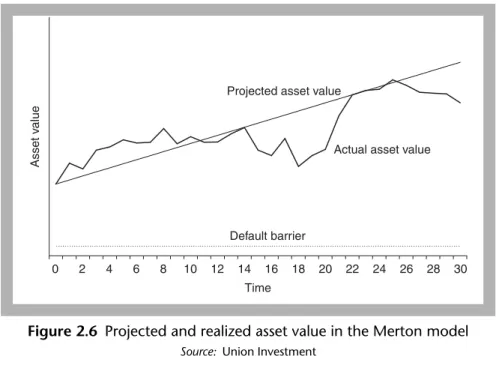
2.6 Projected and realized asset value in the Merton model 17 2.7 Cumulative default probability assuming a
hazard rate of 4 percent 19
2.8 Option of the management to alter the capital structure 21 3.1 Structure of the research process of the strategic
asset allocation 23
3.2 Moody’s Baa corporate bond spread versus
long-term treasury bonds 28
3.3 Dependency of US big three automotive manufacturer’s
rating from the business cycle 29
3.4 Moody’s Baa corporate bond spread versus Fed
Funds Target Rate 31
3.5 Moody’s Baa corporate bond spread and index
of help wanted advertising 32
3.6 Equity-based metrics of leverage 33
3.7 Level of indebtedness of the US
nonfinancial corporate sector 34
List of Figures
3.8 Ratio of credit market instruments to internal funds for
the US nonfinancial corporate sector 35
3.9 Ratio of credit market instruments to pre-tax profits of the
US nonfinancial corporate sector 36
3.10 Percentage points of capital expenditures of the US nonfinancial corporate sector that are not covered by
internal funds versus Baa corporate spread over treasuries 37 3.11 Ratio of net interest payments to cash flow for the US
nonfinancial corporate sector 38
3.12 Ratio of profits before tax and interest of the US nonfinancial corporate sector to net interest payments
versus Baa/Aa yield ratio 39
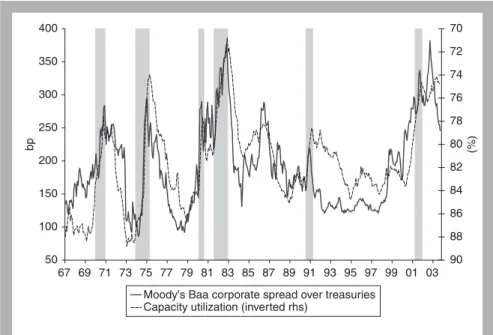
3.13 US total industry capacity utilization versus Moody’s
Baa corporate spread over treasuries 40
3.14 Annual change in US industrial production versus
Moody’s Baa corporate spread over treasuries 41 3.15 Stylized leverage cycle and performance in credit
and equity markets 42
3.16 Baa corporate spread over treasuries versus trailing
12-month default rates 45
3.17 Moody’s ratings drift ([upgrades – downgrades]/number of rated issuers) versus Moody’s Baa corporate spread over
treasuries 45 3.18 Ratio of working capital to total assets for the
US nonfinancial corporate sector 48
3.19 Undistributed profits, earnings before tax and interest and internal funds versus total assets for the US
nonfinancial corporate sector 49
3.20 Market value of equity outstanding to total credit
market instruments of the US nonfinancial corporate sector 49 3.21 Nominal GDP of the US nonfinancial corporate
sector to total assets 50
3.22 Moody’s Baa corporate bond spread
versus Altman’s z-score 51
3.23 Moody’s Baa corporate bond spread versus two fundamental models based on Altman’s five indicators
for the health of the corporate sector 52
3.24 Euro corporate bond spreads versus equity-market
performance 53 3.25 Three-year rolling equity-market returns versus Baa
corporate spread versus treasuries 55
3.26 Euro corporate bond spreads versus Dow Jones Euro
Stoxx 50 implied volatility of at-the-money call options 56
3.27 Moody’s Baa–Aa spread differential versus implied
equity volatility for the S&P 100 57
3.28 Ex ante equity risk premium for the US stock market
and Moody’s Baa corporate spreads versus treasuries 59 3.29 Baa corporate bond spreads and CSFB global risk
appetite index 62
3.30 Spread versus government bonds for Euro and US$
investment grade corporate bonds 65
3.31 Volume of announced mergers, acquisitions or divestitures
involving either a European respectively US target or acquirer 66 3.32 Net issuance of the US nonfinancial corporate sector 67 3.33 Rolling 12-month net foreign purchases of
US financial assets 67
3.34 Net new sales and liquid assets ratio of US investment
grade corporate bond funds 68
4.1 Structure of the tactical asset allocation 70 4.2 Sensitivity of different rating buckets to spread changes in
the Merrill Lynch EMU corporate index in the period
Dec. 1996–Feb. 2004 71
4.3 Spread history of different types of Euro bank debt 72 4.4 Spread differential between senior and subordinated
Euro insurance bonds versus risk appetite 73 4.5 Retail sales around the 2001 recession in comparison to the
last six recessions 75
4.6 Spread history of different industry sectors of the Euro
corporate bond market 76
4.7 Structure of the industry analysis 77
4.8 Life cycle of an industry 78
4.9 5-Forces diagram 79
4.10 Total and domestic corporate profits as a percentage
of GDP 1950–2003 82
4.11 US corporate bond spreads and corporate profits as a
percentage of GDP 1991–2003 82
4.12 Profit cycle of various industries 83
4.13 Stylized profit cycle 84
4.14 Profit cycle since the recession March
until November 2001 85
4.15 Change in profits in recession and recovery
for selected industries 85
4.16 Global industries value chain 87
4.17 Value chains for telecommunications wireless
and electric utilities 88
4.18 Value chain for the automobile sector 89
4.19 Amount of issuers on negative credit watch and US BBB
corporate bond spread in basis points 95
4.20 Relative value chart, spread volatility on x-axis and spreads
ony-axis for different sectors 96
4.21 Spread volatility and spread level for the European
investment grade market 97
4.22 The behavior of the treasury yield curve in the
1991–2001 business cycle 98
4.23 Slope of the 2s10s credit curve for A-rated US industrials
versus spread levels in the period Jan. 1997 until Nov. 2003 100 4.24 Slope of the credit curve for A-rated US industrials
versus slope of the yield curve during the early stages of the
economic expansion after the 1990/91 recession 101 4.25 Slope of the credit curve for A-rated US industrials versus
slope of the yield curve during the 2001 recession 101 4.26 France Telecom CDS spot and forward
curves in 1-year on Mar. 17, 2004 103
5.1 Bottom-up approach for industrial companies 110
5.2 Dimensions of corporate credit risk 111
5.3 Major financial ratios 122
5.4 Leverage and spread levels for selected European investment grade bonds (Merrill Lynch EMU Corporate
Index ex financials) on February 13th 2004 123
5.5 Financing hierarchy 126
5.6 Change in weighted average cost of capital with an
increasing leverage 129
5.7 The different life cycles of a plain convertible bond 131 5.8 VNU 5-yr CDS versus stock price, Mar. 18, 2002
Sep. 04, 2002 133
5.9 Convertibles are a valuable asset class compared to
stocks or bonds (Dec. 97–Jan 04) 137
5.10 Convertibles in the Markowitz-framework 137 5.11 Scenario analysis for a selected convertible bond issue 138
5.12 SWOT analysis 140
5.13 Multifactor Portfolio Matrix – each quadrant represents
a business unit 142
5.14 Business strategy 144
5.15 Ford equity price and bond spreads between
Oct. 1999 and Jan. 2004 146
5.16 Ford bond spreads and Ford implied equity volatility
between Oct. 1999 and Feb. 2004 147
5.17 Ahold bonds and equity reacted sharply to the
announcement of accounting fraud 147
5.18 Relationship between Worldcom stock and bonds 148
5.19 Selected Euro telecom bonds with 1–10 year maturity
on Feb. 11, 2004 151
5.20 Selected Euro automobile bonds with 1–10 year maturity
on February 11, 2004 152
5.21 Deutsche telekom cash bonds and CDS on
Feb. 11, 2004 153
5.22 Ford motor credit cash bonds and CDS on
Feb. 11th 2004 154
5.23 Single corporate bonds versus sectors and market index 154 5.24 Monthly spread change for selected Euro
automobile bonds (February 2004) 155
5.25 Contractual and Structural subordination of
high-yield bonds 157
5.26 Coupon step-up 161
5.27 Regulatory capital of a bank according to the
Basel Capital Accord 164
5.28 Asset swap spreads of Euro Tier 1 issues as of Jan. 2004 173 5.29 Asset swap spreads of Euro Lower Tier 2 issues as
of Jan. 2004 174
5.30 Risk-reward profile of different types of bank
capital as of Dec. 2003 174
5.31 Asset swap spreads of Euro denominated bank issues 175 5.32 Spread differentials between different types of Euro
denominated subordinated bank issues 177
6.1 High-yield bonds as a percentage of outstanding
corporate bonds by principal amount 184
6.2 High-yield spread classes 02/99–02/2004 185 6.3 Investment grade and high-yield average
path to default, Aug. 2001 189
6.4 Relationship between GDP growth and US high-yield
spreads Jun. 85–Sep. 2003 192
6.5 Default rate peaks between 1920 and 2003 193 6.6 Default rates cycle by issuers and the
amount outstanding 1988–2003 193
6.7 Correlation between high-yield spreads and Moody’s
default rate Jan. 1985–Jan. 2004 195
6.8 Average 1-year credit loss rates 1982–2002 (in percent) 197 6.9 New issuance being used to refinance
1986–Nov. 2003 (in percent) 200
6.10 Distress ratio 1992–Feb. 2004 201
6.11 Moody’s default rate and the distress ratio
1990–2003 (in percent) 201
6.12 Correlation between US capacity utilization and high-yield
spreads Jan. 1985–Jan. 2004 202
6.13 Relationship between IP and default rates 1983–2004 204 6.14 Relationship between high-yield spreads and ISM
index 1985–2003 205
6.15 Correlation between high-yield spreads and the tightening
standards for commercial and industrial loans 1990–2003 205 6.16 Relationship between high-yield spreads and the demand for
Commercial and Industrial Loans 1991–2003 206 6.17 Relationship between equity (here: S&P 500) and high-yield
markets Dec. 96–Nov. 2003 207
6.18 Correlation between high-yield spreads and equity market
volatility Jan. 2000–Dec. 2003 208
6.19 Relationship between mutual fund flows
and high-yield spreads 209
6.20 Relationship between mutual fund flows
and high-yield total returns 210
6.21 High-yield mutual fund liquidity ratio Jan. 2000–Oct. 2003 210 6.22 Coverage (EBITDA/Interest) and spread levels
for selected high-yield companies (Merrill Lynch BBs and
Bs in Euro and US$, Nov. 2003) 211
6.23 Leverage (Total Debt/EBITDA) and spread levels for selected high-yield companies (Merrill Lynch BBs
and Bs in Euro and US$, Nov. 2003) 212
6.24 Leverage (Total Debt/(Total Debt⫹MarketCap) and spread levels for selected high-yield companies
(Merrill Lynch BBs and Bs in Euro and US$, Nov. 2003) 212 6.25 Correlation between treasury returns and high-yield
market returns 1990–2003 213
6.26 Average spread for selected companies 200 days before and after being downgraded to high yield by either Moody’s or
S&P during 2002–2003, The vertical line marks day “0” 215 6.27 Disciplined stop loss marks for a high-yield Portfolio,
in percent 217
6.28 The evolution of bond prices for Ericsson, Tyco and
ABB during phases of distress 219
6.29 Parmalat bond prices Sep. 03–Dec. 03 221
6.30 Spread differential between investment grade and
high-yield indices in Euro and US$ Apr. 1998–Nov. 2003 222 6.31 Spread differential between BBB and BB spread in Euro
Mar. 1999–Nov. 2003 222
6.32 Spread diferential between BBs and B, US issuers 1989–2003 225
6.33 Relative value of CCC-C rated bonds 225
6.34 Spread differential between US and Euro high-yield
markets Dec. 97–Nov. 2003 226
6.35 Value of $100 invested in high yield and S&P
500 Jan. 1987–Dec. 2003 227
6.36 Two-year rolling volatilities of returns for high
yield and equities, Jan. 1990–Dec. 2003 228 6.37 Yields in high-yield market to BBBs and the 10-year
Treasury Jan. 88–Dec. 2003 228
7.1 A typical credit default swap 230
7.2 Physical settlement (credit event) 230
7.3 CDS isolates the credit risk component 231
7.4 Deutsche Telecom CDS basis 232
7.5 CDS spread is highly correlated to implied equity volatility 234 7.6 Spread trade: Vodafone CDS versus France Telecom CDS 234 7.7 Munich Re senior versus subordinated CDS spreads 236
7.8 CDS basis for PHILIPS ELECTRONICS 236
7.9 Widening in the Fiat basis because of
convertible bond issuance (hedging) 237
7.10 Funded cash flow CDO 238
7.11 BB/BBB-Leveraged loan spreads 239
7.12 CDO Capital structure 240
7.13 Synthetic CDO 241
7.14 Static versus managed CDO 242
7.15 BBB–CDO note versus a BBB-corporate bond
fund over 5 years 242
7.16 Inflection point of a AAA-note (annualized 5-year cumulative credit loss rates), around 10⫻the historical
multiple loss 244
7.17 Inflection point of a BBB-note (annualized 5-year
cumulative credit loss rates), around 4.5 times the historical
multiple loss 244
7.18 Inflection points assuming different recovery rates
(5-year cumulative default rates) for AAA-notes 245 7.19 Inflection points assuming different recovery rates
(5-year cumulative default rates) for BBB-notes 245 7.20 Expected loss of a mezzanine class
(equity 4 percent) in relation to the size 246 7.21 Risk leverage as a function of subordination
compared to the portfolio expected loss 246 7.22 Different annualized default risk measurements 247 7.23 Default rates of speculative issuers regressed to
their recovery rates 247
7.24 Breakeven point of an equity-note (annualized 5-year cumulative credit loss rates), 2.5⫻the historical
multiple loss 248
9.1 Reaction of Fiat bond and stock prices on rating actions 259 9.2 Spread dispersion of Euro investment grade corporate
bonds by rating class as of February 27th, 2004 261 9.3 Spread history of Ford and Renault issues with
similar characteristics 262
9.4 Spreads required to compensate investors for taking on default risk under the assumption that future default
probabilities and recovery rates equal historical ones 264 9.5 Spread history of US corporate bonds by rating class 265
10.1 Portfolio optimization objectives 270
10.2 Efficient frontier with minimum risk portfolio (MRP),
tangency portfolio (TP) and equal risk portfolio (ERP) 275 10.3 Return distributions and cumulative return distributions of
two investment alternatives F and G 278
10.4 Effect of desmoothing (serial correlation adjustment) of index time series on the risk/return profiles of the considered
asset classes 280
10.5 Resampled efficient frontiers. Light grey lines show the expected risk-return profile of the optimized portfolios, thin lines the actual risk-return profiles under the assumption that in the out-of-sample period the “true” means,
variances and correlations are realized 284 10.6 Membership in the second-order stochastic dominance
efficient set under the assumption of autocorrelated returns 286 11.1 Option adjusted spreads (OAS) of Ford bonds with identical
maturity and similar coupon, but in differing currencies 290 11.2 Changes in option adjusted spreads for GE bonds with
similar maturity and identical coupon, but in differing
currencies 291
11.3 Classification of investment styles 294
11.4 Spread changes of the constituents of the Merrill Lynch EMU Corporate Index as of Dec. 31, 2001 over the course
of the year 2002 295
11.5 Agency ratings and implied ratings as alternative indicators
of credit risk 299
11.6 US corporate bond spreads during the Russia/LTCM crisis 303 12.1 Expected tracking error of equally weighted Euro corporate
bond portfolios versus Merrill Lynch EMU Corporate Index 311 12.2 Realized tracking error of equally weighted Euro corporate
bond portfolios versus Merrill Lynch EMU Corporate Index 311 12.3 Expected tracking error of ex ante optimal Euro corporate
bond portfolios versus Merrill Lynch EMU Corporate Index 312 12.4 Realized tracking error of ex ante optimal Euro corporate
bond portfolios versus Merrill Lynch EMU Corporate Index 313
12.5 Schematic stop loss approach for investment
grade corporate bonds 314
12.6 Default distribution for a portfolio of 100 issuers with a default probability of 10 percent and pairwise default
correlations of 1 percent 316
12.7 Default distribution for a portfolio of 100 issuers with a default probability of 10 percent and pairwise default
correlations of 4 percent 316
12.8 Default distribution for a portfolio of 100 issuers with a default probability of 10 percent and pairwise default
correlations of 8 percent 317
xx
Preface
This book covers various topics related to credit risks. The last couple of years was driven by a volatile and changing world of corporate bonds.
Strategic asset allocation for corporate bonds in general and the use of quantitative techniques (in particular) has become more and more impor- tant. Therefore credit managers have to use structured credit products and derivatives for positioning and hedging.
Looking forward the challenge for being successful in managing credit portfolios will be a split between top-down and bottom-up analysis. A per- manent overlay of risk management tools is needed for generating an attractive risk-adjusted performance.
Special thanks are due to Viktor Hjort (Credit Strategist from Morgan Stanley) for his input in Chapter 7.
Thanks are also due to colleagues at Union Investment: Anja Mikus (MD of Fixed Income Portfolio Management) and Martin Marinov (Macro Strategist) for their helpful comments in Chapter 3 and Peter Varga (Credit Fund Manager) for his input on convertibles in Chapter 5. We gratefully acknowledge significant support by Thomas Bossert (MD of institutional portfolio management) who provided us with the description of an asymmetric risk management for corporate bond portfolios in Chapter 11.
Finally we are very grateful to Matt King (Head of European Quantitative Credit Strategy) from Citigroup for the foreword and his careful pre-reading of various chapters.
xxi
Investing successfully in credit represents a considerable challenge. Over the past few years, the asset class has grown enormously. So too has the range of derivative instruments and modelling techniques which ought to aid portfolio management. Yet coping with the day-to-day realities of port- folio management – the fear that another undetected accounting scandal might undermine a whole year’s returns, the difficulty of making up for losses with gains elsewhere, the illiquidity of the asset class – remains as difficult as ever. Somehow much of the literature on credit portfolio management remains too academic to be easily applicable in practice.
In this book, Hagenstein, Mertz and Seifert steer a careful path between the best of theory and practice. Drawing upon years of buy-side experience of running corporate bond portfolios in both high grade and high yield, and illustrating with numerous examples, they provide a practical guide to suc- cessful portfolio management in cash, and to the workings of the myriad of derivative instruments (single name and tranched) now widespread in the market.
I have personally not seen any single volume elsewhere which provides such a comprehensive guide to successful investing in credit.
Matt King Director, Head of European Quantitative Credit Strategy Citigroup Global Markets Limited
Foreword
1
1.1 BACKGROUND
In the last ten years the investment world has changed dramatically. The equity bubble of the second half of the 1990s that created so many million- aires was financed by corporate credit. New technologies, mergers and acqui- sitions and share buyback programs were financed primarily by the issuance of corporate bonds. As a consequence the market value of the European corporate bond market quadrupled between the end of 1996 and April 2003.
Now, after the equity bubble has burst, investors are looking for alternatives.
Because of their spread over government bonds corporate bonds provide an attractive yield in the current low-interest rate environment. But the conse- quences of the excesses of the 1990s have weighed heavily on the market. The confluence of the bursting of the equity bubble and the 2000/2001 recession that was caused by overinvestment led to exceptionally high default rates.
Balance sheet irregularities and corporate malfeasance as in the cases of Enron, Worldcom and Ahold have caused excessive volatility and have made issuer selection, in this period, the key in the investment process.
Therefore the demand for protection has increased rapidly. The credit derivatives market has benefited from this need. It has promoted the efficiency of corporate financing by bringing together the two sources of external financing: the corporate bond market and the market for bank loans. Credit default swaps (CDS) provide the opportunity to trade and evaluate credit risk in an isolated manner. They also make it possible to create short positions in the credit markets by buying protection without owning the underlying. The success of the market for collateralized debt obligations (CDO) is closely tied to the popularity of credit derivatives.
Often CDS serve as the collateral for a CDO. The valuation of synthetic credit derivatives requires not only an assessment of the fundamental situation of each company, but also a thorough understanding of the default
Introduction
correlations of the constituents in the basket. Because of its relatively low correlation with other asset classes CDOs have gained more and more popu- larity especially among the institutional investor base.
With the increasing volume and liquidity of the credit market new play- ers have entered into the arena. Hedge funds and speculators look for arbi- trage opportunities between the different capital market instruments of one issuer. Mispricings and other market inefficiencies seem to be decreasing.
These developments require a sound understanding of the market dynam- ics and the market drivers. Traditionally, credit investors have made money through a simple buy-and-hold strategy. In the low default rate environ- ment of the early- and mid-1990s they earned the carry of the bonds they invested in by avoiding the few names that blew up. But this strategy only works fine when default rates are low and credit spreads are declining. The harsh market environment stretching from 1997 to autumn 2002 was char- acterized by increasing leverage across most companies and sectors, widen- ing credit spreads and finally soaring default rates. Clearly, in this period earning carry was not enough.
In the meantime investors have understood that the risk/return profile of credit instruments is asymmetric. Whereas the return potential is somewhat limited there is a small probability of realizing a significant loss in the case of a default of the company that was invested in. Therefore detailed analyses of the macroeconomic environment, industry trends and fundamental com- pany data are required to support an active, disciplined investment process.
Qualitative and quantitative analyses complement each other to form a com- prehensive picture. Despite the vast variety of information sources, the vali- dation and weighting of the different pieces of information lies in the hands of the portfolio manager. Nevertheless, cases of fraud show that even the best analyses sometimes cannot protect investors from incurring losses.
Professional investors minimize this risk by diversifying their portfolios broadly. The years 2000–02 have shown that disciplined realtime risk man- agement should be an integral part of any structured investment process for credits. The evolution of the credit derivatives market boosts the efficiency and the growth of the corporate bond market as a whole. But as a conse- quence, deviations from fair value will become fewer and shorter, meaning that the struggle for outperformance versus benchmark indices or peer groups will become more demanding. The structured investment process presented in this book hopefully will provide the tools to generate consis- tently advantageous risk/return profiles for credit portfolios over the medium to longer term.
1.2 ORGANIZATION OF THE BOOK
In the course of Chapter 2 we will provide an overview of the whole invest- ment process that will be developed in this book. We will also spend some
time on two basic concepts of every active management process. First, the concept of diversification will be redefined to include three dimensions, then the fundamental law of active management will be introduced. Since every step of the investment process can be supported by quantitative as well as qualitative analyses, the merits and pitfalls of each research concept will be discussed at this early stage of the book.
Chapters 3–5 focus on the three basic pillars of a structured investment process for credits:
■ the research process of the strategic asset allocation is top-down driven.
It results in recommendations for the portfolio beta, that is the aggres- siveness of the portfolio versus the benchmark index, and in the case of mixed portfolios or pure government portfolios, the weighting of corpo- rate bonds.
■ the selection of the sectors and spread classes are the main tasks of the tactical asset allocation. In this step the research process combines top-down and bottom-up elements.
■ issuer and issue selection are the last steps of the investment process. They are based on fundamental analyses and relative value considerations.
When the investment universe is extended to include asset classes that are not comprised in the benchmark, large opportunities for outperformance arise. However, the peculiarities of the high-yield market, the natural exten- sion of the investment universe for investment grade investors, require a slightly modified investment process. Therefore the particular focus of Chapter 6 is on bond covenants, an issue that is of minor relevance in the investment grade universe. The popularity of credit derivatives has grown immensely during the last five years. They are not only efficient tools for hedging credit risk, but also a possible source of outperformance. CDS and CDOs form a major part of Chapter 7. Chapter 8 presents a brief introduc- tion to the most popular credit benchmarks as well as exchange traded funds (ETF) that track credit indices. Keep in mind that the first step to out- performance is a profound knowledge of the benchmark.
Chapter 9 deals with the role of ratings in the investment process.
Questions like ‘Are ratings the best indicator for credit quality?’ or ‘What influence do changes of the rating outlook have on credit spreads?’ are discussed.
Portfolio optimization in a Markowitz framework is a basic feature of many investment processes. Chapter 10 introduces two alternative approaches that account for the asymmetric risk profile of corporate bonds.
Skewness and leptokurtosis are typical characteristics of time series of credit returns. Nontrading and nonsynchronous trading in less liquid segments of the credit universe, for example, the high-yield sector, distort conventional estimates of volatility. Therefore, the weights of illiquid
sectors that are obtained by most optimization approaches are significantly too high. We will provide a desmoothing algorithm that deals with this problem. The results of a backtesting indicate that our alternative frame- works deliver portfolios with a more favorable risk/return profile than those obtained by Markowitz optimization.
In a low-return environment and with the equity meltdown still in mind, total return concepts have gained dramatically in importance. There is virtually no investment company that does not try to offer a proprietary total or absolute return product. Credit as a whole is an interesting asset class for total return managers, because well-diversified portfolios exhibit astonishingly low volatility compared to government bonds of the same average maturity, for example. Usually in economic downturns, credit spreads widen and government yields decline. In upturns, investors reward better fundamentals on the company level with lower spreads, while at the same time government yields are mostly on the increase. The relatively young market for credit derivatives, too, provides a playfield for total return investors because it offers several products that show low corre- lations with traditional asset classes. Chapter 11 discusses some total return concepts that are based on credit.
Risk management is relevant for all kinds of credit investing. In the last chapter we will define the demands for a sophisticated risk management tool for credit portfolios and discuss the assumptions underlying two alter- native concepts. Although ex ante risk models help to identify sources of risk, they do not protect investors from losses through single issuer credit events. Therefore sufficient diversification is essential for the management of credit portfolios. In the portfolio context dependency of default plays a major role, especially with respect to absolute return products like CDOs.
1.3 SETTING FOR CREDIT MANAGEMENT
The focus of this book is on the investment process for credit portfolios and the different aspects of its practical implementation by portfolio managers.
But usually when the portfolio manager enters the arena, his playfield is already prepared. The definition of investment idea, performance goal and benchmark selection are carried out before the launch of the portfolio.
Because those decisions heavily impact the degrees of freedom of the port- folio manager, he should attempt to get involved in the product develop- ment. The decisions made in this phase are usually irreversible. So to a certain degree the success of the product from a marketing as well as a per- formance perspective is essentially determined without direct participation of the portfolio manager.
Especially, the choice of the investment universe and the benchmark have a material impact on the risk-return characteristics of a credit
portfolio. From a portfolio manager’s point of view, the other important points are
■ investment goal
■ investment horizon
■ risk tolerance or risk budget and
■ restrictions.
Who defines the investment goal, depends on whether the portfolio is managed on behalf of private or institutional investors. If the product is targeted at private investors the definition of the investment goal and universe are usually chosen to suit a broad class of investors. Institutional portfolios are more focused and therefore often are exposed to a lot of restrictions. Whereas rating triggers apply to mutual funds as well as to specialized funds, upper limits for the weighting of financial issuers would be an example for a specialized fund.
The issue of benchmark selection will be tackled in detail in Chapter 8.
Hence, in this context we can concentrate on the consequences of benchmark selection during the process of product development. In the past, narrow liquid benchmark indices normally outperformed the broad market during credit rallies. In times of financial distress the opposite was true. So the use of large cap indices as a benchmark tends to result in a more volatile portfolio performance. This is due to the lower diversification, higher liquidity and better replicability of large cap indices.
6
2.1 BASIC STRUCTURE OF AN INVESTMENT PROCESS FOR CREDIT PORTFOLIOS
This chapter introduces a structured investment process for credit portfolios as seen in Figure 2.1. It comprises three central pillars that will be discussed in great detail in Chapters 3–5. In Chapter 3 we will start with the assess- ment of the global environment for credits. Generally, the analysis of macroeconomic factors like GDP growth, central bank policies as well as the level, trend and migration velocity of default rates, to name only some of the most important variables, supports the decision about the weighting and structure of corporate bonds in mixed portfolios or the aggressiveness of a pure corporate bond portfolio. Market drivers like swap spreads, the correlation with equity-market performance and volatility and the shape of the yield curve, and last but not least, technical factors like flows of funds and corporate bond issuance also help to derive the strategic asset alloca- tion. Comparisons are drawn relative to other asset classes and relative to the historical performance of corporate bonds in a similar market environ- ment. In the context of pure corporate bond portfolios the portfolio beta or the aggressiveness of the portfolio relative to its benchmark is determined.
For mixed portfolios or even portfolios with government benchmarks, additionally, the weighting of corporate bonds is fixed.
The selection of industries and spread classes is based on top-down as well as bottom-up criteria. The questions that have to be answered at this stage are: Do high spread assets, for example, look cheap or rich relative to less risky investments? Which sectors or industries offer the most value for a certain time horizon? Empirical studies show that there are two main drivers that influence the level of spreads: credit quality and maturity.
Therefore the investment universe should be divided in buckets by a spread and a maturity factor. It should be noted that in our investment
Investment Process
process spread classes, or in other words risk classes, take the role of rat- ings. In our view spread and spread volatility are realtime indicators for credit quality, whereas ratings tend to lag changes in company fundamen- tals. Nevertheless, ratings play a role, because usually constraints in the investment policy are closely linked to ratings. A typical example is that many mutual funds are not allowed to invest in speculative grade issues. In the case of a downgrade below BBB-/Baa3 they might become forced sell- ers. The partial change in the investor base creates high volatility for fallen angels and rising stars, resulting in investment opportunities, but also a lot of downside risk.
Traditionally credit investors have put a strong emphasis on fundamen- tal analyses of the issuers. Consequently, the company selection is based to a large extent on the bottom-up approach. The fundamental analysis incor- porates information from the cash flow and income statement, balance sheet and financial ratio analysis, business strategy, competitive environ- ment and management quality. The fundamental analysis on the company level has to be accompanied by relative value analyses, that is by compar- ing a company’s credit spreads versus its peer group and historical spreads.
In 2001 and 2002 equity-based models for the valuation of corporate bonds gained tremendous popularity. Reasons for this were the high corre- lation between equity-market performance and implied volatility of equity options on the one hand, and corporate bond spreads, on the other hand.
During this period, the strong relationship held almost across all sectors and issuers. While the analysis of balance sheet data and evaluation of management skills requires a profound knowledge of the company, its
Strategic Asset Allocation
Determination of portfolio beta (and weight of corporate bonds in mixed portfolios)
Tactical Asset Allocation
Selection of spread classes and sectors and credit curve positioning
Bottom-up
Top-down
Credit Research
Analysis and selection of issuers and bonds
Figure 2.1 Structured investment process for the management of credit portfolios
Source: Union Investment
competitors and industry trends, structural models rely solely on a mathe- matical relationship between equities and corporate bonds. Hence, they are easy usable tools that can save a lot of time. But in our discussion of qualita- tive and quantitative research processes at the end of this chapter we will show that equity-based models work only in particular stages of the credit cycle.
Any corporate bond team has to divide its human resources between top-down and bottom-up research. The strengths and weaknesses of the sec- tor specialists and the fact that performance can be measured against a cor- porate benchmark, a government benchmark or a mixed benchmark will determine the appropriate mix. If the performance is measured against a government benchmark the top-down approach will be assigned more importance because, in the first step, a global picture for credits has to be assessed. It can be stated that even corporate bonds with weak financial ratios and balance sheets relative to their peer group can add dramatically to the performance of a portfolio if, for example, the economy is in a growth period (positive credit environment). A fund with a corporate benchmark should allocate a large part of the fixed-income department to the bottom- up-driven process of industry and company selection. On the other hand, one has to consider that the addition of a few corporate bonds in a fund with a government benchmark can cause a high tracking error versus the peer group and the benchmark whereas the chances for an underperformance remain significant because of lack of diversification. Instead, corporate bond funds should be considered as a suitable admixture for funds with a govern- ment benchmark. The accompanying risk of the fund performance versus the benchmark has to be evaluated by the fund management.
Especially when corporate bonds are included in portfolios with a gov- ernment benchmark, risk management plays a major role in the investment process. The failure of ex ante apparently safe companies like Worldcom or Swissair provided a painful lesson for many investors. The particularity of corporate bonds lies in the asymmetric risk/return profile. A high probabil- ity to achieve a relatively small outperformance versus riskless instruments is contrasted by a small likelihood of incurring substantial losses. Because of the limited return potential of corporate bonds a sophisticated approach to managing downside risk is highly recommended. Only if capital losses are minimized the potential benefits of corporate bonds can unfold. Sufficient diversification on the sector and issuer level therefore is one key to success in corporate bond portfolio management. Combining various sources of infor- mation, for example top-down and bottom-up analyses or qualitative and quantitative methods, provide a comprehensive overview of the risks and opportunities of certain investment ideas. This increases the likelihood to create a consistently advantageous risk/return profile. Hence, careful analy- sis is not only one of the pillars of a state-of-the-art investment process for corporate bonds, but implicitly a first step towards risk management.
2.2 DIVERSIFICATION OF IDEAS
The performance of most portfolio managers is measured against a bench- mark index. Active management exposes investors to beta, which is defined as portfolio volatility relative to the market, and to alpha, the value added by the portfolio manager’s luck or skill. Sharpe (1991) observes that the market as a whole is made up of all market participants, and therefore the average return of all participants equals the return of market, before fees and costs. After fees and costs, however, the average return of all market participants is below market return. Consequently, to beat the market consistently, investors need to have special skills. Interestingly, if one asks market participants what active return they expect to earn, 90 percent of them say they expect an excess return of 1–1.5 percent. Obviously, this contradicts conventional wisdom.
A good starting point for the analysis of active management concepts is the Evans–Archer diagram depicted below. As portfolios become more diversified portfolio risk declines until it asymptotically reaches a level that is known as undiversifiable, systematic or market risk. Portfolios are usually managed against fully diversified benchmark indices that are designed to reflect market performance and market risk as good as possible. In other words, the performance of broadly diversified benchmark indices repre- sents the reward to market risk.
The component above the horizontal line in Figure 2.2 is usually known as idiosyncratic, unsystematic or diversifiable risk. In this context we use
Figure 2.2 Evans–Archer diagram of risk versus diversification
Source: Union Investment Diversification
Risk
Market risk Active risk
the term active risk because it is the risk of an active manager who deviates from the benchmark in order to beat the market. Establishing the right portfolio structure requires skill or the portfolio will underperform the benchmark. Active risk therefore means accepting a certain amount of idiosyncratic risk over and above market risk in order to add value through active management. However, as idiosyncratic risk is diversifiable, it is usually not rewarded, except from luck. Consequently the unconditional expected return of taking on active risk is zero. If a portfolio manager has special skill in active management, his conditional expected return, how- ever, is proportional to skill and hence positive.
Grinold (1989) introduced an interesting concept that relates the excess return generated by the portfolio manager to the risk he incurs relative to the benchmark. In this framework the manager’s opportunities can be described by the ex ante information ratio IR, defined as the ratio of expected active return divided by active risk, that is
,
where RAdenotes active return and Adenotes active risk. If the benchmark is the riskfree rate, the ratio is identical to the Sharpe ratio. The original form of the “Fundamental Law of Active Management” suggests that
Consequently, the information ratio depends on the information coefficient IC and the number of independent decisions in the actively managed portfolio.
The information coefficient IC is defined as the correlation of the forecasts with the actual outcomes. Combining both formulas, the fundamental law reads
The expected active return consequently depends on skill, breadth and the amount of risk that is taken by the portfolio manager. Grinold (1989) and Thomas (2000) highlight the approximate nature of the fundamental law and recommend its use as a strategic tool. The lesson from the fundamental law is that the value added by active management is determined by the quality of the decisions of the portfolio manager as well as the diversifica- tion of investment ideas. The law therefore encourages managers to exploit independent sources of information whenever available. Whereas very focused strategies often are easy to explain they may lead to a high volatil- ity of excess returns. Diversifying not only with respect to asset classes or sectors, but also with regard to risk factors and sources of information is likely to produce consistently favorable risk/return profiles, especially over the medium to longer term.
E(RA) ⫽ IC兹NA. IR ⫽ IC兹N.
IR ⫽ E(RA)
A
Assuming that a portfolio manager acts in a way that is mean-variance efficient the value added, VA, is proportional to the information ratio squared. Expressed in terms of skill and breadth the portfolio manager’s ability to add value is
where Rrepresents the level of risk aversion. Consequently, to double his information ratio or the value added for a given level of active risk, the portfolio manager must double his skill, or quadruple the number of inde- pendent bets in the portfolio. Figures 2.3 and 2.4 illustrate this relationship.
The more independent decisions are made the lower is the skill required to achieve a target information ratio. If the number of independent trade ideas is very low, for instance because the portfolio manager chooses to imple- ment only strategic duration bets, a high level of skill is required to generate a favorable risk-adjusted return. Clarke, de Silva and Thorley (2002) point out that portfolio managers often face constraints that reduce the degree to which trade signals are transferred into active weights. Typical constraints for real-money investors would include “no short sales” and maximum leverage restrictions. In practice, the observed transfer coefficients lie between 0.3 and 0.8. If the transfer coefficient is 0.5 only 25 percent of the variation in realized excess return, that is, tracking error, is attributable to
VA ⫽ IC2·N 4R
,
Figure 2.3 Skill required to achieve a certain information ratio depends on the frequency of the implementation of independent trades
Source: J.P. Morgan 0
10 20 30 40 50 60 70 80 90 100
0 0.2 0.4 0.6 0.8 1 1.2 1.4 1.6 1.8 2
Information ratio
Skill (%)
Annual Quarterly
Monthly Biweekly Weekly Daily
the success of the signal. The remaining 75 percent are due to constraint- induced noise. The success rates, or skill levels, that are required to achieve a certain information ratio is therefore the higher, the more restrictions exist. Managers with substantial constraints will experience frequent periods where the investment ideas are successful, but performance is poor.
Conversely, there will also be periods when performance is good although the quality of return forecasts is poor. Portfolio managers who may only take long positions, for example, government bond managers who are allowed to diversify into corporate bonds temporarily, face a particularly disadvantageous situation, because the number of potential trades is limited. Thus, the required success rate is significantly higher than the one of an investor with an aggregate benchmark who is able to benefit from overweight as well as underweight positions.
In practice, it often proves difficult to assign an accurate level of skill to a certain portfolio manager as well as to estimate correctly the number of independent trade ideas. Nevertheless, before launching a major research project, improving the technical infrastructure or optimizing internal processes to increase skill, a quick calculation of this sort may be valuable, considering the costs and the uncertainty of success related to these measures. From a cost and a portfolio management perspective, broadening the spectrum of investment ideas is often more promising.
Traditionally, credit investors have primarily diversified investments within an asset class. The fundamental law of active management suggests
Figure 2.4 A given information ratio is achieved by various combinations of skill and breadth
Source: J.P. Morgan –5
5 15 25 35 45 55 65 75
0 10 20 30 40 50
Number of independent trades
Skill (%)
IR = 0.75 IR = 0.5 IR = 0.25
that this is not enough. Trade ideas on the issuer level should be comple- mented by sector and, if permitted, asset allocation bets. Diversifying into risky asset classes like high yield, for example, may not necessarily increase portfolio volatility if correlations with the core portfolio are low enough. In addition, active management of duration, yield and credit curve position- ing and currency risk can add value. Finally, a combination of various sources of information helps to generate a variety of independent trade ideas. Remember that the frequency of deviating from the benchmark has substantial impact on the expected information ratio and excess return.
2.3 QUANTITATIVE ANALYSES
The bear market for credit between 1997 and mid-2002 has put a new focus on valuing corporate credit. The debt-financed equity bull market of the sec- ond half of the 1990s was accompanied by historically high default rates and investigations of the management and reporting of corporate balance sheets.
Obviously the standard approach of using rating agency credit ratings to gauge credit risk is no longer sufficient. As a consequence, quantitative approaches have recently gained popularity, particularly structural models based on equity-market inputs. Quantitative models can be used as a tool to provide warning signals or to determine whether the spread on a corporate bond adequately compensates the investor for the risk. Due to the current low-yield/low-return environment the number of investors interested in credit products has grown worldwide. Credit models like KMV or CreditGrades have been developed to meet the growing investor demand.
These enhancements of the Merton model are able to incorporate company- specific details and can include subjective credit analyst views. With respect to the rapidly expanding credit derivatives market, quantitative models pro- vide critical inputs for valuation and hedging. Default correlation, a major driver for the valuation of credit portfolio products, can be modeled in both structural and reduced form models. Finally, quantitative credit models have become indispensable tools for the risk management of financial insti- tutions. Although various quantitative models are used by credit investors, two approaches for modeling default have gained widespread acceptance:
structural models and reduced-form models. Both of these methods provide estimates of default probabilities or fair market spreads.
The traditional fundamental approach and structural models generally are based on the same set of balance sheet inputs. But while the fundamen- tal approach used by most credit analysts requires thorough company and industry knowledge and is therefore rather costly and time-consuming, equity-based models are an efficient means to screen broad universes of credit issuers. However, structural models allow to incorporate credit analysts’ forecasts to take account of qualitative information that is not yet
reflected in the balance sheet. Projections can be used to create more realistic estimates of the default threshold or to generate different scenarios with respect to future liabilities.
2.3.1 Structural models
In the structural approach, assets and liabilities of a company are modeled simultaneously. Thus, structural models are based on fundamental com- pany data, focusing on its balance sheet and asset value. Default occurs when the value of the firm’s assets falls below its liabilities. Consequently, the required inputs comprise the firm’s liabilities, usually taken from its balance sheet, market value of equity and (implied) equity volatility. Since equities are typically more liquid than corporate bonds, one may argue that equity prices tend to reflect the value of a company’s assets more accurately.
Using information from the equity markets allows fixed income instru- ments to be priced independently, without requiring credit spread informa- tion from related fixed income instruments. However, if equity prices become irrationally inflated or deflated, as we have experienced during the equity hype of the late 1990s, they may be misleading indicators of actual asset values. Generally it is assumed that one can reasonably infer asset val- ues from equity prices. An option pricing model is then used to derive the volatility of the firm’s assets. Although it is generally possible to model financial institutions in the structural framework they should be treated with caution, since it is difficult to assess their assets and liabilities.
Furthermore, since financial institutions are highly regulated, default may not occur even if the value of assets falls below the firm’s liabilities.
The Black–Scholes (1973) option pricing model and Merton’s work on the pricing of corporate debt (1974) lay the foundations for the structural model. Merton’s model establishes a relationship between the market value of a firm’s assets and the market value of its equity. Consider a firm whose operations are financed exclusively by a zero coupon bond maturing at timeTwith a face value of X, and equity. Denote the market value of the firm’s assets at time TbyV␣(T). Then the company pays off its liabilities in full, if the market value of its assets exceeds the face value of the zero coupon bond, that is V␣(T)ⱖX. In this case, the shareholder’s value is
Table 2.1 Stylized balance sheet
Assets Liabilities
Assets Debt
Equity Source:Union Investment
V␣(T)⫺X. Conversely, if the value of the firm’s assets is lower than the face value of debt, V␣(T)⬍X, the company cannot repay its liabilities in full and defaults. The creditors take over the firm and the equity becomes worthless.
Figure 2.5 shows the pay-off profiles for debt- and equity holders at maturity of the liabilities.
Thus, the zero coupon bond is equivalent to a long position in a risk-free zero coupon bond and a short put on the assets of the company. Similarly, equity may be considered as a call option on the assets of the firm. The strike price of both options equals the face value of debt. Using the Black–Scholes option pricing model we are able to derive the market value and the volatility of the firm’s assets. According to Black–Scholes the mar- ket value of equity, V, and the market value of assets are related by
V⫽V␣N(d1)⫹e⫺rTXN(d2) with
and
d2⫽d1⫺␣兹T,
d1 ⫽ ln (V␣/X) ⫹ (r ⫹ (␣2/2))T
␣兹T
Figure 2.5 Pay-off patterns for debt- and equity holders at maturity of the liabilities
Source: Union Investment
Face value of debt (X) Asset value of the company X
Pay-off level
Equity holder
Debt holder
where ␣ denotes asset volatility, r is the risk-free rate, and N is the normal distribution. For equity volatility the condition
holds. Simple balance sheet theory suggests that V␣⫽D⫹V, where Drep- resents the market value of debt. Consequently, if asset value is known, the market value of debt can be inferred easily. Since the face value of debt and its maturity are known, too, we can now determine the yield of the zero coupon bond and its spread over the risk-free rate. However, it should be noted that the original Merton model tends to underestimate short-term spreads because of the assumption that asset value follows a continuous lognormal process. Using this assumption the probability of falling below the default threshold in a short period of time is usually very low.
Therefore, commercial models make adjustments in order to model short- term spreads more accurately.
To estimate the probability that the market value of assets will be lower than the face value of debt, we need to make an assumption about the behavior of the firm’s asset value. Black and Scholes posit that the market value of the firm’s asset follows a stochastic process:
dV␣⫽V␣dt⫹␣V␣dZ,
where denotes the drift of the market value of assets, and dzrepresents a Wiener process. Using to denote the random component of the firm’s return at time twe obtain
The probability of default is then described by the expression
where
ln (V␣/Xt) ⫹ ( ⫺ (␣2/2))t
␣兹t
⫽ P冤⫺ ln (V␣/Xt) ⫹␣兹(t⫺ (␣2/2))tⱖ冥,
P冤lnV␣ ⫹ 冢 ⫺ 2␣2冣t ⫹ ␣兹tⱕlnXt冥
lnV␣t ⫽ lnV␣ ⫹ 冢 ⫺ 2␣2冣t ⫹ ␣兹t.
⫽ V␣
VN(d1)␣