You blinked: The role and incentives of managers in increasing corporate risks following the inception of credit default swap trade
Hyun A Honga, Ji Woo Ryoub, Anup Srivastavac
aUniversity of California, Riverside, School of Business Administration
bUniversity of Texas Rio Grande Valley, College of Business and Entrepreneurship
cDartmouth College, Tuck School of Business
Abstract: Prior studies show that a lender’s incentive to monitor a client’s activities declines after receiving insurance on its loan via a credit default swap (CDS). We examine whether this altered debtor-creditor relation affects borrowers’ investment activities. We hypothesize that the borrower enhances activities that were previously constrained by lender monitoring. It shifts from safe to risky assets to increase the value of call options built into shareholder investments. We do not find support, on average, for this proposition. However, when managers’ wealth increases convexly with firm assets, borrowers increase risky investments and dividend payouts after the onset of CDS trading.
JEL classification: G32, G33; M41; M48
Keywords: Credit default swap (CDS); Agency conflict; Managerial compensation; Operating risks; Investment policy; Bankruptcy
---
We thank Joshua Anderson, Patricia O’Brien, Francois Brochet, Donal Byard, Aloke Ghosh, Charles Lee, Jon Lewellen, Dongyoung Lee, Ed Li, Lynn Li, Darrough Masako, Krishnagopal Menon, Monica Neamtiu, Eddie Riedel, Senyo Tse, and the seminar participants at Boston University, City University of New Yok (Baruch College), and Telfer Annual Conference on Accounting and Finance for their useful comments.
1 1. Introduction
A credit default swap (CDS), a relatively recent financial innovation, pays its owner the
face value of debt in the event of a borrower default. Since 1994, CDSs have grown into a
multi-trillion-dollar industry (ISDA, 2013), but “there is a dearth of serious empirical studies” on the implications of CDSs (Stulz, 2010, p. 18). Hu and Black (2008) and Bolton and Oehmke (2011)
theorize that after obtaining insurance for its asset upon the inception of CDS trade (hereafter, CDS inception), an “empty” lender continues to possess all the legal rights of a lender but has little skin
left in the game. It could refuse debt workouts, making a distressed borrower more vulnerable to
bankruptcy (Subrahmanyam, Tang, and Wang, 2014; Danis, 2016). It also begins shirking its monitoring responsibility over the borrower’s activities (Martin and Roychowdhury, 2015;
Amiram, Beaver, Landsman, and Zhao, 2016). While the evidence of reduced lender monitoring
upon CDS inception is uncontroversial, the literature leaves an important issue unaddressed: how
borrowers’ real activities change in response to the altered debtor-creditor relation post–CDS inception?1 Also to be considered are the alternative mechanisms by which CDS inception leads
to higher bankruptcy risk other than lenders’ increased intransigence (Augustin, Subrahmanyam, Tang, and Wang, 2014). We investigate these issues and examine changes in borrowers’ investment policies following CDS inception.
We hypothesize that the borrower, upon observing the onset of CDS trading and subsequent weakening of the lender’s vigilance and monitoring, substitutes its safe assets with
more volatile ones to increase the value of call options built into shareholder investments
(Campello and Matta, 2012). We do not find, on average, results to support this hypothesis
2
arguably because borrowers pursue more conservative policies facing more credible threat of
foreclosure from empty lenders (Subrahmanyam, Tang, and Wang, 2017) or because the
undiversified managers are reluctant to increase firm-specific risks (Lambert, Larcker, and
Verrecchia, 1991). However, the value and the convexity of managerial compensation increase
post–CDS inception. The resulting high convexity is associated with excessive dividend payouts as well as increases in operating and bankruptcy risks. As such, our study provides evidence of changes in borrowers’ real activities post–CDS inception, if they are consistent with managers’
incentives. We respond to Stulz (2010) and Augustin, Subrahmanyam, Tang, and Wang (2014), who call for more thorough examination of changes in borrowers’ real activities as well as holistic investigation of changes in borrowers’ stakeholders’ interests upon CDS inception.
Asset volatility increases the value of a firm’s equity because shareholders capture all of the upside in firm value beyond the face value of debt. When the volatility value dominates the
in-the-money value of call options, a volatility-enhancing project might benefit shareholders even
when it has a negative net present value. Lenders, however, could lose from increased asset
volatility because shareholders bear no obligation to pay the difference when a firm’s value falls below the face value of debt. To prevent such wealth transfer to shareholders, lenders attempt to constrain borrowers’ risky activities through covenants and active monitoring (Fama and Miller,
1972; Jensen and Meckling, 1976; Smith and Warner, 1979).
Lender monitoring and covenant enforcement, however, are costly activities (Holmstrom
and Tirole, 1997; Sufi, 2007; Arentsen, Mauer, Rosenlund, Zhang, and Zhao, 2015). Having
hedged its credit exposure upon CDS inception, a lender does not derive the same benefits from
those activities as before (Morrison 2005; Arentsen et al. 2015). At the margin then, the lender can
the event of a covenant violation (Chakraborty, Chava, and Ganduri, 2015). Expecting reduced
monitoring from the lead bank, the loan syndicate banks demand higher loan spreads (Amiram,
Beaver, Landsman, and Zhao, 2016), and borrowers reduce accounting conservatism in their
financial reporting (Martin and Roychowdhury, 2015). In addition, the lender’s asset is now assigned the risk of the CDS guarantor instead of that of the borrower (Basel II, page 49, Article
141). The resultant change of the counterparty risk from borrower to CDS writer reduces the lender’s regulatory capital requirement, allowing it to expand its loan portfolio (Shan, Tang, and
Yan, 2014). Such a portfolio expansion would further reduce lenders’ monitoring effort per client. A borrower would detect the weakening of the lender’s vigilance and monitoring upon the onset of CDS trading (Martin and Roychowdhury, 2015). The borrower could then substitutes its
safe assets with more volatile ones to increase the value of call options built into shareholder
investments (Campello and Matta, 2012). We test this hypothesis by examining post–CDS changes in research and development (R&D) outlays and expenditures on property, plant, and equipment,
the proxies for risky and safe investments, respectively (Kothari, Laguerre, and Leone, 2002; Shi,
2003; Coles, Daniel, and Naveen, 2006).2 We also examine the frequency of mergers and
acquisitions (M&A). They are an ideal setting for our analysis because they are among the largest
firm investments and can intensify lender-shareholder conflicts. In addition, we examine excessive
dividend payouts. They are arguably the most direct way to transfer wealth from lenders to
shareholders (Kalay, 1982; Handjinicolaou and Kalay, 1984; Ahmed, Billings, Morton, and
Stanford-Harris, 2002). These changes in borrowers’ investment and financing policies could
enrich shareholders at the expense of lenders, but they are constrained by lenders’ monitoring and covenants (Smith and Warner, 1979; Nash, Netter, and Poulsen, 2003; Bratton, 2006; Acharya and
Subramanian, 2009; Brockman and Unlu, 2009; Nini, Smith, and Sufi, 2009).
We study changes in operating and financing policies for 546 firms whose CDSs started
trading during the period 1992 to 2014. We, however, do not find evidence of asset substitution or
increases in dividend payouts, on average, after CDS inception. A theoretical framework by
Arping (2014) on the consequences of CDS inception could explain our null results. After
diversifying its credit risk against the borrower, an empty lender could let renegotiations with the
distressed borrower fail and force it into bankruptcy. Faced with a more credible threat of
foreclosure, the borrower can avoid actions detrimental to the lender’s interests. For example, the borrower would pursue more conservative dividend policies to preserve cash, anticipating
inflexible lender (Subrahmanyam et al. 2017). Yet, this theory does not consider managers’ incentives.
Another possible explanation for our null results is that the interests of risk-averse
managers are largely aligned with those of lenders as far as the effects of asset volatility and
dividend payouts are concerned. Unlike shareholders, undiversified managers shun firm-specific
risks (Coles, Daniel, and Naveen, 2006). For example, managers reduce the perceived value of
stock and option holdings in their own firm when asset volatility increases (Lambert, Larcker, and
Verrecchia, 1991; Carpenter, 2000). Furthermore, corporate default caused by volatile assets
impose a range of costs on managers; for example, the likelihood of forced termination and the
loss of labor market capital as well as the value of firm-specific investments (Eckbo, Thorburn,
shareholders by increasing asset volatility or dividend payouts, even after the lender reduces
monitoring, because those actions hurt their own interests.
We consider whether shareholders offer altered compensation arrangements to managers
to overcome their risk aversion and capitalize on the opportunity offered by reduced lender monitoring. We examine the vega measure of managerial compensation that increases managers’
wealth with stock volatility and is consistent with the call options feature built into shareholders’ equity investments (Guay, 1999; Core and Guay, 2002). We find an economically significant
increase in vega post–CDS inception (39% of its mean value). Total compensation increases in a statistically significant, but not economically significant, manner (1% of its mean value),
indicating that the most significant change occurs in the structure as opposed to the total value of
managerial compensation.[Increase in total compensation, on the one hand, makes managers more
risk averse by magnifying their exposure to their firm’s risk and, on the other hand, can encourage managers to take risks (Knopf, Nam, and Thornton, 2002; John and John, 1993; Armstrong and
Vashishtha, 2012).]
We find that managers’ incentives play a pivotal role in the occurrence or prevention of asset substitution post–CDS inception. The greater the managerial vega, the higher the increases in R&D outlays and the larger the decreases in property, plant, and equipment expenditures. This
finding suggests that managers with convex incentives treat the reduced vigilance from lenders as
an opportunity to shift from routine and safe capital investments (property, plant, and equipment
expenditures) to risky investments (R&D outlays). Similar to investment choices, firms with
higher managerial vega undertake more frequent mergers and acquisitions after CDS inception.
Shift of firm resources from relatively safe to risky investment avenues should increase earnings
vega following CDS inception. As such, we provide an alternative mechanism for the increased
bankruptcy risk following the onset of CDS trading (Subrahmanyam, Tang, and Wang, 2014). In
addition, for firms with managerial compensation aligned with shareholder interests, we find
increases in excessive dividend payouts, which could enrich shareholders at the sacrifice of
lenders’ security.
To address the potential endogeneity problems related to CDS inception, particularly the
omitted factors that determine the demand and supply of CDS contracts (Ashcraft and Santos,
2009), we examine the difference in differences before and after CDS inception relative to
non-CDS firms (Subrahmanyam, Tang, and Wang, 2014). We use a propensity score matching
approach to pair a control group of non-CDS firms with CDS firms in the year before CDS trade
inception (Ashcraft and Santos, 2009; Martin and Roychowdhury, 2015). This
difference-in-differences research design helps to isolate the impact of CDS inception relative to other
contemporaneous macroeconomic changes. In addition, we use a Heckman two-stage procedure
to control for selection bias (Martin and Roychowdhury, 2015). Similar results show that our
original findings are less likely to be subject to endogeneity issues. To improve our identification
of reduced lender monitoring, we isolate banks that are likely to have hedged their exposure upon
CDS inception (Minton, Stulz, and Williamson, 2009). Our results are either stronger or hold only
for the subsample of borrowers associated with such lenders.
We make two contributions to the literature. First, by showing changes in borrowers’ real activities following the CDS inception, we add to the vast literature that examines changes in lenders’ behavior, borrowers’ accounting policies and cash holdings, and the borrower’s and its
find that borrowers with high managerial vega undertake more aggressive investment policies. Our
results show that shareholders do not always lose upon CDS inception, because of, as indicated in
prior studies, increased threat of foreclosure. Shareholders could benefit from the increased value
of call option built into their investments, when managers enhance activities that were previously
constrained by lender monitoring. Results indicate that shareholders offer or managers demand
changes in executive compensation contracts upon CDS inception, which enhance managers’ risk appetite. Hence, our study presents a fuller picture of shifts in the rival lender, shareholder, and
managerial forces that determine firms’ investment and financing policies post–CDS inception. As such, we respond to the Augustin, Subrahmanyam, Tang, and Wang (2014) call for a thorough
examination of changes in corporate policy and stakeholder interests upon CDS inception. Second,
we provide an alternative explanation for the higher bankruptcy risk following CDS trade besides
just lender intransigence. The initiation of CDS trading on a firm’s outstanding debt could be followed by substitution of firm assets from safe to risky ones when managers have high vega
incentives. The resultant increase in operating volatility also increases the bankruptcy risk.
Similar to extant empirical papers on the topic of CDS inception, our paper takes a partial
equilibrium approach. We focus on changes in borrower behavior because of reduced lender
monitoring upon CDS inception. A general equilibrium study, beyond the scope of one empirical
paper, could determine how CDS inception results in wealth transfer among the involved parties
by examining the following conjectures. CDS sellers, who lack any contractual right over the
borrower, should price protect themselves in expectation of reduced lender monitoring. Lenders
should then pay a higher price to CDS sellers for their own reduced monitoring. However, lenders
derive other benefits from the purchase of CDS insurance, that is, reduced monitoring costs and
a banking relation with the original borrower. A borrower’s shareholders could trade off the increased value of their call options with the increased cost of bankruptcy risk. Finally, managers
balance between enhancing their undiversified risks and the additional vega benefits.
The rest of the paper proceeds as follows. Section 2 summarizes the literature and presents
the hypotheses. Section 3 describes the sample selection and the measurement of the variables.
Section 4 describes the tests of the hypotheses and Section 5 presents robustness tests. Section 6
presents concluding remarks.
2. Literature review and motivation of hypothesis.
The creation of CDS contracts is credited to J.P. Morgan, which sold the credit risk of
Exxon Mobil in 1994 (Tett, 2009). Initially, CDS contracts were used to hedge the credit risk of
bank loans. After the International Swaps and Derivatives Association (ISDA) standardized CDS
contracts, other participants such as asset managers entered the CDS market. The notional amount
of outstanding CDS contracts peaked at $62.2 trillion by the end of 2007. After the financial crisis
of 2008–2009, the notional amount declined, but it remains at the double-digit trillion-dollar level. Third parties typically initiate CDS trades. Yet the creation of an active CDS market for a company’s debt offers the lender an opportunity to change its counterparty risk to the one based
on a more creditworthy CDS writer, which could significantly alter the debtor-creditor relation.
Buying CDS protection, partially or fully, separates the creditor’s control rights from its cash flow rights (Hu and Black, 2008; Bolton and Oehmke, 2011). An empty lender is then less likely to continuously monitor clients’ activities to protect the value of its claim (Morrison, 2005; Ashcraft
and Santos, 2009; Subrahmanyam, Tang, and Wang, 2014; Martin and Roychowdhury, 2015).3
Furthermore, it would have a reduced interest in the continuation of the debtor, would be less
flexible in negotiations upon any credit event, and could push the debtor into inefficient bankruptcy
or liquidation. Consistent with this idea, Subrahmanyam, Tang, and Wang (2014) find increases
in bankruptcy risk with CDS trade inception and Li and Tang (2016) find more conservative
policies pursued by supply chain partners. Other benefits accrue to the lender upon hedging its risk
after CDS inception. Its regulatory capital requirements are relaxed, allowing it to extend more
debt to other clients (Shan, Tang, and Yan 2014).
Another possible reason for the increased bankruptcy risk upon CDS inception
(Subrahmanyam, Tang, and Wang 2014) besides lender inflexibility is that lenders continue to
bear monitoring responsibilities but do not retain the same incentives to ensure a timely repayment
of loans. Thus, they can reduce their costly monitoring and vigilance efforts because these efforts
provide no additional returns. Furthermore, such efforts would be spread over a larger number of
clients, given that lenders can expand their loan portfolios. This diluted vigilance on the part of
lenders is likely to permit clients to alter operating strategies that were previously constrained by lenders’ monitoring (Campello and Matta, 2012). The equilibrium between rival lender and
shareholder forces that determined the borrower’s operating policies could shift toward shareholder interests.
In general, the value of residual claim holders can be viewed as a European call option on the firm’s assets with the face value of debt being the strike price. Shareholders keep all of the
upside in firm value beyond the face value of debt, but, given their limited liability, do not have to
compensate lenders when the firm value declines below the face value of debt. Hence, asset volatility improves the value of equity, even if it leaves the expected value of the firm’s future
the volatility value dominates the in-the-money value of call options held by shareholders, a
volatility-enhancing project benefits shareholders even when it has a negative net present value.
However, increased volatility could adversely impact the value for creditors. For example,
creditors suffer large losses when the firm fails. Lenders, which stand to lose when a firm shifts
from safe to risky assets, attempt to prevent such action through covenants and active monitoring
(Fama and Miller, 1972; Jensen and Meckling, 1976; Smith and Warner, 1979). One implication
of the options pricing theory is that any managerial action that increases the volatility of firm value
enhances the value of the call option held by shareholders, yet decreases the value of fixed claims.
Consequently, lenders strive to prevent the substitution of safe firm assets with risky ones (Jensen
and Meckling, 1976). This leads to lender-shareholder conflict with regard to the preferred level
of operating risks. Any decline in lender monitoring could shift the equilibrium from
lender-shareholder forces toward lender-shareholder preference, that is, toward increased asset volatility
(Campello and Matta, 2012). Thus, we expect asset substitution upon CDS inception, all else held
equal. We test this proposition in H1.
H1. Firms shift a part of their safe assets to risky ones upon CDS inception.
H1 posits that firms shift their operating policy towards shareholder interest upon CDS
inception. Nevertheless, why managers would facilitate or implement such shifts when doing so
could hurt their personal interests is unclear. Unlike shareholders, which can easily diversify their
in their own firms’ stock prices.4 Therefore, unlike diversified investors, whose estimated option value increases with volatility, managers’ utility from holding in-the-money options can decline
with stock price volatility (Pratt, 1964; Arrow, 1965; Carpenter, 2000). Managers holding a large
amount of firm stock and in-the-money stock options can become highly risk averse (Lambert,
Larcker, and Verrecchia, 1991; Wiseman and Gomez-Mejia, 1998).
Unless managers hold compensation packages with convex payoffs, that is, unless their
wealth increases with asset volatility sufficient enough to make up for the nondiversifiability of
firm risks, they would be reluctant to increase firm risks (Berle and Means 1932; Jensen and Meckling 1976). Absent convex payoffs, they act in the lender’s interest in so far as the selection
of risky projects is concerned. However, shareholders could treat reduced lender monitoring, upon
CDS inception, as a unique opportunity to enhance their wealth at the expense of lenders. They
can change managerial incentives to bring managers on board. We thus expect shareholders to
offer higher vega to managers to incentivize them to increase asset volatility post–CDS inception (Gormley, Matsa, and Milbourn 2013). We also expect shareholders to offer higher compensation
to managers to benefit from asset volatility, but not too much to make them risk averse (Knopf,
Nam, and Thornton, 2002). Managers could also demand more risk-taking incentives to take
benefit from reduced lender monitoring. Our second hypothesis is stated as:
H2A. The total value and the vega of managerial compensation increase after CDS trade inception.
We also expect managers with the right compensation contracts (that is, greater amount
and convexity of executive compensation), irrespective of whether those incentives were reached
4
before or after CDS inception, to undertake risky investment projects and increase asset volatility,
shifting wealth from lenders to shareholders, when such opportunities arise from reduced lender
vigilance. Furthermore, because dividend payouts are the most direct way to transfer wealth from
creditors to shareholders, we expect firms with incentives aligned with shareholder interests to pay
excessive dividends. Our second hypothesis is formulated as:
H2B. Asset substitution and excessive dividend payouts upon CDS inception increase with managers’ vega and total compensation.
Increases in operating risks post–CDS inception, because of shifts in lender and shareholder forces, to the extent facilitated by managers’ vega incentives, should increase
bankruptcy risk by enhancing the high likelihood of both large payoffs and drastic failure. We thus
triangulate the ideas tested in H2A and H2B to provide an additional explanation for the increases
in bankruptcy risk post–CDS inception.
H3. Increases in bankruptcy risk after CDS trade inception are affected by managers’ incentives.
3. Sample selection and descriptive statistics
In this section, we describe the selection of sample and control firms and discuss their key
statistics.
3.1. Selection of CDS firms
We collect data from the Markit database, which covers CDS quotes of U.S. firms starting
in 2002. Markit verifies its CDS data through a multistage scrubbing procedure that includes
evaluating the legal relation between a reference entity and a reference obligation as well as
corporate actions, CDS succession events, and credit events. We gather data on chief executive
provides current and historical information on executive stock and option awards, pension plans,
and executive compensation, and it covers the top five executive officers of more than 3,300
companies from 1992 onward. We collect financial and stock price data from Compustat North
America and the Center for Research in Security Prices (CRSP), respectively. We merge the
Markit data with information from ExecuComp, Compustat North America, and CRSP using the
ticker and by cross-validating the match between these data sets based on company names. We
identify 546 U.S. firms that initiated trading on single-name CDS contracts during the sample
period from 1996 to 2014.
3.2. Selection of control firms
The onset of CDS trading is arguably not an exogenous occurrence. For example, factors such as firms’ credit risk and growth opportunities that affect the demand for and the supply of
CDS contracts (Ashcraft and Santos, 2009) could also affect managerial compensation. We follow
the extant literature to address this potential endogeneity issue. We employ a propensity score
matching approach (Ashcraft and Santos, 2009; Martin and Roychowdhury, 2015), which involves
identifying pairs of treatment and control firms based on similarity of observable firm
characteristics (Dehejia and Wahba, 2002). We implement this procedure by first estimating a logit
regression to model the probability of initiating CDS trading, using the samples of both treatment
and control firms. We estimate the following logistic model to predict the onset of CDS trading:
Prob(CDS_Firmi,t=1)= α + β1INV_GRADEi,t−1+ β2CREDIT_RATEi,t−1+ β3LEVi,t−1
+ β4PROFITMARGINi,t−1+ β5SIZEi,t−1+ β6STRETVOLi,t−1
+ β7MTBi,t−1+ ε, (1)
CREDIT_RATE, LEV, and PROFITMARGIN. INV_GRADE is an indicator variable equal to one
if a firm has an S&P credit rating above BB+ and zero otherwise. CREDIT_RATE is an indicator
variable that takes a value of one if a firm has an S&P credit rating and zero otherwise. LEV is
leverage, computed as the firm’s total debt divided by total assets. PROFITMARGIN is net income divided by sales. We also include firm size (SIZE), return volatility (STRETVOL), and
market-to-book ratio (MTB) to account for the effects of the overall information environment and growth
opportunities on the demand and supply of CDS contracts. SIZE is the natural logarithm of market
value of equity. STRETVOL is the standard deviation of monthly stock return within a fiscal year,
and MTB is the ratio of market value to book value of equity. The measurement of all variables is
described in Appendix A. The sample period spans 1992 to 2014, and it includes firms with and
without traded CDSs during this time. For firms with CDS contracts, only one year’s observation,
prior to the onset of CDS trading, is included in the sample.
Panel A of Appendix B reports the estimation results of the logit model (1). Consistent
with prior literature (Martin and Roychowdhury, 2015), the model reasonably predicts the onset
of CDS trading. The proportion of concordant pairs is over 90%, and the proportion of discordant
pair is less than 10%. Firms that are larger, have higher credit ratings, and have lower stock return
volatility are more likely to experience CDS trading. Consistent with Martin and Roychowdhury
(2015), these findings indicate an adverse selection view that, in general, banks (potential
protection buyers) have superior private information about the debt instruments they originate.
Consequently, sellers offer CDS contracts mainly on firms that are relatively less risky and have
more transparent information environments.
Having estimated parameters for Eq. (1), we then estimate the propensity score for each
non-CDS firm by year and the Campbell (1996) industry classification using the nearest neighbor
matching score. We use matching with replacement.5 Hence, the number of control firms is lower
than treatment firms.6 Panel B of Appendix B provides the standardized differences in the key
variables between CDS firms and non-CDS firms. The results show that the procedure is effective
in removing most of the differences between the two samples except for a few variables.
3.3. Sample distribution
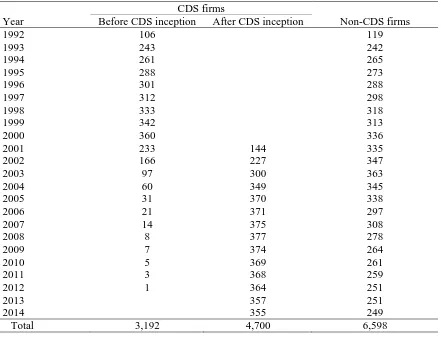
Table 1 presents the sample distribution by year for CDS firms prior to and after CDS
inception (pre–CDS and post–CDS contract subsamples). We also provide a yearly distribution of non-CDS firms that acts as a control sample for our tests. The number of observations for firms
subsequent to CDS inception and the number of non-CDS firms monotonically increase over the
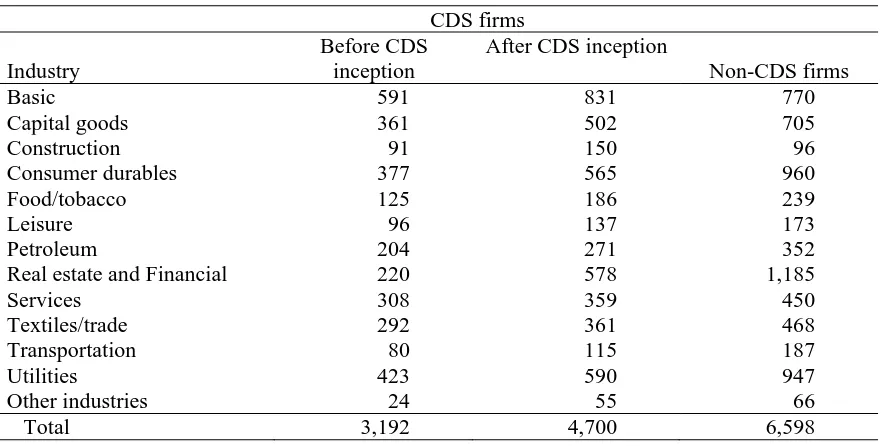
sample period. Table 2 reports the sample distribution by industry, which is based on the Campbell
(1987) industry classification. Our sample covers a range of industries, the most heavily
represented being Basic (17.68% for the post–CDS contract subsample and 18.52% for the pre– CDS contract subsample), followed by Utilities (12.55% for the post–CDS contract subsample and 13.25% for the pre–CDS contract subsample), and Consumer durables (12.02% for the post–CDS contract subsample and 11.81% for the pre–CDS contract subsample).
[Insert Tables 1 and 2 near here]
5 Compared with matching without replacement, matching with replacement decreases bias and circumvents the potential problem that the results are subject to the order in which the treatment units are matched (Dehejia and Wahba, 2002, p. 153). Dehejia and Wahba (2002, p. 154) contend that “[w]hen the treatment and comparison units are very different, finding a satisfactory match by matching without replacement can be very problematic. In particular, if there are only a handful of comparison units comparable to the treated units, then once these comparison units have been matched, the remaining treated units will have to be matched to comparison units that are very different. In such settings, matching with replacement is the natural choice.”
6
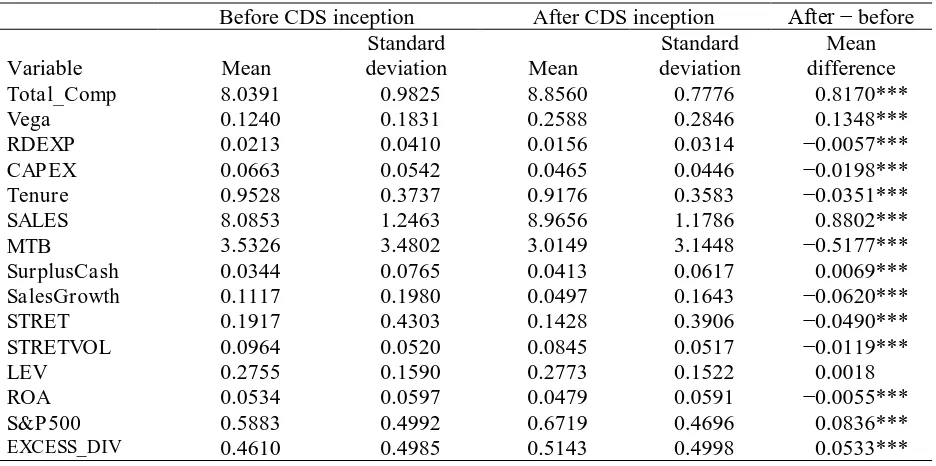
3.4. Descriptive statistics
Table 3 reports descriptive statistics of the variables used in our analyses separately for CDS
and non-CDS firms. Characteristics are presented separately for periods prior to and after the
initiation of CDS trading for the CDS firms. Corporate investments in both intangible (RDEXP)
and tangible (CAPEX) assets decrease following CDS inception. Hence, we do not find preliminary
support for H1 on a univariate basis. CEO total and excess compensation as well as vega
significantly increase after CDS inception, which is consistent with H2A. While sales revenue
increases, growth opportunities, stock return, and profitability decrease subsequent to CDS trading
initiation. These results are consistent with prior studies finding that CDS firms can experience
negative shock to their operational performance (Subrahmanyam, Tang, and Wang, 2014).
[Insert Table 3 near here]
4. Tests of hypotheses
This section presents the tests of hypotheses.
4.1. Tests of H1: substitution of safe with risky assets upon CDS inception
H1 states that firms shift a part of their safe assets to risky ones after CDS inception. We
estimate the following regression to test this hypothesis:
RDEXPi,t or CAPEXi,t=β0 + β1CDS_Tradei,t + β2CDS_Firmi + β3Tenurei,t
+β4Cash_Compi,t+β5MTBi,t+β6SALESi,t+β7SurplusCashi,t
+β8SalesGrowthi,t+β9STRETi,t+β10LEVi,t+εi,t, (2)
where the dependent variable is R&D expenditures (RDEXP) or capital expenditures (CAPEX).
RDEXP is set to zero when the value is missing from Compustat and both RDEXP and CAPEX are
divided by assets at the end of the fiscal year. Dummy variable CDS_Trade takes a value of one
of one for firms that have their CDSs traded during our study period. CDS-traded firms are
considered the treatment group after CDS inception.
Including both CDS_Trade and CDS_Firm provides a difference-in-differences research
design to isolate the impact of CDS inception relative to contemporaneous changes for non-CDS
firms. Hence, the variable CDS_Trade captures the marginal impact of CDS introduction on
corporate investments relative to the impact on non-CDS firms at the same time. If firms substitute
a part of their safe assets with risky ones following the onset of CDS trading (H1), then β1 would
be significantly positive when RDEXP is the dependent variable and significantly negative when
CAPEX is the dependent variable. To control for the determinants and managerial incentive of
investments, we include firm size (SALES) and financial leverage (LEV), as well as growth
opportunity (MTB), cash availability (SurplusCash), sales growth (SalesGrowth), and stock return
(STRET), following Coles, Daniel, and Naveen (2006). Also following Coles, Daniel, and Naveen
(2006), we use two proxies for CEO level of risk aversion: CEO tenure (Tenure) and salary plus
bonus (Cash_Comp). We control for year and industry idiosyncratic characteristics by including
their fixed effects in all regressions. Detailed variable definitions are provided in Appendix A.
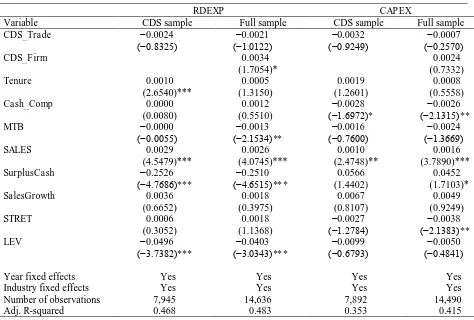
In Table 4, the first two columns report results of Eq. (2) with RDEXP as the dependent
variable; the last two columns, CAPEX as the dependent variable. The first and third columns use
only CDS firms, and the second and fourth columns include both CDS firms and non-CDS firms.
The coefficient on CDS_Trade is not significant in any test at a conventional level. Thus, we do
not find any significant change, on average, in either risky or safe assets upon CDS inception. H1,
which posits asset substitution upon CDS inception, is rejected. This null result can be consistent
with the empty creditor theory; that is, after diversifying its credit risk against the borrower, an
Faced with a more credible threat of foreclosure, the borrower might avoid actions detrimental to
the lender’s interests (Arping 2014). Another possible explanation is that the interests of risk-averse managers are largely aligned with those of lenders as far as the effects of asset volatility are
concerned. Managers thus are unlikely to support the opportunistic behavior of shareholders by
increasing asset volatility or dividend payouts, even when the lender reduces monitoring, because
those actions hurt their interests.
[Insert Table 4 near here]
4.2. Tests of H2A: changes in managerial compensation after CDS inception
We hypothesize that the onset of CDS trading reduces lender banks’ monitoring efforts,
thus enabling borrower firms to substitute safe assets with risky ones, thereby benefiting
shareholders. We also hypothesize that managers would facilitate such actions when they are
consistent with their personal interests. We examine whether shareholders offer or managers
demand higher vega and higher compensation to increase asset volatility post–CDS inception. We estimate the following regression to test H2A:
Total_Compi,t or Vegai,t
=β0+β1CDS_Tradei,t+β2CDS_Firmi+∑βnControlsi,t+εi,t, (3)
where the dependent variable is either total compensation (Total_Comp) or the sensitivity of
CEO’s compensation to stock price volatility(Vega).That is, Vega is the change in the dollar value of the CEO’s wealth for a 0.01 change in the standard deviation of stock returns per year. The vega measure is derived from the Black-Scholes option valuation model (e.g., Yermack, 1995; Hall and
Leibman, 1998; Aggarwal and Samwick, 1999; Guay, 1999; Cohen, Hall, and Viceira, 2000;
Datta, Iskandar-Datta, and Raman, 2001; Rajgopal and Shevlin, 2002; Core and Guay, 2002).
the value of restricted stock grants, the value of options granted during the year, and any other
annual pay for the CEO in the fiscal year. Of interest is the coefficient on CDS_Trade (β1). If
shareholders increase CEO total value or convexity of managerial compensation following the
onset of CDS trading, then β1is predicted to be positive and significant.
We also follow prior literature to employ a vector of control variables in Eq. (3) (Core,
Holthausen, and Lacker, 1999). To control a determinant and an incentive of CEO compensation,
we include firm size (SALES), firm reputation (S&P500), growth opportunity (MTB), stock return
(STRET), and profit ratio (ROA). We also use salary plus bonus (Cash_Comp) and CEO tenure
(Tenure) to control for CEO risk aversion. With Vega as the dependent variable, we follow
Richardson (2002) and Coles, Daniel, and Naveen (2006) to select control variables. We include
firm size (SALES), financial leverage (LEV), growth opportunity (MTB), and cash (CashSize), as
well as sales growth (SalesGrowth), CEO tenure, stock return (STRET), and stock return volatility
(STRETVOL), following Coles, Daniel, and Naveen (2006).
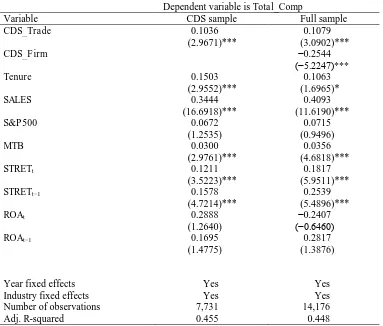
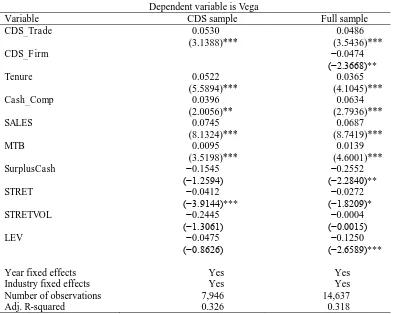
Panel A and Panel B of Table 5 present results with Total_Comp and Vegaas the dependent
variable, respectively. The coefficient on CDS_Trade is consistently positive and significant in all
models (p-value < 0.01), providing strong support for H2A that CDS inception is positively
associated with CEO vega and compensation. The economic significance of this increase is
estimated by dividing the regression coefficient by the mean value pre–CDS inception, which amounts to 39% for Vega but only 1.3% for Total_Comp. So, the principal change in managers’ compensation structure appears to be an increase in convexity, not the total value.
4.3. Test of H2B: substitution of assets and increases in excessive dividend payouts, conditional
on managerial compensation
In the following regression, we examine whether managers holding incentives consistent
with shareholder interests increase the asset volatility post–CDS inception (H2B): RDEXPi,t or CAPEXi,t=β0+β1CDS_Tradei,t
+β2(Vegai,tor Total_Compi,t)
+β3CDS_Tradei,t× (Vegai,t or Total_Compi,t)
+β4CDS_Firmi+∑βnControlsi,t+εi,t. (4)
In Eq. (4), the dependent variable is RDEXP or CAPEX. We use one of the two proxies of managers’ incentives in the model at a time (Total_Comp or Vega). The coefficient of interest is
on the interaction term CDS_Trade × (Vega or Total_Comp). If managers have the right incentives
to increase operating risk-taking following the onset of CDS trading, then β3 should be
significantly positive for RDEXP and significantly negative for CAPEX. We follow Coles, Daniel,
and Naveen (2006) in the selection of control variables.
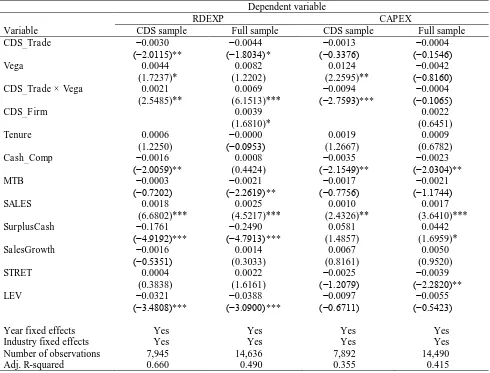
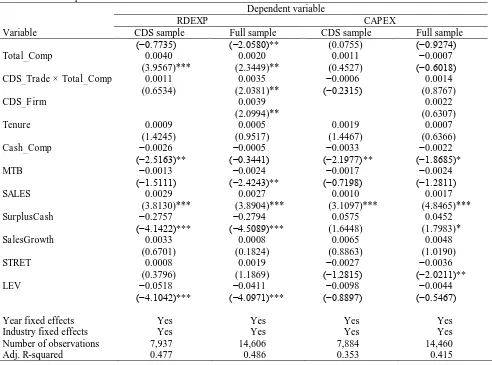
Results of Eq. (4) are reported in Panel A and Panel B of Table 6 for Vega and Total_Comp,
respectively. The first two columns in each panel report results with RDEXP as the dependent
variable; the last two columns, with CAPEX as the dependent variable. The coefficients on the
interaction term CDS_Trade × (Vega or Total_Comp)are consistently positive and significant with
RDEXP as the dependent variable and negative with CAPEX as the dependent variable in one
model. Results of the two panels support the hypothesis that when managers have high vega
incentives, they engage in asset substitution, reallocating firm resources from less risky capital
expenditures to more risky R&D. This resource reallocation is consistent with shareholder interests
significant with RDEXP as the dependent variable. It shows that, without taking the convexity into
account, borrowers follow more conservative investment policies anticipating more credible threat
of foreclosure (Arping 2014; Subrahmanyam, Tang, and Wang, 2017).
[Insert Table 6 near here]
Based on the coefficient estimates from the models in Table 6, Panel A, the effect of a one
standard deviation increase in vega is associated with a 3.48% increase in the mean value of R&D
expenditure. This effect of Vega on corporate investment policy subsequent to CDS trading
appears to be large and economically significant relative to that of total compensation.
4.4. Frequency of mergers and acquisitions after CDS inception, conditional on CEO incentives
We examine mergers and acquisitions as another proxy for firms’ risky investment policy,
which can shift corporate wealth from lenders to shareholders. As M&A activities can increase
asset volatility to the detriment of lender interests, debt covenants typically include constraints on
M&A activities (Nash, Netter, and Poulsen, 2003). We estimate the regression
MA_Freqi,t =β0+β1CDS_Tradei,t
+β2(Vegai,tor Total_Compi,t)
+β3CDS_Tradei,t× (Vegai,tor Total_Compi,t)
+β4CDS_Firmi+∑βnControlsi,t+εi,t, (5)
where the dependent variable, MA_Freq, is the number of M&A transactions conducted in a given
firm-year. We employ a negative binomial regression model because our dependent variable is
count data (Long 1997).7 We use the same set of control variables as in Eq. (4) and use one of the
two proxies for managers’ incentives (Vega or Total_Comp) in the model at a time. The coefficient
7
of interest is on the interaction term CDS_Trade × (Vega or Total_Comp). If managers have the
right incentives to undertake riskier investment activities following the onset of CDS trading, then β3should be significantly positive.
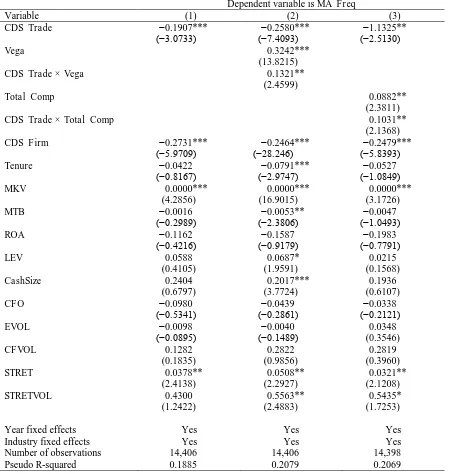
Table 7 shows that the coefficients on the interaction term CDS_Trade × Vega are positive
and significant (p-value < 0.05). Thus, borrowers engage in more frequent M&A transactions post– CDS inception when their managers have more convex compensation arrangements. As with
Equation (4) results, the coefficient on CDS_Trade is negative and significant. It is consistent with the idea that borrowers pursue more conservative investment policies post CDS inception, if managers’
vega incentives are not taken into account.
[Insert Table 7 near here]
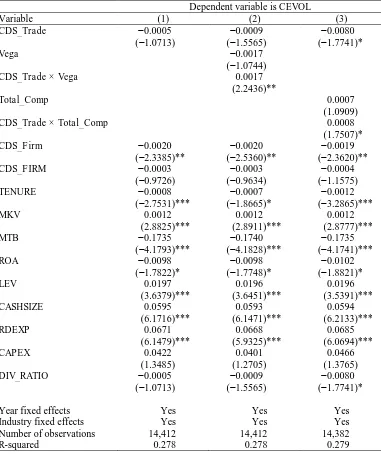
Changes in borrowers’ investment policies, described in Tables 6 and 7, should also cause an
increase in earnings volatility. We also examine the effect on earnings volatility by estimating the
regression
CEVOLi,t =β0+β1CDS_Tradei,t
+β2(Vegai,tor Total_Compi,t)
+β3CDS_Tradei,t× (Vegai,tor Total_Compi,t)
+β4CDS_Firmi+∑βnControlsi,t+εi,t, (6)
where the dependent variable, CVOL, is the standard deviation of a firm’s quarterly return on assets in a given year (Brown, Christensen, Elliott, and Mergenthaler, 2012; Choy, Lin, and Officer,
2014). Following Choi, Mao, and Upadhyay (2014), we use similar control variables as in Eqs. (4)
and (5). The coefficient of interest is on the interaction term CDS_Trade × (Vega or Total_Comp).
trading, then β3should be significantly positive. Table 8 presents results consistent with this idea.
CEVOL increases post–CDS inception for managers with highly convex payoffs.
[Insert Table 8 near here]
4.5. Excess dividends after CDS inception, conditional on CEO incentives
We examine corporate dividend payouts because shareholders can most directly transfer
wealth from creditors by paying themselves cash dividends. We calculate dividend payout ratio by
dividing common dividends by market value of equity (Grullon and Michaely, 2002). We then create
an indicator for firm-year observations in the highest quartile of dividend payouts for our sample
(EXCESS_DIV). This variable is effectively year- and industry-adjusted because we control for their
fixed effects. We then estimate the regression
EXCESS_DIVi,t =β0+β1CDS_Tradei,t
+β2(Vegai,tor Total_Compi,t)
+β3CDS_Tradei,t× (Vegai,tor Total_Compi,t)
+β4CDS_Firmi+∑βnControlsi,t+εi,t. (7)
As in earlier tests, we use one of the two proxies of managers’ incentives in the model at a time: Total_Comp or Vega. The coefficient of interest is the interaction term CDS_Trade × (Vega
or Total_Comp). If managers have incentives consistent with those of shareholders, they can pay
shareholders larger dividends following the onset of CDS trading. Table 9 reports results of this
analysis and shows that the coefficient on the interaction term is positive and significant (p-value <
0.10). Thus, borrowers appear to change their financing policy to benefit shareholders subsequent to
dividend payouts, if managers’ interests are not taken into account (Subrahmanyam, Tang, and Wang, 2017).
[Insert Table 9 near here]
4.6. Tests of H3: The joint effect of CDS inception and managerial interests on default risk
H2A and H2B tests indicate that when managers have convex payoffs, they substitute safe
assets with risky ones post–CDS inception. The resulting increase in operating risk should enhance the bankruptcy risk. We test in H3 whether CDS inception increases bankruptcy risk for firms with
managers holding high vega incentives. We estimate Bankruptcyi,t =
β0+β1CDS_Tradei,t+β2(Vegai,t or Total_Compi,t)
+β3CDS_Tradei,t×(Vegai,t or Total_Compi,t)+β4CDS_Firmi
+∑βnControlsi,t+εi,t, (8)
where Bankruptcy is an indicator variable that takes a value of one if a firm files for bankruptcy
in any of the five years after a give year t. As in earlier tests, our main interest is the coefficient
on the interaction term CDS_Trade × (Vega or Total_Comp), which we expect to be positive
based on H3. We follow Subrahmanyam, Tang, and Wang (2014) and include a vector of control
variables, which are known to affect corporate bankruptcy risk: firm size (MKV), debt size
(LNDEBT), stock return (STRET), stock return volatility (STRETVOL), and profitability (ROA).
The results are presented in Table 10. The coefficient on CDS_Trade is significant and
positive, showing that firms’ default risk increases subsequent to CDS trading. This finding is consistent with Subrahmanyam, Tang, and Wang (2014). More importantly, the coefficients on
0.05), providing strong support for the view that when managers have high vega incentives, the
onset of CDS trading is followed by managerial actions that increase the likelihood of corporate
default risk.
[Insert Table 10 near here]
Tables 6−10 show that borrowing firms shift their investment policies post–CDS inception
from safe to risky one when managers have high vega incentives. Furthermore, the onset of CDS
trading is followed by changes in managerial compensation structure toward higher vega
incentives. Results are consistent with the idea that shareholders capitalize on the opportunity
offered by reduced lender monitoring by changing the structure of managerial compensation
toward higher convex payoffs. Nevertheless, our findings also demonstrate that high vega
managers increase the bankruptcy risk following CDS inception (Subrahmanyam, Tang, and
Wang, 2014).
In sum, our study indicates that CDS inception is not always a value-decreasing proposition
for shareholders, as indicated in prior studies. For example, an increased threat of foreclosure on
account of lost lender interest (Subrahmanyam, Tang, and Wang, 2014). For firms with convex
managerial payoffs, shareholders could benefit because the firm enhances activities that were
previously constrained by lender monitoring. Furthermore, while managers could lose the value of
their firm-specific investments from the increased risk of bankruptcy, they could also benefit from
the increased value of their vega incentives. We thus present a fuller picture of shifts in the rival lender, shareholder, and managerial forces that determine firms’ investment and financing policies
5. Robustness checks
In this section, we examine whether our main findings are robust to alternative test
specifications.
5.1. Two-Stage Least Squares (2SLS) Specification
We use a 2SLS specification. In the first stage, we estimate a regression of a binary variable,
CDS_Trade, on all variables of the CDS determinant model specified in Eq. (1) and on control
variables in Eq. (2) and Eqs. (4)–(7). We also include two instrumental variables, Industry Peers’ Bond Trading Volume and Investment Grade/Speculative Grade. These instrumental variables
predict the initiation of CDS trading but are likely to be unrelated to the residuals in the
second-stage regression. The first proxies for the degree to which investors can hedge and speculate in the
bond market in the absence of the CDS market.8 Following prior studies, we compute this variable
by the average of the industry peers’ bond trading volume (Boehmer, Chava, and Tookes, 2015; Kim, Shroff, Vyas and Wittenberg-Moerman, 2016). Bond trading volume should reduce the
likelihood of CDS inception. Higher bond market liquidity alleviates trading friction, thereby
reducing the demand for CDS trades. We extract the bond trading volume for industry peers from
the TRACE database. We also collect the face value of the traded bonds on the issue date from the
Mergent database. We divide the dollar volume of a traded bond by its face value to estimate its
trading volume. We then compute the average bond trading volume of industry peers per year. We
convert this measure into a decile rank (Industry Peers’ Bond Trading Volume).
Our second instrumental variable, Investment Grade/Speculative Grade, is also a proxy for
the demand for CDS trade. Qiu and Yu (2012) demonstrate an inverse U-shaped relation between
CDS liquidity and credit rating. That is, bond investors’ hedging demand is the lowest for bonds at the extreme values of investment and speculative grades. Bonds with very high credit quality have
little hedging demand because of their high credit quality. For below-investment grade bonds, credit
protection is too costly. Our second instrumental variable is an indicator variable takes a value of
one if the credit rating of a firm’s bonds are close to the crossover from investment to speculative grades; that is, the bonds have an average credit rating of BBB–, BBB, or BBB+ (Investment Grade/Speculative Grade Frontier). We obtain corporate long-term bond credit ratings from
Compustat.
We present the results of the Probit model in Panel A of Table 11. We use CDS_Trade as the
dependent variable and Industry Peers’ Bond Trading Volume and Investment Grade/Speculative
Grade Frontier as inverse and direct proxies, respectively, for bond investors’ trading demand. As expected, the coefficients are significantly negative and positive, respectively.
[Insert Table 11 near here]
In the second stage, we use the predicted value of CDS_Trade from the first stage and
estimate a regression of Total_Comp and Vega on the fitted value of CDS_Trade along with all the
control variables specified in Eq. (2). The results are presented in Panels B and C of Table 11. Our
interest is the coefficient on CDS_Trade, which is positive and significant, indicating that the value
and the vega of management compensation increase following CDS inception, consistent with H2A.
We then estimate a regression of operating and financing policy (RDEXP, CAPEX, MA_Freq, and
EXCESS_DIV) and bankruptcy risk using the fitted value of CDS_Trade and its interaction with
Vega. Results for those tests are presented in Panels D–F of Table 12. The coefficient on the interaction term is positive for RDEXP, MA_Freq, EXCESS_DIV, and bankruptcy risk and negative
validate our choice of instrumental variables, we follow Larcker and Rusticus (2010) and
implement weak instrument identification tests.9 We evaluate the incremental explanatory power
of the instruments with a Partial F-Statistic test. The Partial F-Statistic test statistic is highly
significant in all panels (e.g., 718.95 with a p-value of <0.001 when we use Total_Comp as the
dependent variable and 341.80 with a p-value of <0.001 when we use Vega as the dependent
variable). These results suggest that the instrument passes the weak-instrument tests and that it
explains a significant amount of the variation in corporate risk taking behavior. The partial
pseudo-R2 of 15.38% in Panel A indicates a well-specified first-stage model.
5.2. Identifying lender banks that most likely used CDS contracts
CDS contracts are traded over the counter. Hence, banks that purchase credit insurance
cannot be easily identified. Martin and Roychowdhury (2015), however, propose that a bank likely purchased CDS protection against a borrower’s default risk if the bank was able to increase its
risk-based capital ratio increased in the same year in which the borrower’s CDS trading was initiated. This argument is based on the proposition that a bank can increases its risk-based capital ratio upon
hedging its credit risk. We expect banks that hedge their risks using the CDS market to become more
lax in their monitoring following CDS inception. Hence, we expect that the phenomena we show in
this paper are stronger for firms whose lender banks likely purchased CDS contracts.
9
For Panel B, the partial F is 718.95 (p-value < 0.0001), and the under-identification test (chi-squared) is 681.36 (p -value < 0.0001). For Panel C, thepartial Fis 341.80 (p-value < 0.0001), and the under-identification test (chi-squared) is 333.07 (p-value < 0.0001). For Panel D, the partial F is 352.25 and 99.41 (p-value < 0.0001), and the under-identification test (chi-squared) is 95.67 and 100.19 (p-value < 0.0001), when the dependent variables are RDEXP and
We identify lenders to CDS and non-CDS firms in our sample using the Dealscan database, and we obtain banks’ risk-based capital ratio from the Federal Reserve Y-9C reports. We divide the borrower sample into two groups: those with increases in their banks’ risk-based capital ratioand
those with decreases in the year of CDS inception. We then reestimate Eqs. (4)–(7) examining the joint effect of CDS inception and managerial incentives on operating and financing policies and on
bankruptcy risks.
Table 12 presents results of this analysis. The coefficients on the interaction term CDS_Trade
× Vega are significantly stronger for firms experiencing an increase in banks’ risk-based capital ratio for all dependent variables except CAPEX. For bankruptcy risk, the coefficient on the interaction term
is significant only for firms with an increase in banks’ risk-based capital ratio. Thus, the shifts in lender, shareholder, and managerial forces we find following the onset of CDS trading appear to be stronger
when borrowers hedge their client risks with traded CDSs and, hence, likely reduce their client
vigilance.
[Insert Table 12 here]
6. Conclusion
The onset of CDS trading on a firm’s outstanding debt provides the firm’s lender with an opportunity to hedge its credit risk. Prior studies show that once a lender obtains insurance on a risky asset, the empty lender reduces its monitoring effort over the borrower’s investment policy.
We hypothesize that in that case, the borrowing firm can change its financing and operating
policies in ways that benefit shareholders but were previously constrained by lender monitoring.
For example, the borrowing firm would substitute safe assets with volatile assets and increase
dividend payouts. We do not find results consistent with this proposition, on average. Yet, we find
find that when managers possess convex compensation structures, irrespective of whether the
convexity was achieved before or after CDS inception, borrowers alter the corporate investment
policies towards riskier assets.
We make two contributions to the literature. First, we extend the vast literature examining
changes in lender behavior upon CDS inception by highlighting the changes in borrowers’ real investments, an area that remains largely unexamined. We show that high managerial vega firms
pursue more aggressive investment policies, which is contrary to the idea proposed by Arping
(2014) and Subrahmanyam, Tang, and Wang (2017). Shareholders, thus, could benefit from the
increased value of their call options. CDS inception, therefore, is not always a value-decreasing
proposition for shareholders, as would be expected because of lender’s higher threat of foreclosure (Arping, 2014; Subrahmanyam, Tang, and Wang, 2014). Our findings also indicate that either
shareholders offer or managers demand changes in executive compensation contracts upon CDS
inception towards more convex payoffs. We thus present a fuller mosaic of post–CDS inception shifts in lender, shareholder, and managerial forces that determine a firm’s investment policies.
Second, we provide an additional explanation for the phenomenon identified by Subrahmanyam,
Tang, and Wang (2014). That is, the initiation of trading CDSs is followed by substitution of safe
assets with riskier ones for high managerial vega firms.
Our findings also show that managers moderate or exacerbate lender-shareholder agency
conflicts upon CDS inception depending on their incentives. Thus, our paper is related to the
literature examining how managerial compensation impacts corporate capital structure and
lender-shareholder conflicts. For example, Brockman, Martin, and Unlu (2010) find that lenders shift to
short-term debt to avoid the risk increasing efforts that come from high managerial vega. Berger,
Iskandar-Datta, and Raman (2005) find that managerial stock ownership increases lenders’ proclivity to provide longer maturity debt.
One caveat to our study is that CDS sellers lacking any contractual right over the borrower
would price protect themselves in expectation of reduced lender monitoring. Whether CDS sellers
price protect themselves or not, our study indicates a possibility of wealth transfer from lender or
CDS sellers to shareholders post–CDS inception. Nevertheless, shareholders could also lose wealth from increased bankruptcy risk because of higher asset volatility in conjunction with
increased lender intransigence. One way to ameliorate managers’ behavior could be a reduction in the convexity of managerial compensation, to counterbalance the reduction in lender monitoring.
For example, by increasing the debt-like components of managerial compensation that pay only if
the firm remains solvent (Edmans and Liu 2011). Similarly, pension and deferred compensation
References
Acharya, V. V., Amihud, Y., Litov, L., 2011. Creditor rights and corporate risk taking. Journal of Financial Economics 102 (1), 150–166.
Acharya, V. V., Subramanian, K. V., 2009. Bankruptcy codes and innovation. Review of Financial Studies 22, 4949–4988.
Aggarwal, R., Samwick, A., 1999. The other side of the trade-off: the impact of risk on executive compensation. Journal of Political Economy 107: 65–105.
Ahmed, A. S., Billings, B. K., Morton, R. M., Stanford-Harris, M., 2002. The role of accounting conservatism in mitigating bondholder-shareholder conflicts over dividend policy and in reducing debt costs. Accounting Review 77 (4), 867–890.
Amiram, D., Beaver, W., Landsman, W., Zhao, J., 2016. The effects of CDS trading on information asymmetry in syndicated loans. Journal of Financial Economics, forthcoming.
Arentsen, E., Mauer, D. C., Rosenlund, B., Zhang, H., Zhao, F., 2015. Subprime mortgage defaults and credit default swaps. Journal of Finance 70, 689–731.
Armstrong, C. S., Vashishtha, R., 2012. Executive stock options, differential risk-taking incentives, and firm value. Journal of Financial Economics 104 (1), 70–88.
Arping, S., 2014. Credit protection and lending relationships. Journal of Financial Stability 10, 7– 19.
Arrow, K. J., 1965. Aspects of the Theory of Risk Bearing. Academic Bookstores, Helsinki, Finland.
Ashcraft, A. B., Santos, J. A., 2009. Has the CDS market lowered the cost of corporate debt? Journal of Monetary Economics 56 (4), 514–523.
Augustin, P., Subrahmanyam, M. G., Tang, D. Y., Wang, S. Q., 2014. Credit default swaps—A survey. Foundations and Trends in Finance, 9 (1–2), 1–196.
Berger, P. G., Ofek, E., Yermack, D. L., 1997. Managerial entrenchment and capital structure. Journal of Finance 52, 1411–1438.
Berle, A. A., Means, G. C., 1932. The Modern Corporation and Private Property. World Inc., New York.
Bettis, J., Bizjak, J. M., Kalpathy, S. L., 2015. Why do insiders hedge their ownership and options? An empirical examination. Financial Management 44 (3), 655–683.
Boehmer, E., Chava, S., Tookes, H.E., 2015. Related Securities and Equity Market Quality: The Case of CDS. Journal of Financial & Quantitative Analysis. 50(3), 509–541.
Bolton, P., Oehmke, M., 2011. Credit default swaps and the empty creditor problem. Review of Financial Studies 24 (8), 2617–2655.
Bratton, W. W., 2006. Hedge funds and governance targets. Georgetown Law Journal 95, 1375– 1431.
Brockman, P., Martin, X., Unlu, E., 2010. Executive compensation and the maturity structure of corporate debt. Journal of Finance 65, 1123–1161.
Brockman, P., Unlu, E., 2009. Dividend policy, creditor rights, and the agency costs of debt. Journal of Financial Economics 92 (2), 276–299.
Brown, N. C., Christensen, T. E., Elliott, W. B., Mergenthaler, R. D., 2012. Investor sentiment and pro forma earnings disclosures. Journal of Accounting Research 50 (1), 1–40.
Campbell, J. Y., 1996. Understanding risk and return. Journal of Political Economy 104 (2), 298– 345.
Campello, M., and R. Matta., 2012 Credit default swaps and risk-shifting. Economics Letters 117(3):639–641.
Carpenter, J., 2000. Does option compensation increase managerial risk appetite? Journal of Finance 55, 2311–2331.
Chakraborty, I., Chava, S., Ganduri, R., 2015. Credit default swaps and moral hazard in bank lending. Unpublished working paper. University of Miami and Georgia Institute of Technology, Coral Gables, FL, and Atlanta, GA.
Choi, J. J., Mao, C. X., Upadhyay, A. D., 2014. Earnings management and derivative hedging with fair valuation: evidence from the effects of FAS 133. Accounting Review 90 (4), 1437– 1467.
Choy, H., Lin, J., Officer, M. S., 2014. Does freezing a defined benefit pension plan affect firm risk? Journal of Accounting and Economics 57 (1), 1–21.
Cohen, J., 1988. Statistical Power Analysis for the Behavioral Sciences, Second Edition. Lawrence Erlbaum Associates Publishers, Hillsdale, NJ.
Cohen, R. B., Hall, B. J., Viceira, L. M., 2000. Do executive stock options encourage risk taking? Unpublished working paper. Harvard University, Cambridge, MA.
Coles, J. L., Daniel, N. D., Naveen, L., 2006. Managerial incentives and risk taking. Journal of Financial Economics 79 (2), 431–468.
Core, J., Guay, W., 2002. Estimating the value of employee stock option portfolios and their sensitivities to price and volatility. Journal of Accounting Research 40, 613–630.
Core, J. E., Holthausen, R. W., Larcker, D. F., 1999. Corporate governance, chief executive officer compensation, and firm performance. Journal of Financial Economics 51 (3), 371–406. Danis, A., 2016. Do empty creditors matter? Evidence from distressed exchange offers.
Management Science, forthcoming.
Datta, S., Iskandar-Datta, M., Raman, K., 2001. Executive compensation and corporate acquisition decisions. Journal of Finance 56 (6), 2299–2336.
Datta, S., Iskandar-Datta, M., Raman, K., 2005. Managerial stock ownership and the maturity structure of corporate debt. Journal of Finance 60, 2333–2350.
Dehejia, R. H., Wahba, S., 2002. Propensity score matching methods for nonexperimental causal studies. Review of Economics and Statistics 84 (1), 151–161.
Eckbo, B. E., Thorburn, K. S., Wang, W., 2016. How costly is corporate bankruptcy for the CEO? Journal of Financial Economics 121 (1), 210–229.
Edmans, A., Liu, Q., 2011. Inside debt. Review of Finance 15 (1), 75–102.
Fama, E. F., Miller, M. H., 1972. Theory of Finance. Holt, Rinehart, and Winston, New York. Gormley, T. A., Matsa, D. A., Milbourn, T., 2013. CEO compensation and corporate risk: evidence
from a natural experiment. Journal of Accounting and Economics 56 (2), 79–101.
Graham, J. R., Li, S., Qiu, J., 2008. Corporate misreporting and bank loan contracting. Journal of Financial Economics 89 (1), 44–61.
Grullon, G., Michaely, R., 2002. Dividends, share repurchases, and the substitution hypothesis. Journal of Finance 57 (4), 1649–1684.
Guay, W., 1999. The sensitivity of CEO wealth to equity risk: an analysis of the magnitude and determinants. Journal of Financial Economics 53, 43–71.