It not only prepares me for the topic of my future work, but also gives me an introduction to the laboratory atmosphere in which I will work. Initially, this project got off to a rough start due to late start and general lack of availability. direction was particle packing; we had to try to define a simple method to accurately analyze the behavior of the flow. Flow behavior refers to the interaction of particles with each other and any contact surface.
Good-flowing materials, often referred to as free-flowing materials, can pack more efficiently because the particles can easily rearrange without sticking to the other particles in the material. The complexity is partly due to the large number of materials and processes in the ceramics industry. This is further complicated by the lack of universal measurement capability and the large number of factors that affect particle flow and packing.
Overall, there is still much research to be done in the areas of flow and particle packing to better understand what happens and how to process the materials. Our thesis incorporates this idea, as we assume that there is a critical mass of particles, or a minimum mass of particles required for free flow. In addition, we had less resources available; we no longer had easy access to the library and laboratory.
It is unclear whether there is a specific limit below which particle leakage will not occur.
Introduction
Literature Review
- Particle Systems
- Angle of Repose
- Powder Flow Measurement
- Uniform Die Fill
- Agglomeration
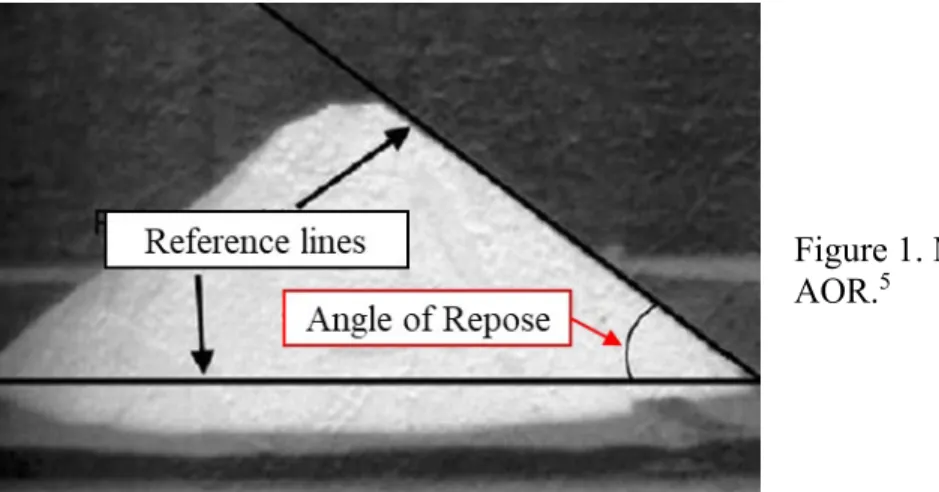
In a larger, typically well-flowing powder, the angle of repose is smaller because the forces of gravity are dominant, pulling the particles closer to the surface and thus lowering the AOR.1 The AOR is suggested to be related to several factors, including sliding and rolling friction, density of the particles, particle size and shape.6 An increase in the sliding and rolling friction coefficients and increasing irregularity in shape,. In contrast, the AOR decreases with increasing particle size and container thickness.7,6 The AOR increases only slightly as the density of the particle increases, therefore the AOR is not sensitive to density.6 It is generally agreed that the AOR is related to particle flow, but there are a variety of different methods of measuring it, each leading to slightly varying results. As previously mentioned, there are a variety of tests that can be used to measure the angle of repose, resulting in differences regarding ranges for fluidity and AOR values. and >55° sluggish or very high cohesion and very limited fluidity.
1994) were more inclined to use the 40° criterion based on the data of Brown and Richards (1970) in classifying loose and cohesive powders.8 Furthermore, there is a lack of standardization regarding test methods such as amount of material, type and size equipment. Current density (tap ρ) refers to the density of the material after it has been tapped for a certain period of time, and bulk ρ is the bulk density. On the other hand, in the case of loose dust, where the interactions between the particles are greater, the difference between the determined bulk density and the discharged density would be greater, and the Carr index would be greater, between 26-31.9.
Therefore, this suggests that an increase in particle size always decreases the cohesiveness of a powder. 5, 8. In a pressing operation, the powder is pushed into the cover and then the material is compacted. Uniform compaction behavior in dry pressing requires uniform cover filling.10 Loose powders are typically deposited at approximately 30% of their theoretical density, which is not sufficient to achieve a fully dense ceramic part.10 The flow is extremely important for uniform cover filling.
Factors affecting die filling include the cohesion and angle of internal friction of the material, the coefficient of friction between the powder and the hopper, and particle size.11 Powder cohesion is related to the intensity of interparticle forces, including van der Waals forces. It is based on the Jenike classification, where the material is characterized using the ffc ratio between the consolidation stress (σ1) and the unconfined yield strength (σc). In addition, size segregation should be avoided; is the most influential factor affecting mass uniformity.13 This results in the concentration of large particles in the.
There is also evidence to suggest that the smaller, less than 30 microns and more cohesive the material is, the less likely it is to segregate.13 Ideally, size segregation should be avoided to ensure the most uniform mold filling and consequently a tight and functional product.11 This can be achieved by limiting the number of processing steps after mixing, reducing the difference in particle sizes, reducing all particles to below 30 microns.13. An agglomerate is defined as "a group of particles that are weakly bound together, can behave as a fragile, larger pseudoparticle.2" In general, there are two different types of agglomerates, soft and hard agglomerates. This is due to the large size difference between the non-agglomerated and agglomerated powder, which prevents effective particle rearrangement and therefore prevents uniform packing and density.
Experimental Approach
Powder Flow
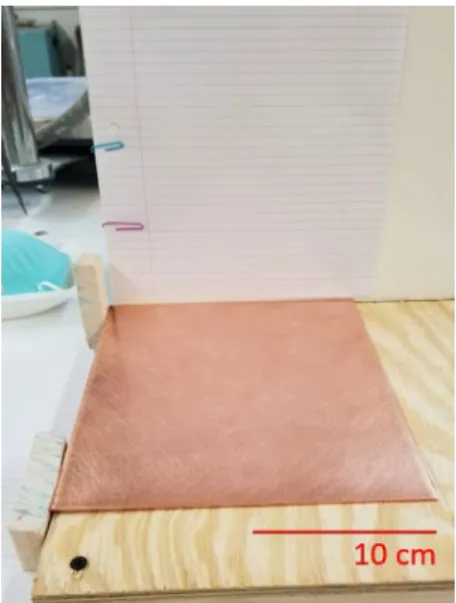
Copper was the desired surface because it does not retain a static charge between the particles and the surface. During grinding, special attention was paid to the plate to ensure uniform abrasion of the copper surface. We placed the copper plate in the corner of the wood shown in Figures 2 and 3 and repeated this before each test to ensure accuracy and repeatability.
A piece of paper is placed on the whiteboard background, perpendicular to the orientation of the. The location of the powder did not matter experimentally, since the entire plate is always subject to the same angle. Once the powder was placed on the plate, the plate was tilted until there was movement in the powder.
After the locations for the first and critical dust streams were marked on the paper, the operator measured from the edge of the paper to the marks and wrote the length, denoted as 𝑙𝑙. The plate angle was calculated using Equation 3, where 𝑙𝑙 is the distance on the carrier material from the far left side to the inclined point of the copper plate and W is the width of the plate, which is always 20.32 cm (8 inches). ).
SEM Imaging
Results and Discussion
Calculations
As a way to normalize the data, the slope angle and particle size results were used to calculate an angular velocity. To calculate angular velocity, the linear velocity is first calculated (equation 5) and that value is used to calculate the angular velocity (equation 6). The variable d was used as the distance the powder tumbled down the plate, which was assumed to be 7.62 cm (3 inches) for all powders.
Powder Flow
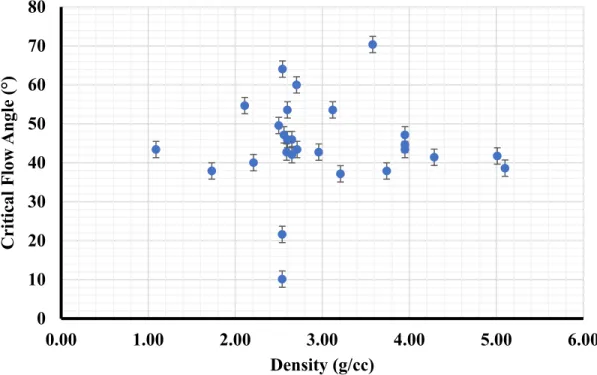
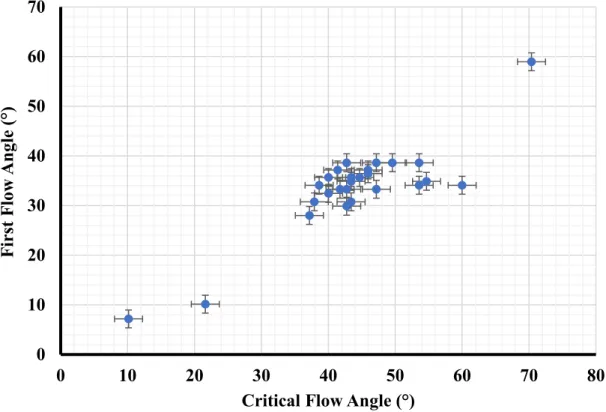
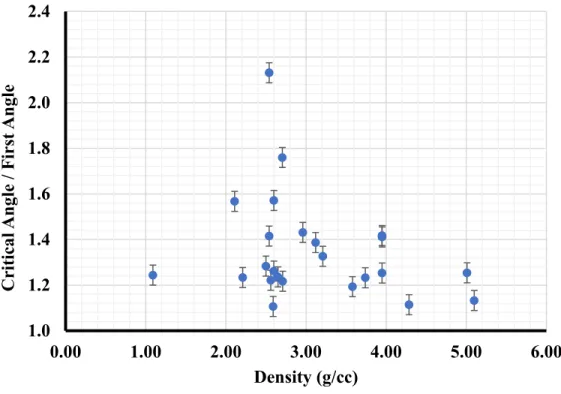
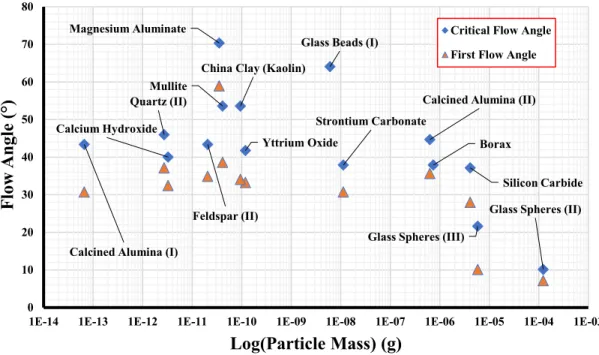
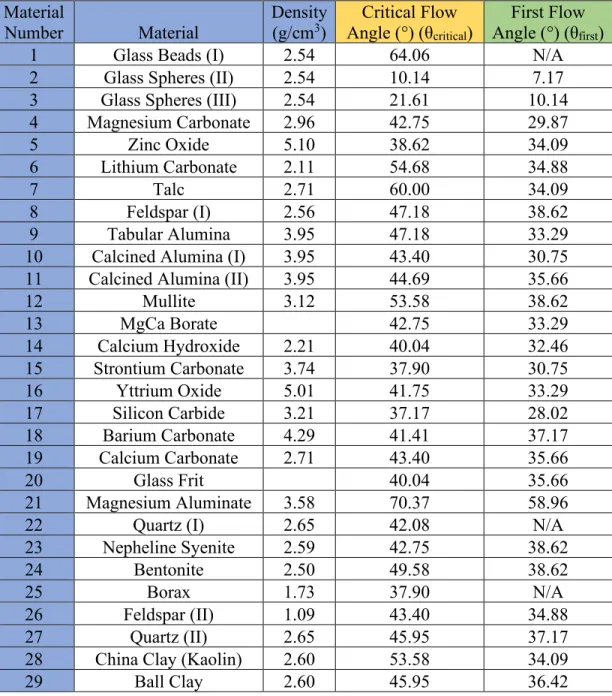
It can then be concluded that the hypothesis that the density is directly related to the dust flux is incorrect. There is a trend in this relationship indicating that if a powder has a high critical flow angle, then that powder will usually be observed to have a relatively high first flow angle. The next figure, Figure 8, shows the relationship between the ratio of the critical flow angle and the first flow angle (𝐶𝐶𝑝𝑝𝑝𝑝𝑡𝑡𝑝𝑝𝑝𝑝𝑡𝑡𝑏 𝐹𝐹 𝐴𝐴𝑙𝑙𝑎𝑎𝑏𝑏𝑝𝑝 . 𝐹𝐹🝑 𝐴𝐴𝑙𝑙𝑎𝑎𝑏𝑏𝑝𝑝𝑝 ), and the particle density.
The information in Figure 9 shows the calculated line for particle-free flow, which is the red dashed line. This line was chosen as it runs straight through the three glass sphere samples used in this experiment, which are shown depicted in Figures 11, 12 and 13. The glass spheres are considered perfect particles for fluidity, and the line is the separator between liquid and non- liquid powders.
The flowing powders are to the right of the line and the non-flowing powders can be found on the left. Rather than coming up with a critical particle size necessary for particle-free flow, an equation that changes with size. This is important as the less massive particles correlate with a higher angular velocity which means they must flow at higher angles compared to the more massive particles.
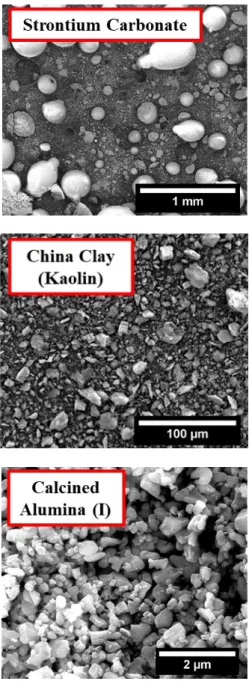
Images of particles
Grolleg or porcelain clay and strontium carbonate have slightly smaller particles and sit in the middle of the graph. Calcined alumina (II) or A-16 is at the other end of the graph, with a small particle size below 1 μm. The size effects demonstrated in Figure 9 are evident with A-10 and A-16, where they have drastically different sizes and thus sit at opposite ends of the plot.
Figures and 23 demonstrate the differences between critical and first flow samples of kaolin and quartz (II), respectively. The first flow samples were thought to be mainly agglomerates and larger particles, which is supported by the visible material. Although the literature indicates that particle agglomeration is an important consideration, this study concludes that it is negligible and can be ignored.1 The data in this study does not take agglomeration into account.
However, if aggregation is to be accounted for, the resulting change in mass is negligible on a log scale. The data support the conclusion that flow is independent of density.6 This is evident in Figure 9, where the two calcined aluminum samples lie on opposite sides of the plot despite having the same density. Changes in density result in small changes on a log scale, thus indicating that the flow is independent of density.
A dominant factor in size segregation is the difference in size of the particles. Therefore, size segregation can be reduced or prevented by reducing the size of the particles.13 In Figure 9 the opposite. One of the many experiments that Galileo is famous for is his falling bodies experiment.
Conclusion
The goal of this future work is to better delineate a minimum size for free flow and further understand the relationship between flow behavior and size. This current study proves that size is an important factor in flow. Therefore, it would be interesting to investigate the flow behavior of a material made artificially.