PRACTICUM WORKSHEET
SATUAN OPERASI TEKNIK LINGKUNGAN
Isoremoval Graph Analysis on Sedimentation Process
Arranged by :
NAME : SHINTA NUR IHSANI STUDENT’S ID : 225100907111039 GROUP : ME5
ASSISTANT :
Muhammad Zidan Ghifari Kana Nawafila Eiski Ishma Yusrina Nur Hanifah Michael Teudas Tertius Tsania Naila Firdausi Shafa Ariza Agmi Putri Raullyno Ghozali Ilham Mellysa Machfiro Zhafran Kamal Sultani Tjokorda Istri Mahagita Aura Dinar Ramadhani Ariya Ratana Teja Windy Trisnawati Dewi Sabina Fitri Enggal Alhamdra Andika S
WATER QUALITY AND WASTE MANAGEMENT LABORATORY DEPARTMENT OF BIOSYSTEM ENGINEERING
FACULTY OF AGRICULTURAL TECHNOLOGY BRAWIJAYA UNIVERSITY
MALANG
2024
CHAPTER I INTRODUCTION
1.1 Background
Sedimentation is an essential process in water treatment and is majorly used in water treatment plants. Sedimentation is a vital step in water treatment that entails eliminating suspended solids from water by enabling them to settle naturally under the influence of gravity.
This process occurs in clarifiers or tanks where water flows slowly, allowing particles to settle at the bottom, producing a clear liquid and a concentrated sludge. The main purpose of sedimentation is to reduce water’s turbidity and solid particle concentration.
In a water treatment plant, sedimentation is performed in two steps, primary sedimentation and secondary sedimentation. Both have the same goal to reduce suspended particles in water but have different mechanisms and sedimentation removal rates. For comprehension analysis and understanding of sedimentation effectiveness, it is important to analyze factors that affect sedimentation such as suspended solid concentration, water’s movement velocity, and initial condition of water. To examine these factors settling velocity is being calculated. There is also isoremoval graphic of sedimentation that evaluates the effectiveness of a settling column in water treatment processes. The graph offers insight into how various settling depths and times impact turbidity removal efficiency, providing essential information for creating more efficient water treatment systems.
1.2 Objectives
a. Students can determine the amount of TSS solid allowance at certain time variations through an is removal graph.
b. Students can determine the factors that affect sedimentation
c. Students can determine the relationship of removal percentage to the time and speed of sedimentation, as well as the relationship of time to the speed of sedimentation
CHAPTER II LITERATURE REVIEW
2.1 Definition of Sedimentation in Water Treatment
Sedimentation is a vital step in water treatment that entails eliminating suspended solids from water by enabling them to settle naturally under the influence of gravity. This process occurs in clarifiers or tanks where water flows slowly, allowing particles to settle at the bottom, producing a clear liquid and a concentrated sludge. It is an efficient technique for separating organic and inorganic solids that are present in water or have been treated to form a settleable state through coagulation or precipitation. The main purpose of sedimentation is to reduce water’s turbidity and solid particle concentration. Sedimentation is critical in achieving the primary goal of wastewater treatment, specifically in reducing water turbidity and the total concentration of solids (Zabava et al., 2016).
In a water treatment plant, sedimentation is performed in two steps. The first settlement process is obtained in the preliminary process of water, where the sedimentation mechanism only relies on gravitational force to separate coarse solid that has a large density. Meanwhile, secondary sedimentation is performed to accomplish the coagulation-flocculation process. In this stage, the suspended solid removal rate is significant compared to the primary sedimentation, since this process also includes chemical reactions and physical movement of water to increase the sedimentation rate (Araujo, 2020).
2.2 Sedimentation Process in Water Treatment
Sedimentation is a physical process that utilizes gravitational forces to settle suspended particles in water. The sedimentation process is distinguished into 4 types process, such as discrete particle settling, flocculant settling, hindered settling, and compression setting.
However, based on the suspension characteristic, the sedimentation process is distinguished as primary and secondary sedimentation. Every type of sedimentation has the same main purpose in reducing total solid concentration in water, however, the significant difference in each sedimentation process is the removal rate of solid particles and particle size type that is likely to be removed from the process (Syahputra et al., 2022).
According to Araujo (2020), primary sedimentation is a type of preliminary treatment of water. In this process, the settlement process is mainly caused by the gravitational forces, which are effective for separating small particle that has a large density. Rather than focusing on removing heavy suspended solid particles, primary sedimentation that accomplishes a biological process of water treatment is used to remove grease contained in water. The primary sedimentation occurred in four functional compartments, such as inlet zone, settling zone, sludge zone, and outlet zone.
On the other hand, secondary sedimentation is more advanced compared with primary sedimentation. Secondary sedimentation is performed to accomplish the coagulation- flocculation process, where a suspended solid that can’t be settled in the previous sedimentation stage is reacted with a chemical agent to form flocs that are heavier and easier to settle. During the secondary sedimentation process, the flocs are kept to grow their size and weight as long as the velocity. Compared with the primary sedimentation process, this process can reduce the solid particle concentration significantly due to the influence of chemical factors (flocculant-coagulant) and the physical treatment of the mixing process required in coagulation-flocculation. Additionally, the biological following the secondary sedimentation is purposed to reduce organic materials and pathogen microorganisms (Araujo, 2020).
2.3 Settling Velocity and Influencing Factors
According to Priya et al. (2015), factors affecting the settling velocity include the concentration of suspended sediments (SSC), turbulence quantified by the root-mean-square
velocity gradient (G), and the vertical salinity gradient (s). The settling velocity (vt) is influenced by these factors in different ways. Suspended solid concentration is the main factor influencing the velocity factors, where the low concentration of suspended solid will result in a negative correlation with settling velocity and vice versa. According to the study, the correlation between settling velocity and suspended solid concentration is exponential. Secondly, the turbulence movement of water affects more collisions and floc formation, enhancing the settling velocity, when the rate of turbulent flow is not too high and breaks down the flocs instead. Meanwhile, an increase in the salinity gradient of water will reduce the velocity gradient due to increasing water density and viscosity, resulting in higher friction and resisting the settling flocs.
Hence, a mathematical approach is performed to obtain the settling velocity that happens in sedimentation based on the factors that influence it. Due the the weight of flocs that are denser than the water itself, the particle will have less buoyancy force and make it move to the bottom. Particle movement in still water will be slowed down by the drag force due to water viscosity until a state is reached where the drag force is equal to the effective weight of the particles in the water. After that, the particle movement will continue constantly and is called the terminal settling velocity. A conveyance settlement occurs when the effective weight of a particle in water equals the resistance force, therefore:
𝑉𝑡 = 𝑔
18𝜇(𝜌𝑠 − 𝜌𝑤)𝑑𝑝2 Where:
Vt : settlement velocity μ : water's viscosity ρs : density of particle ρw : density of water
dp : particle’s average diameter
According to the equation, settlement in the sedimentation process only occurs when the settlement velocity (Vt) of the particles is the same or exceeds the required Vt. Therefore, the sedimentation velocity of the particle is positively correlated with the flow rate of the inflow and negatively correlated with the surface area (Syahputra et al., 2022).
2.4 Isoremoval Graphic
Picture 2.1 Isoremoval Graphic Source: Darmayanti et al., 2023
The removal graph is a valuable tool for evaluating the effectiveness of a settling column in water treatment processes. It showcases the percentage of turbidity removed over time and depth in the column, facilitating the determination of the optimal surface loading rate (Vo) and
detention time (td) for designing sedimentation tanks. The graph offers insight into how various settling depths and times impact turbidity removal efficiency, providing essential information for creating more efficient water treatment systems (Darmayanti et al., 2023).
2.5 Application of Sedimentation in Water Treatment
The application of the sedimentation process in water treatment is mainly used in the coagulation-flocculation process. This process required a resting stage, where the water is moved slowly to let the flocs settle in the bottom surface of the flocculation-coagulation pool bed. This stage is crucial in primary treatment that determines the suspended solid removal rate of the process. Efficient treatment is determined with the most optimum removal rate with less requirement of cost. Hence, since sedimentation also requires free potential energy from gravitational force, the effectivity and the efficiency of the sedimentation process in primary treatment are major concerns in water treatment (Zabava et al., 2016).
The sedimentation process is also vulnerable to substance separation, such as grease and lipid substances from water. In water’s preliminary treatment, sedimentation accomplished by biological process Is effective in separating and reducing grease or lipids. During sedimentation, the scouring velocity is important to prevent the breakdown of settled particles and gives an additional force to separate particle contents in water to float or settle based on their gravitational weight (Araujo, 2020).
CHAPTER III METHODOLOGY
3.1 Tools and Materials with Functions Table 3.1 Tools and Materials with Function
No. Tools and Materials Functions
1. Casted Settling Basin Used as a place for the sedimentation process of wastewater sample
2. DR 900 Hach Colorimeter Used to measure TSS concentration of wastewater sample
3. Stirrer Used to homogenize wastewater samples for more even suspended solids contained in water
4. Beaker Glass Used as a container for wastewater sampling during the sedimentation process
5. Stopwatch Used to determine and count sedimentation time 6. Millimeter Block Used to make an isoremoval graph
7. Measuring Cylinder Glass Used to measure wastewater sample Source: Personal Documentation, 2024
3.2 Figures of Tools and Materials Table 3.2 Tools and Materials with Function
No. Tools and Materials Figures
1. Casted Settling Basin
Picture 3.1 Casted Settling Basin Source: Personal Documentation, 2024
2. DR 900 Hach Colorimeter
Picture 3.2 DR 900 Hatch Colorimeter Source: Personal Documentation, 2024
3. Stirrer
Picture 3.3 Stirrer
Source: Personal Documentation, 2024
4. Beaker Glass
Picture 3.4 Beaker Glass
Source: Personal Documentation, 2024
5. Stopwatch
Picture 3.5 Stopwatch
Source: Personal Documentation, 2024
6. Millimeter Block Paper
Picture 3.6 Millimeter Block Paper Source: Personal Documentation, 2024
7. Measuring Cylinder Glass
Picture 3.7 Measuring cylinder glass Source: Personal Documentation, 2024 Source: Personal Documentation, 2024
3.3 Working Procedure
Tools and materials are prepared
Homogenize the sample in a settling basin using a stirrer
Observe the settling column for 0, 10, 20, 30, and 40 minutes
Take 25 mL of sample in each depth (30 cm, 60 cm, 90 cm) every time the observed settling time is reached
Test the TSS levels in the sample water using the DR900
Record the results of the calculation of TSS levels read with DR900 then calculate the removal percentage
Create an isoremoval graph based on practicum data
Calculate the total particle removal (RT)
Calculate the sedimentation velocity
Make a relationship graph for TSS removal percentage to time, time to settling speed, and the removal percentage to settling speed
Result
CHAPTER IV RESULT AND DISCUSSION
4.1 Practicum Result Data
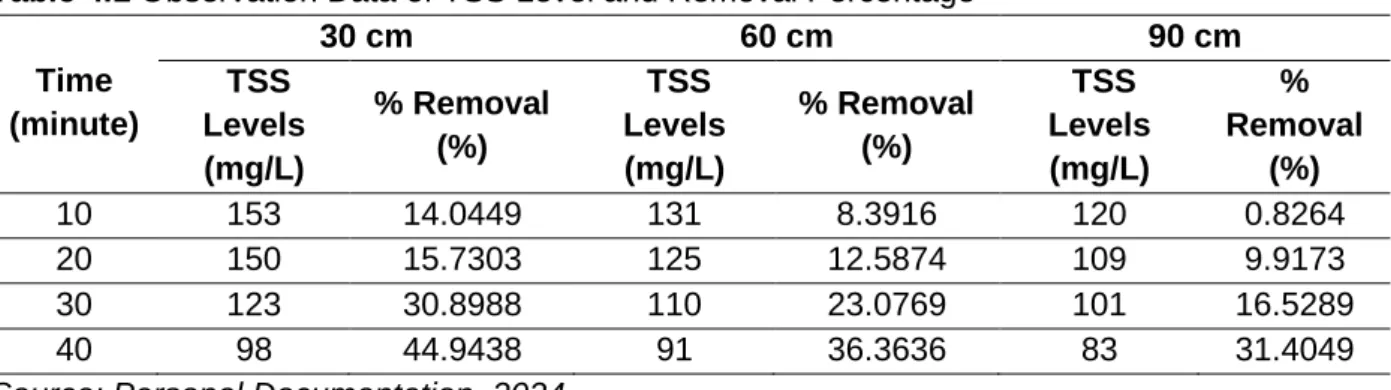
Table 4.1 Observation Data of TSS Level and Removal Percentage
Time (minute)
30 cm 60 cm 90 cm
TSS Levels (mg/L)
% Removal (%)
TSS Levels (mg/L)
% Removal (%)
TSS Levels (mg/L)
% Removal
(%)
10 153 14.0449 131 8.3916 120 0.8264
20 150 15.7303 125 12.5874 109 9.9173
30 123 30.8988 110 23.0769 101 16.5289
40 98 44.9438 91 36.3636 83 31.4049
Source: Personal Documentation, 2024
Table 4.2 Percentage Removal Observation Data from RT Equation No %Removal Time (minute) Total Removal (%)
1 4.5 15 15.429
2 14 27 23.3
3 25 37 31.875
Source: Personal Documentation, 2024
Table 4.3 Settling Speed Observation Data
Time (minute) Sedimentation Rate (m/s)
30 cm 60 cm 90 cm
0 0 0 0
10 0.0005 0.001 0.0015
20 0.00025 0.0003 0.00075
30 0.000167 0.000333 0.0005
40 0.000125 0.00025 0.000375
Source: Personal Documentation, 2024
4.2 Calculation Result Data a. Percent Removal (%)
a. 30 cm
• 10 minutes
%𝑟𝑒𝑚𝑜𝑣𝑎𝑙 =(153 − 150)
153 × 100% = 14.0449%
• 20 minutes
%𝑟𝑒𝑚𝑜𝑣𝑎𝑙 =(153−150)
153 × 100% = 15.7303%
• 30 minutes
%𝑟𝑒𝑚𝑜𝑣𝑎𝑙 =(153−123)
153 × 100% = 30.8987%
• 40 minutes
%𝑟𝑒𝑚𝑜𝑣𝑎𝑙 =(153−98)153 × 100% = 44.9438%
b. 60 cm
• 10 minutes
%𝑟𝑒𝑚𝑜𝑣𝑎𝑙 =(153−131)
153 × 100% = 8.3916%
• 20 minutes
%𝑟𝑒𝑚𝑜𝑣𝑎𝑙 =(153−125)
153 × 100% = 12.5874%
• 30 minutes
%𝑟𝑒𝑚𝑜𝑣𝑎𝑙 =(153−110)
153 × 100% = 23.0769%
• 40 minutes
%𝑟𝑒𝑚𝑜𝑣𝑎𝑙 =(153−91)
153 × 100% = 36.6363%
c. 90 cm
• 10 minutes
%𝑟𝑒𝑚𝑜𝑣𝑎𝑙 =(153−120)
153 × 100% = 0.8264%
• 20 minutes
%𝑟𝑒𝑚𝑜𝑣𝑎𝑙 =(153−109)153 × 100% = 9.9173%
• 30 minutes
%𝑟𝑒𝑚𝑜𝑣𝑎𝑙 =(153−101)
153 × 100% = 16.5289%
• 40 minutes
%𝑟𝑒𝑚𝑜𝑣𝑎𝑙 =(153−83)
153 × 100% = 31.4049%
b. Percentage Removal Based on RT Calculation
• R15
ℎ1 =120−422 + 42 = 81 ℎ2 =42−172 + 17 = 29.5 ℎ3 =29.5−142 + 14 = 21.75 𝑅𝑡 = 4.5 + ℎ1
120(14 − 4.5) + ℎ2
120(25 − 14) + ℎ3
120(35 − 25) = 15,429 %
• R27
ℎ3 =120−342 + 34 = 77 ℎ4 =77−232 = 27 𝑅𝑡 = 14 + ℎ1
120(25 − 14) + ℎ2
120(35 − 25) = 22.3 %
• R37
ℎ5 =120−45
2 + 45 = 82.5 𝑅𝑡 = 25 + ℎ1
120(35 − 25) = 31.875 %
c. Settling Speed a. 30 cm
• 10 minutes 𝑣 = 0.3
60×10= 0.0005 m/s
• 20 minutes 𝑣 = 0.3
60×20= 0.00025 m/s
• 30 minutes
𝑣 =60×300.3 = 0.000167 m/s
• 40 minutes 𝑣 = 0.3
60×40= 0.000125 m/s b. 60 cm
• 10 minutes 𝑣 = 0.6
60×10= 0.001 m/s
• 20 minutes 𝑣 = 0.6
60×20= 0.0003 m/s
• 30 minutes
𝑣 =60×300.6 = 0.000333 m/s
• 40 minutes 𝑣 = 0.6
60×40= 0.00025 m/s c. 30 cm
• 10 minutes 𝑣 = 0.9
60×10= 0.0015 m/s
• 20 minutes
𝑣 =60×200.9 = 0.00075 m/s
• 30 minutes 𝑣 = 0.9
60×30= 0.0005 m/s
• 40 minutes 𝑣 = 0.9
60×40= 0.000375 m/s
4.3 Data Analysis of Practicum Result
The practicum data revealed that the longer the detention time in sedimentation settling basins, the higher the TSS removal rate. This held for depths of 30 cm, 60 cm, and 90 cm.
After 40 minutes, the final TSS percentage removal rates for depths of 30 cm, 60 cm, and 90 cm were found to be 44.94%, 36.36%, and 31.404%, respectively, from their TSS initial concentrations. Additionally, it was noted that the TSS level and its removal percentage were higher in shallow depths of the settling basin, and vice versa for shallow depths. For example, the TSS removal percentage for 30 depths at 10 minutes, 20 minutes, 30 minutes, and 40 minutes detention time was found to be 14.044%, 15.73%, 30.9%, and 44.94%, respectively.
The TSS level measured at a height of 30 cm was found to be 153 mg/L, 150 mg/L, 123 mg/L, and 98 mg/L.
The sedimentation process demonstrated the effectiveness of the TSS removal rate with decreasing TSS concentration. Nevertheless, higher depth will result in lower TSS levels and TSS removal rates. For example, the TSS removal percentage at a height of 60 cm was 8.39%, 12.58%, 23.07%, and 36.36%, respectively, with the same detention time. The TSS level observed at a depth of 60 cm was 131 mg/L, 125 mg/L, 110 mg/L, and 91 mg/L. The same pattern emerged at a depth of 90 cm, where the average TSS concentration decreased as the depth increased.
The sedimentation rate or sedimentation velocity was also examined in this practicum.
An increase in the height of sedimentation will result in higher sedimentation velocity. On the other hand, an increase in the sedimentation time will result in a lower sedimentation rate. This correlation is related to the equation of velocity, where the value of it is positively correlated with the distance and vice versa with the time. The highest sedimentation rate of 0.0015 m/s occurred in 90 cm depth and 10-minute detention time. However, the lowest sedimentation rate of 0.000125 m/s occurred in 30 depth and 40 minutes of detention time.
Based on the isoremoval graphic of the practicum result, we can analyze the optimum sedimentation treatment. The experiment shows that as the detention time increases, the total removal of TSS concentration also increases. For instance, the total removal of TSS concentration is 15.4% in 10 minutes of detention time. However, it increases to 23.3% and 31.875% when the detention time increases to 27 minutes and 37 minutes respectively.
Additionally, we can see that the percent removal of TSS concentration in 10, 27, and 37 minutes of detention time is 15%, 23.3%, and 32% respectively.
4.4 Calculation Result Data
4.3.1 Removal Percentage Calculation from RT Equation
The removal percentage calculation in this practicum is based on the isoremoval graph of the sedimentation experiment. To determine the total removal percentage, it’s necessary to determine the removal percentage of the sedimentation process in the graph for each depth. The TSS percentage removal used in this practicum is 15%, 23.3%, and 32%. Then, the detention time is determined using the interpolation approach from the removal percentage point to the time axis. As a result, the detention time needed to approximately achieve the percentage removal of TSS is 10 minutes, 27 minutes, and 37 minutes. However, it is crucial to count the total removal percentage of TSS to determine the exact value of sedimentation efficiency using the RT equation as follows:
𝑅𝑡 = 𝑅2 +ℎ1
𝐻 (𝑅3 − 𝑅2) + ⋯ +ℎ𝑛
𝐻 (𝑅(𝑛 + 2) − 𝑅(𝑛 + 1)) where:
Rt : % total removal at the given time h1 : specific depth on the graph (m) H : overall basin depth (m)
The result shows that the addition of detention time will result in a total removal percentage increase, where the total removal result for 10, 27, and 37-minute detention time is 15.4%, 23.3%, and 31.875%.
4.3.2 Settling Velocity Measurement
The settling velocity measurement is determined with the ratio of depth (H) and detention time. The depth used in this practicum is 0.3 m, 0.6 m, and 0.9 m, whereas the detention time used is 10, 20, 30, and 40 minutes. To determine the settling velocity, both depth and detention time are converted into international units, meters, and seconds. Then the velocity settling is calculated based on this mathematical formula:
𝑉 =𝐻 𝑡 where:
H : depth (m)
t : detention time (s)
Various calculations were conducted for different depths and detention times. The results revealed that an increase in depth has a positive impact on the velocity value, whereas an increase in detention time leads to a decrease in velocity. The highest sedimentation rate of 0.0015 m/s was recorded at a depth of 90 cm with a detention time of 10 minutes.
On the other hand, the lowest sedimentation rate of 0.000125 m/s was recorded at a depth of 30 cm with a detention time of 40 minutes.
4.5 Time Relationship Analysis with TSS Removal Percentage
Picture 4.1 Relation of TSS Removal Percentage with Detention Time Source: Personal Documentation, 2024
The relationship graph between TSS removal percentage and detention time is depicted on Picture 4.1. TSS removal percentage has a positive correlation with detention time in sedimentation process, which is shown by the positive trend of the graphic lines. The sample taken from 30 cm, 60 cm, and 90 cm depth are showing a positive trendline, highlighting an obvious positive relation of TSS removal percentage with detention time. According to the graphic, the TSS removal percentage tends to be significant in the early process of sedimentation and as time passes, the removal rate will not be significant and increase in linear terms.
According to Huda (2019), detention time has a positive correlation with turbidity efficiency. Since TSS caused turbidity in water, the research is related to the findings in this
elationship between emoval ercentage and ime
practicum. Longer detention time will result in more opportunities for floc particles to settle.
Therefore, the efficiency rate of TSS removal will increase along with detention time. On the other hand, shorter detention times tend to have lower TSS removal efficiency percentages, because the flocs do have not enough time to settle, which consequently will result in higher turbidity levels compared to longer detention times.
4.6 Time Relationship Analysis with Settling Velocity
Picture 4.2 Relation of Sedimentation Velocity with Detention Time Source: Personal Documentation, 2024
The relationship between sedimentation velocity and detention time in the sedimentation process is depicted in Picture 4.2. The graph reveals a fluctuating sedimentation rate as detention time increases, indicating the absence of a consistent correlation between the two variables. The graphic highlights a stage when sedimentation velocity significantly increases and decreases, and another stage when it decreases insignificantly. Notably, the sedimentation process achieves its maximum velocity within the first ten minutes, with sedimentation rates of 0.0005 m/s, 0.001 m/s, and 0.0015 m/s recorded at depths of 30 cm, 60 cm, and 90 cm, respectively. However, the sedimentation rate experiences a substantial decline after reaching peak velocity at minute 20, followed by a gradual decrease until minute 40.
According to Li et al. (2024) settling velocity is not directly dependent on sedimentation detention time. Therefore, in this practicum case, the settling velocity value fluctuates due to several factors determining the velocity. It is determined by the concentration of suspended solids, temperature, salinity, organic material content, particle size, and particle shape. During sedimentation, the concentration of suspended solids in wastewater gradually decreases, which can cause fluctuations in settling velocity. In general, the relationship between settling velocity and suspended solid concentration follows a positive correlation stage, followed by a negative correlation stage. Within a specific range of total suspended solids (TSS), the settling velocity increases with TSS. However, if the TSS exceeds a certain threshold, the settling velocity decreases with increasing TSS.
elationship between ime and edimentation ate
4.7 Settling Velocity Relationship Analysis with TSS Removal Percentage
Picture 4.3 Relation of Sedimentation Velocity with TSS Removal Percentage Source: Personal Documentation, 2024
Picture 4.3 displays a graph that illustrates the relationship between sedimentation velocity and detention time. The graph suggests that the removal of total suspended solids (TSS) is influenced by the sedimentation velocity rate. Specifically, a negative correlation exists between the velocity gradient and the TSS removal rate. When the sedimentation velocity decreases in a low-velocity gradient, the TSS removal percentage significantly increases. Conversely, a high-velocity gradient, which occurs when the velocity peaks in a short time during the early stage of the sedimentation process, will result in a less effective sedimentation rate and insignificant changes in TSS removal percentage, as shown in the graphic. It is worth noting that the number of sedimentation velocities does not correlate with the TSS removal percentage.
The rate of sedimentation can have varying effects on the percentage of total suspended solids (TSS) removed. When the concentration of suspended solids is high, the flow of water is rapid enough to hinder settling, which decreases the velocity gradient and increases the sedimentation rate. As a result, an increase in TSS removal efficiency leads to a lower concentration of suspended solids and an increase in the settling velocity. However, there is no consistent relationship between TSS removal percentage and sedimentation velocity since many factors can affect this relationship, and research findings have shown various effects of settling velocity with suspended solid concentration. In this experiment, an increase in TSS removal percentage was observed mostly with low sedimentation velocity, whereas a significant increase in sedimentation velocity led to an insignificant TSS removal percentage (Priya et al., 2015).
elationship between emoval ercentage and edimentation ate
CHAPTER V CONCLUSION
5.1 Conclusion
Sedimentation is an important step in water treatment where suspended solids are removed from water by allowing them to settle under the force of gravity. The main purpose of sedimentation is to reduce the turbidity and solid particle concentration in water. The effectiveness of this process is influenced by several factors. Therefore, this experiment aims to determine the amount of total suspended solids (TSS) allowed at certain time variations through an isoremoval graph and to analyze the factors that affect sedimentation, as well as the relationships between the removal percentage, detention time, and sedimentation rate.
For this experiment, the TSS was measured at different depths of the settling basin (30 cm, 60 cm, and 90 cm) over time variations of 0, 10, 20, 30, and 40 minutes. The isoremoval graph was used to analyze the relationship between TSS removal and detention time. Based on the calculation and graph, the optimal TSS removal percentage was found to be 31.875%
with a detention time of 37 minutes. The results also showed a positive correlation between detention time and TSS removal percentage. The concentration and removal of TSS also affect the sedimentation velocity in the system. Concentration has a negative correlation with settling velocity, so as the concentration decreases over time, the settling velocity increases. However, the relationships between sedimentation rate with detention time and sedimentation rate with TSS removal efficiency do not give consistent correlation results due to various factors influencing the sedimentation process, such as particle size, water viscosity, temperature, salinity, etc.
5.2 Suggestion
The practicum's learning objectives have been effectively communicated, and the students have demonstrated a solid understanding of the topic. However, to further enhance their results, it's imperative to delve deeper into the parameters and factors critical to the sedimentation process. By meticulously examining water viscosity, temperature, and salinity, the students can avoid inaccurate data results that may adversely affect their findings. To gain a better understanding of how these parameters affect the sedimentation process and how they can be controlled to achieve more accurate results, the students may want to consider conducting additional research.
BIBLIOGRAPHY
Araujo JPD. 2020. Kajian Instalasi Pengolahan Air Limbah (IPAL) di PT. Surabaya Industrial Estate Rungkut (SIER) Jawa Timur, Indonesia. Tesis. Departemen Teknik Lingkungan, Fakultas Teknik Sipil, Perencanaan, dan Kebumian, Institut Teknologi Sepuluh Nopember.
Darmayanti L, Hamdani, Elysti S. 2023. Analisis column settling air permukaan yang dikoagulasi dengan biokoagulan biji papaya. Jurnal Sains Teknologi dan Lingkungan 9(4): 637–636.
Priya KL, Jegathambal P, James EJ. 2015. On the factors affecting the settling velocity of fine suspended sediments in a shallow estuary. Journal of Oceanography 71(1): 163–175.
Syahputra B, Soedarsono, Poedjiastoeti H. 2022. Perancangan Bangunan Pengolahan Air Limbah. Sultan Agung Press, Semarang, Indonesia.
Zabava B, Ungureanu N, Vlăduț V, Dinca M, Voicu GH, Ionescu M. 2016. Experimental study of the sedimentation of solid particles in wastewater. Montanology, Cadastre Series 46(1): 611–617.
ADDITIONAL BIBLIOGRAPHY
Huda S. 2019. Kajian Pengendapan Partikel Flokulen dengan Hydrocyclone Terbuka. Tugas Akhir. Departemen Teknik Lingkungan, Fakultas Teknik Sipil, Lingkungan, dan Kebumian, Institut Teknologi Sepuluh Nopember.
Li Y, Xu Z, Zhan X, Zhang T. 2024. Summary of experiments and influencing factors of sediment settling velocity in still water. Water 16(938): 1–20.
ATTACHMENT
ADDITIONAL ATTACHMENT
ATTACHMENT OF ACCEPTED PRACTICUM RESULT