PRACTICUM WORKSHEET
SATUAN OPERASI TEKNIK LINGKUNGAN
Coagulation-Flocculation Analysis with Jar Test Method
Arranged by :
NAME : SHINTA NUR IHSANI STUDENT’S ID : 225100907111039 GROUP : ME 5
ASSISTANT :
Muhammad Zidan Ghifari Kana Nawafila Eiski Ishma Yusrina Nur Hanifah Michael Teudas Tertius Tsania Naila Firdausi Shafa Ariza Agmi Putri Raullyno Ghozali Ilham Mellysa Machfiro Zhafran Kamal Sultani Tjokorda Istri Mahagita Aura Dinar Ramadhani Ariya Ratana Teja Windy Trisnawati Dewi Sabina Fitri Enggal Alhamdra Andika S
WATER QUALITY AND WASTE MANAGEMENT LABORATORY DEPARTMENT OF BIOSYSTEM ENGINEERING
FACULTY OF AGRICULTURAL TECHNOLOGY BRAWIJAYA UNIVERSITY
MALANG
2024
CHAPTER I INTRODUCTION
1.1 Background
Coagulation and flocculation are crucial primary processes in wastewater treatment to remove water from suspended particles. Coagulation is defined as a process of adding an active chemical known as a coagulant agent to destabilize colloid and agglomerate it into flocs, bigger particle sizes that are easier to settle and separate. Coagulation is always followed by a process called flocculation, where flocs are forced to gain a density so that they can settle easily as the weight increases. Both processes involve the addition of chemical substances and a mixing process which may have different requirements according to the condition of the wastewater. Different processing methods in coagulation of flocculation may result in a different effluent quality which implicates efficiency and cost in further processing treatment.
Hence, it's important to analyze and examine factors that affect both coagulation and flocculation processes.
Various factors affect the process of coagulation and flocculation in water treatment.
These factors include suspended particle contaminants in water, dosage of coagulant and flocculant, mixing velocity, detention time, pH, and water temperature. The correlation of these factors can be investigated using a laboratory method called jar test to determine the desired reagent dosage, detention time, and mixing velocity. It is important to determine the exact processing before the actual coagulation and flocculation according to the water parameters such as pH, temperature, and suspended particle concentration. Therefore, a jar test is crucial for coagulation and flocculation analysis to determine the optimum approach to wastewater processing.
1.2 Objectives
a. Students can understand the principles of coagulation and flocculation.
b. Students can identify the method for determining the optimum concentration of coagulants using jar tests.
c. Students are capable of analyzing the influence of coagulation-flocculation on turbidity, color, and pH in water samples.
CHAPTER II LITERATURE REVIEW
2.1 Definition of Coagulation
Coagulation is a crucial pre-treatment process in water treatment that plays a dynamic role. In this stage, preliminary dirt is selected to remove suspended solids and undesired toxic substances using an active chemical agent called coagulant. Along with the coagulant, a rapid mixing unit is required to ensure that chemical agents are evenly spread in water. Coagulation is responsible for forming flocs or aggregates, which are suspended particles in water that hardly settle into bigger particles that are likely heavier. Coagulation involves three major mechanisms, including charge neutralization, sweep (addition of coagulant at sufficiently high concentration), and bridge formation (Sibiya et al., 2021).
Coagulation plays a crucial role in water treatment, as it is responsible for ion destabilization and neutralizing suspended particles. The coagulant plays a key role in destabilizing and charge-neutralizing suspended particles by neutralizing them with their opposite charge. Wastewater-suspended particles mostly have a negative charge and tend to jostle each other, remaining stable in suspended or colloid form. Therefore, coagulants such as PAC with a positive charge can neutralize them and create precipitate during the rapid mixing process. The charge difference creates an electrostatic force between particles, forming stable big particles. These stable particles eventually form with each other due to van der Waals forces and form flocs (Anggraini, 2015).
2.2 Definition of Flocullation
Flocculation is the process that follows coagulation, where the flocs formed in coagulation are prepared for further settlement. According to Lee et al. (2014), flocculation is when small or dispersed particles aggregate into larger particles known as flocs, which can then settle and clarify the wastewater. Since the coagulation process is not always perfect and can result in small, fragile flocs, further treatment is necessary to prevent floc breakdown. To accomplish this, a slow mixing process is combined with flocculants to agglomerate the micro- flocs formed by coagulant into larger and denser flocs. This facilitates faster sedimentation, floatation, and filtration stages.
During the process of water treatment, slow mixing is utilized to accelerate the formation of floccules and to prevent them from disintegrating. Consequently, the velocity gradient of the flocculator is relatively slow. Flocculation is a gradual process that needs at least 15-45 minutes or more than an hour of contact time, whereas coagulation only necessitates 15-60 seconds of contact time (Anggraini, 2015).
2.3 Types of Coagulants and Flocculants
Chemical coagulants and flocculants are conventional active agents used in primary water treatment, specifically in coagulation-flocculation, to create flocs that can ease the dirt separation process by settling or floating. Chemical coagulants and flocculants are considered effective agents because they provide a stable and abundant positive charge. According to Lee et al. (2014), these agents can be classified into two major groups: inorganic mineral additives and metal salts. Inorganic coagulants or multivalent metals like calcium chloride, polyaluminium chloride, and ferric chloride are widely used as low-cost flocculants. However, the excessive use of inorganic coagulants can lead to high aluminum content mud, which is dangerous to health. Therefore, organic synthetic or metal salt flocculants-coagulants are used as a second option in chemical types. Commonly used organic synthetic coagulants are polyacrylamide, polyacrylic acid, and polyamine. These polymers provide promising efficiency, as they are mostly linear and water-soluble, even though their cost may be higher compared
In addition, natural coagulants- flocculants that are harvested from living organisms such as plants have been also commonly used and developed nowadays. These substances contain active proteins like polyphenols and polysaccharides and can be extracted from plants with cellulose and chitin in their cell walls. While these natural options are more eco-friendly than chemical alternatives, they are still viewed as less efficient since multiple processes are necessary before use. Further research is necessary to determine their effectiveness in comparison to chemical options (Nasriyanti, 2020).
2.4 Types of Coagulation and Flocculation Processes
Nowadays, wastewater characteristics vary greatly, requiring a variety of methods for coagulation and flocculation. There are two main types of processes for coagulation and flocculation: coagulation-flocculation and direct flocculation. Coagulation-flocculation is the most common and conventional process used for solid-liquid separation in wastewater treatment. This process involves destabilizing colloid particles by using a chemical reagent and mixing process, which allows for the formation of flocs that can then be agglomerated and settled. On the other hand, direct flocculation is a process that achieves the same goal of removing suspended particles but does not involve the use of inorganic coagulants. Instead, polyelectrolytes are used to achieve this goal. This process is an effective alternative to coagulation-flocculation and is preferred by some due to the reduced risk of using inorganic reagents (Fauzani et al., 2021).
While direct flocculation presents a safer alternative to traditional processing methods, coagulation flocculation remains the more popular choice due to its high effectiveness. Direct flocculation is best suited for wastewater with a high concentration of suspended organic soil, as polymers can easily react with organic compounds. On the other hand, conventional coagulation-flocculation is capable of effectively treating wastewater with both inorganic and organic suspended particles. Each method has its own unique set of pros and cons and should be carefully weighed when determining the best approach to managing wastewater (Lee et al., 2014).
2.5 Factors Affecting Coagulation and Flocculation Processes
The most fundamental factor affecting the coagulation and flocculation process is the wastewater properties. Wastewater has varied compositions that can differ according to its source and environment. This will affect another parameter that has an impact on the coagulation and flocculation process. Wastewater with different suspended colloid compositions will affect the required time of the process. The more dirt with different sizes suspended in the water, the faster the process because active precipitate will form easily in small particles and eventually accelerate the settlement process (Winarni, 2016).
Other parameters that influence coagulation-flocculation are the temperature and pH of the wastewater. pH affects the surface charge of coagulants and the stabilization of the suspension. According to a study, pH is also a crucial factor in determining the optimum condition of the treatment system, especially the chemical process. Different types of coagulants or flocculants will require a different optimum pH following their chemical properties. However, the temperature will affect viscosity and aggregate structure. Increased temperature implicates decreased viscosity and bigger size of the aggregate structure, making it harder to pass the filter and eventually settle (Saritha et al., 2015).
In addition, internal factors during the process of coagulation-flocculation also play a crucial role in its effectiveness, including coagulant-flocculant doses, detention time, and mixing speed. Velocity gradient (G) is the relative velocity of a colloid particle with another particle and distance. During coagulation, rapid mixing with G>100/s is necessary to ensure the coagulant is fully reacted with water. On the other hand, slow mixing with G<60/s is needed
in the flocculation process to prevent the flocs breakdown and accelerate flocs forming.
Therefore, the decision of velocity gradient affects the detention time required in the process, especially in the flocculation process which is necessary for optimum flocs forming. Besides, dosages are also important for the effectiveness of the process. An appropriate dosage results in an optimum chemical reaction and vice versa if the dosage is less or more compared to the wastewater’s chemical substances (Anggraini, 2015).
2.6 Function and Importance of Jar Test
According to Anggraini (2015), a jar test is necessary to determine the optimum dose of coagulant or flocculant for it to effectively react with wastewater’s colloid or floc particles. A jar test can be defined as a method to determine the turbidity of a water sample and the exact dosage of an active chemical substance to clarify the water in the most optimum quantity based on a laboratory experiment. The jar test-principal in coagulation-flocculation includes the chemical substance for 1 minute in rapid mixing, slow mixing for flocs forming in 15 minutes, and sedimentation for 15 minutes.
The process of coagulation-flocculation is crucial for treating water efficiently and effectively. However, using an excessive dose of coagulant or flocculant can lead to increased chemical usage and reduced performance in treating the water. This occurs because the chemical substances do not fully react with the colloids or flocs, resulting in a decrease in contaminant removal in turbidity and color aspects. Additionally, an excessive amount of chemicals can lead to re-stabilization in coagulation, which prevents contaminants from finding adsorption sites, increasing the chance of sweeping. Conversely, an insufficient dosage of chemicals will result in the ineffective removal of suspended particles since there aren't enough chemical substances to react in the coagulation-flocculation process (Sibiya et al., 2021).
2.7 Coagulation and Flocculation Test Method with Jar Tests
According to Anggraini (2015), the jar test method includes major three steps, dispersion of reagent in rapid mixing, slow mixing, and sedimentation. These steps resemble an actual coagulation-flocculation process in a real case. The reagent addition in rapid mixing resembles the coagulation process, where the rapid mixing is done for a minute at 100 rpm. Flocculation resembled slow mixing for 15 minutes at 40-60 rpm followed by sedimentation of flocs with no mixing process for 15 minutes. Additionally, the rotation speed in both rapid mixing and slow mixing needs to be increased gradually in a jar test. Rapid mixing is tasted in the range of 50- 100 rpm with a maximum speed of 225 rpm. Meanwhile, slow mixing is tasted in a range of 10-40 rpm.
A jar test method was also used in a study conducted by Sibiya et al. (2021), where experiments were performed for wastewater treatment. The experiment used 500 mL of wastewater in six beaker glasses with dosage variations of 10, 20, 30, 40, 50, and 60 mg/L.
Samples are tested in a jar test for 2 minutes of rapid mixing at 150 rpm, 15 minutes of slow mixing at 30 rpm, and 15 minutes of motionless settling. The effect of settling time and the optimum settling result is investigated in the experiment to determine the desired dosage of reagents. For an accountable result, the sample was further tested for turbidity, color, and TSS to examine the most optimal suspended particle removal, whereby the percentage removal is calculated according to the following equation:
%𝑟𝑒𝑚𝑜𝑣𝑎𝑙 𝑒𝑓𝑓𝑖𝑐𝑖𝑒𝑛𝑐𝑦 (𝐶𝑛) =𝐶𝑖 − 𝐶𝑓
𝐶𝑖 × 100%
Where Ci and Cf are the initial and final values of each contaminant.
CHAPTER III METHODOLOGY
3.1 Figures of Tools and Materials with Functions 3.1.1 Coagulation Process
Table 3.1 Figures of Tools and Materials with Functions No. Tools and
Materials
Functions Figures
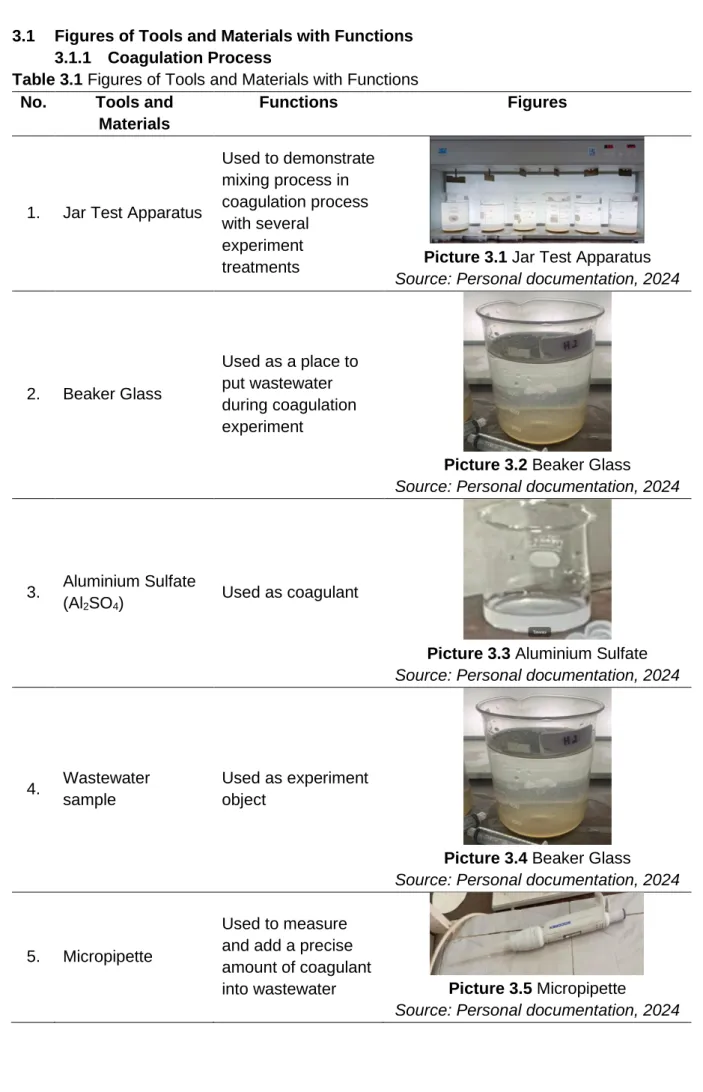
1. Jar Test Apparatus
Used to demonstrate mixing process in coagulation process with several
experiment
treatments Picture 3.1 Jar Test Apparatus Source: Personal documentation, 2024
2. Beaker Glass
Used as a place to put wastewater during coagulation experiment
Picture 3.2 Beaker Glass Source: Personal documentation, 2024
3. Aluminium Sulfate
(Al2SO4) Used as coagulant
Picture 3.3 Aluminium Sulfate Source: Personal documentation, 2024
4. Wastewater sample
Used as experiment object
Picture 3.4 Beaker Glass Source: Personal documentation, 2024
5. Micropipette
Used to measure and add a precise amount of coagulant
into wastewater Picture 3.5 Micropipette
Source: Personal documentation, 2024
6. Stopwatch Used as timer
Picture 3.6 Stopwatch
Source: Personal documentation, 2024 Source: Personal documentation, 2024
3.1.2 Flocculation Process No. Tools and
Materials
Functions Figures
1. Jar Test Apparatus
Used to demonstrate mixing process in coagulation-
flocculation process with several
experiment treatments
Picture 3.7 Jar Test Apparatus Source: Personal documentation, 2024
2. Beaker Glass
Used as a place to put wastewater during coagulation experiment
Picture 3.8 Beaker Glass Source: Personal documentation, 2024
3. Aluminium Sulfate
(Al2SO4) Used as coagulant
Picture 3.9 Aluminium Sulfate Source: Personal documentation, 2024
4. Wastewater sample
Used as experiment object
Picture 3.10 Beaker Glass
5. Micropipette
Used to measure and add a precise amount of coagulant
into wastewater Picture 3.11 Micropipette Source: Personal documentation, 2024
6. Stopwatch Used as timer
Picture 3.12 Stopwatch
Source: Personal documentation, 2024 Source: Personal documentation, 2024
3.1.3 Turbidity Test No. Tools and
Materials
Functions Figures
1. Turbidimeter
Used to measure turbidity of
wastewater samples before and after
treatment Picture 3.13 Turbidimeter
Source: Personal documentation, 2024
2. Wastewater Used as samples
Picture 3.14 Cuvette
Source: Personal documentation, 2024
3. Cuvette
Used as a container for samples during turbidity test
Picture 3.15 Cuvette
Source: Personal documentation, 2024
4. Syringe
Used to measure and add water sample into cuvette
Picture 3.16 Syringe
Source: Personal documentation, 2024 Source: Personal documentation, 2024
3.1.4 pH Test No. Tools and
Materials
Functions Figures
1. pH Meter
Used to measure the pH of wastewater samples before and after treatment
Picture 3.17 pH Meter
Source: Personal documentation, 2024
2. Tissue
Used as a container for samples during turbidity test
Picture 3.18 Tissue
Source: Personal documentation, 2024
3. Wastewater Used as samples
Picture 3.19 Wastewater Source: Personal documentation, 2024
Beaker glass
Used as a place for samples during pH testing
Picture 3.20 Beaker glass Source: Personal documentation, 2024
3.2 Working Procedure
3.2.1 Coagulation Process
Tools and materials are prepared
1 L wastewater sample is prepared
Stir the sample evenly and measure the pH and turbidity
Fill into each beaker glass with 100 mL of water sample
Add 10g/L alum dose to each beaker glass with dosage: 5 mL, 7 mL, 9 mL, 10 mL, and 12 mL
Put on the beaker glass filled with water sample and coagulant in jar test apparatus
Set the stirring process to 100 rpm for 1 minute
Let the flocs settle for 10 minutes
Test the pH, and turbidity, and observe the visibility of each sample after the coagulation process
Result
3.2.2 Flocculation Process
Tools and materials are prepared
1 L wastewater sample is prepared
Stir the sample evenly and measure the pH and turbidity
Fill into each beaker glass with 100 mL of water sample
Add 10g/L alum dose to each beaker glass with dosage: 5 mL, 7 mL, 9 mL, 10 mL, and 12 mL
Put on the beaker glass filled with water sample and coagulant in jar test apparatus
Set the stirring process to 100 rpm for 1 minute and follow with slow mixing at 60 rpm for 10 minutes
Let the flocs settle for 10 minutes
Test the pH, and turbidity, and observe the visibility of each sample after the coagulation process
Result
3.2.3 Turbidity Test
Tools and materials are prepared
Press the “on/off” button to turn on and the “Mode” button
Release the “on/off” button and then the “Mode” button
Press the mode button
Calibrate the tool by entering a 0.1 standard solution by holding the cuvette at the top and making sure the arrow on the cuvette is aligned
with the arrow on the turbidimeter and closed
Calibrate the tool by entering a 0.1 standard solution by holding the cuvette at the top and making sure the arrow on the cuvette is
aligned with the arrow on the turbidimeter and closed
Enter the sample aqueous solution into the provided cuvette
Press the Read button and wait 1 minute
Repeat 3 times for each sample
Result
3.2.4 pH Test
Tools and materials are prepared
Take 50 ml of sample water and put it in the beaker glass
Dip a portion of the pH meter into the beaker glass
Write down the grades
Result
CHAPTER IV RESULT AND DISCUSSION
4.1 Practicum Result Data
4.1.1 Observation of Visibility, Turbidity, and Coagulation pH Table 4.1 Observation of Visibility, Turbidity, and Coagulation pH
Before Treatment After Treatment
pH Turbidity (NTU)
Dosage pH Turbidity (NTU) Visibility
6,9 361 Coagulation
5 mL 5,78 15,7 Clear but with
brownish water at the bottom of the
surface
7 mL 5,13 22,4 Clear but looks
cloudy with brownish water at
the bottom of the surface
9 mL 4,69 25,3 Clear but looks
slightly cloudy with brownish water at
the bottom of the surface
10 mL 3,25 26,4 Clear but looks
slightly cloudy with brownish water at
the bottom of the surface
12 mL 3,55 18,7 Clear but looks
slightly cloudy with brownish water at
the bottom of the surface Source: Personal documentation, 2024
4.1.2 Observation of Visibility, Turbidity, and pH of Coagulation-Flocculation Table 4.2 Observation of Visibility, Turbidity, and pH of Coagulation-Flocculation
Before Treatment After Treatment
pH Turbidity (NTU)
Dosage pH Turbidity (NTU) Visibility
6,9 361 Coagulation
5 mL 5,78 15,7 Clear but with
brownish water at the bottom of the
surface 7 mL 5,13 22,4 Whitish with slightly
brownish water at the bottom of the
surface 9 mL 4,69 25,3 Whitish with slightly
brownish water at the bottom of the
surface
10 mL 3,25 26,4 Clear but looks
slightly brownish water at the bottom
of the surface
12 mL 3,55 18,7 Clear but looks
slightly cloudy with brownish water at
the bottom of the surface Source: Personal documentation, 2024
4.1.3 Physical Circumstances of Sample Water Table 4.3 Physical Circumstances of Sample Water
Before Treatment After Treatment
Sample Condition Documentation Dosage Sample Condition
Documentation
Air tampak berwarna keruh kecoklatan dan terlihat partikel- partikel koloid berwarna coklat yang tersuspensi di dalam air
Picture 4.1 Sample Before
Treatment Source: Personal
documentation, 2024
Coagulation
5 mL
The water is clear in color but there is still brownish water at the bottom of the beaker because there are some suspended particles that have not yet settled.
Picture 4.2 Sample After Coagulation (5 mL)
Source: Personal documentation, 2024
7 mL
The water is clear in color but looks cloudy and there is still brownish water at the bottom of the beaker glass because there are some suspended particles that have not settled.
Picture 4.3 Sample After Coagulation (7 mL)
Source: Personal documentation, 2024
9 mL
The water is clear but slightly cloudy and there is still brownish water at the bottom of the beaker glass because there are some suspended particles that have not settled.
Picture 4.4 Sample After Coagulation (9 mL)
Source: Personal documentation, 2024
10 mL
The water appears clear and slightly cloudy. There is a brownish
sediment at the bottom of the water surface.
Picture 4.5 Sample After Coagulation (10 mL)
Source: Personal documentation, 2024
12 mL
The water appears clear and slightly cloudy. There is a brownish
sediment at the bottom of the water surface.
Picture 4.6 Sample After Coagulation (12 mL)
Source: Personal documentation, 2024 Floculation Coagulation
5 mL
The water appears clear and there is still a little brownish water at the bottom of the beaker glass due to the formation of sediment.
Picture 4.7 Sample After Coagulation-Flocculation
(5 mL) Source: Personal documentation, 2024
7 mL
The water appears whitish and slightly brownish at the bottom due to the presence of settled particles.
Picture 4.8 Sample After Coagulation-Flocculation
(7 mL) Source: Personal documentation, 2024
9 mL
The water
appeared whitish and there were brownish spots at the bottom of the beaker.
Picture 4.9 Sample After Coagulation-Flocculation
(9 mL) Source: Personal documentation, 2024
10 mL
The water appears clear and a small brownish
sediment forms at the bottom of the beaker.
Picture 4.10 Sample After Coagulation- Flocculation (10 mL)
Source: Personal documentation, 2024
12 mL
The water appears clear and has little real turbidity. There is a small amount of sediment at the bottom of the beaker.
Picture 4.11 Sample After Coagulation- Flocculation (12 mL)
Source: Personal documentation, 2024 Source: Personal documentation, 2024
4.2 Graphic Analysis
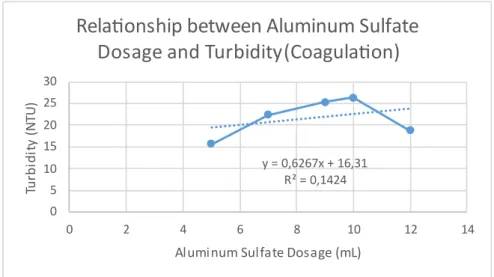
Picture 4.12 Relationship Graphic between Al2(SO4)3 Dosage and Turbidity in Coagulation Process
Source: Personal documentation, 2024
The graph displayed in Picture 4.12 illustrates the relationship between the amount of aluminum sulfate utilized as a coagulant and the resulting turbidity in wastewater. The graph shows that the turbidity fluctuates as the amount of aluminum sulfate increases from 5 mL to 12 mL. Specifically, the turbidity increases when the amount of aluminum sulfate is raised from 5 mL to 10 mL, but it decreases when the amount is raised to 12 mL on 18.7 NTU. The best turbidity removal was observed using a 5 mL dosage of aluminum sulfate on 15.7 NTU, while the worst result was obtained using a 10 mL dosage on 26.4 NTU. Therefore, the optimal dosage used for coagulation of the samples is 5 mL. This dosage facilitates the most balanced reaction of coagulant and flocs, which leads to less coagulant residue that causes water’s turbidity. The dosage and its effectiveness might be different from another wastewater sample with different turbidity and pH conditions.
The regression analysis of the graph indicates that there is no linear correlation between the amount of aluminum sulfate used as a coagulant and the level of turbidity in the wastewater. Even though the linear regression equation in the graphic also indicates the tendency of positive correlation of turbidity and aluminum sulfate coagulation as shown by the positive value of the gradient. The R2 value of the regression analysis is 0.1424, which means that the lack of correlation is due to the unpredictable and fluctuating results of the sample's turbidity after the coagulation process.
Picture 4.13 Relationship Graphic between Al2(SO4)3 Dosage and Turbidity Coagulation- Flocculation Process
Source: Personal documentation, 2024
Picture 4.13 depicted the relationship graphic between aluminum sulfate and the after- result turbidity of wastewater samples in the coagulation-flocculation process. The fluctuation of the turbidity is significantly distinguished with more significant differences as the dosage increased. Despite its significant difference and fluctuation, the regression analysis shows a more correlated relation between aluminum sulfate and turbidity removal compared to the coagulation process by an R2 value of 0.7. However, the relationship of aluminum sulfate and turbidity tends to be relatively negative to each other as shown by the negative gradient of the linear regression equation.
The graphic shows that the most optimum dosage used in coagulation-flocculation of the wastewater sample is 10 mL with the after-result turbidity is 4.2 NTU. Whereas the most unrecommended dosage is 5 mL with after-result turbidity is 23.5 NTU. The result is in reverse proportion with the coagulation process, where the optimum dosage is 5 mL and the worst result is 10 mL. The difference may be caused by different processes in the coagulation- flocculation process where both rapid mixing and slow mixing are performed, resulting in different reactions of aluminum sulfate with clogs or flocs. In 10 mL dosage of aluminum sulfate, proves the best result with less coagulant excess and more dense flocs that increase the settling rate. Meanwhile, at a 5 mL dosage of coagulant, there might be more chemical excess and the flocs are not forming and settle as effectively with a 10 mL dosage.
4.3 Coagulant Optimum Point in Practicum
The coagulant optimum point in this practicum is determined with jar test after-result that gives the most prominent result in viability, turbidity, and pH parameters. The viability concerns the color of the water, where clear uncolored water is more acceptable for clean water.
Relatedly with viability, turbidity explains the clearness of the water, where the optimum process is determined based on the water clearness that is caused by the absence of solid particles suspended in water. Therefore, turbidity is an essential parameter to examine the effectiveness of coagulation-flocculation in removing total solid particles as its main goal.
Lastly, the pH parameter in coagulation-flocculation is inconsistent in different types of coagulation-flocculation processes. However, a neutral range pH is more acceptable in the neutral range (7).
The optimum point of coagulation in this practicum is fulfilled with a 5 mL dosage of 10 g/L aluminum sulfate, while the least effective result is a 10 mL dosage of aluminum sulfate.
The water sample after the coagulation process of 5 mL aminium sulfate looks clear but there are still suspended particles that still settle and make the water color brown at the bottom of the water surface. Even though, the turbidity removal of this dosage is high at 95.65%, reducing the turbidity from 361 NTU to 15.7 NTU. The decrease of pH is considered low in the 5 mL dosage alum coagulant from 6.9 to 5.78 compared to the other dosage which shows a significant acidic pH. According to the study, the use of aluminum sulfate in high turbidity water of 250 NTU is optimal using an alum dose of 0.25 g/L at pH 6. This result is varied due to the difference in the sample’s condition, where in this practicum more neutral and turbidity water is used. Nevertheless, the addition or reduction in both experiments shows a fluctuation and no optimum result in removing the turbidity (Malik, 2018).
On the other hand, the optimal dosage of aluminum sulfate in coagulation-flocculation is achieved at 10 mL in the concentration of 10g/L, while the least effective result is on the use of a 5 mL dosage. The water looks clearer and the flocs are almost fully settled at the bottom surface of the water, making it clearer compared to the after-result of optimum dosage in the coagulation process. It’s also proven that the turbidity removal is much more significant from 361 NTU to 4.2 NTU or the removal rate is 98.83%. A study reported that coagulation- flocculation using aluminum sulfate for high turbidity of 188 NTU with a pH of 7.23 has the optimal efficiency of more than 90% with 80 ppm of coagulant concentration. The difference in result is caused by the different dosages of coagulant, and water’s initial condition (pH and turbidity) despite the mixing procedure used for the coagulation-flocculation process being the same for both practicum and literature (Dianpalupidewi et al., 2022).
4.4 Effect of Coagulation (Rapid Mixing) in Reducing Turbidity in Practicum
Research and practicum have demonstrated that different coagulants used in rapid mixing produce varying results in reducing turbidity. Using too little or too much coagulant can lead to less turbidity removal, which was proven by fluctuated turbidity removal as the dosage exceeds the optimal dosage. In this study, alum coagulant, which is the same coagulant used in this practicum, was found to be most effective at a dosage of 0.25 g/L, a pH level of 6, and a detention time of 30 minutes. This resulted in a substantial reduction in water turbidity from 250 NTU to 10 NTU, improving the water's pH level to neutral (7). However, the practicum shows that the most effective coagulation is achieved in 5 mL alum dosage with turbidity reduction from 361 NTU to 15.7 NTU. These results highlighted that in optimal conditions, coagulant plays an essential role in significantly reducing turbidity. Meanwhile, if the pH level decreases, water alkalinity increases, and more aluminum is required as the ion’s deneutralization becomes ineffective, which reveals that excessive or insufficient doses of coagulant were ineffective in reducing turbidity (Malik, 2018).
It is important to note that the effectiveness of removing turbidity in the coagulation process is greatly influenced by rapid mixing. A study conducted by Hessam and Mehdinejad (2021), compared turbidity removal in coagulation with and without a rapid mixing unit. The results showed that the absence of rapid mixing can significantly affect the effectiveness of coagulation in low and medium-turbidity water, reducing it from 86.7% to 73.8% and from 95.8% to 91.88%, respectively. However, the influence of rapid mixing in high-turbidity water remains relatively constant. In this practicum, rapid mixing is used for high turbidity water samples, where the removal rate of the turbidity for the most optimum dosage is 95,65%. The study also proved that rapid mixing is crucial for achieving optimal results in the coagulation process since it promotes more even reactions between the coagulant and flocs.
4.5 Effect of Flocculation (Slow Mixing) in Reducing Turbidity in Practicum
The practicum results show that coagulation-flocculation has a relatively significant impact on reducing turbidity. As shown the coagulation followed by flocculation has a turbidity removal rate of 98.83% for its optimum dosage. On the other hand, the turbidity removal rate for coagulation with the optimum dosage is 95,65%. In a study conducted by Dianpalupi et al.
(2022), prasedimentation in the coagulation-flocculation process resulted in higher efficiency of turbidity removal compared to coagulation that was not performed with the prasedimentation process. This highlighted that flocculation following the coagulation is important in reducing turbidity by accelerating the settling process of flocs that built up during the coagulation process.
Flocculation is an important process in speeding up sedimentation. The slow mixing during flocculation can enhance the formation of flocs by creating slow water movement, allowing the flocs to settle evenly and giving them more time to settle at the bottom of the water. This process results in the formation of bigger, denser, and stronger flocs that settle easily under gravitational forces and prevent floc breakdown due to water turbulence. Pre- sedimentation between the coagulation and flocculation process in this experiment also enhances the effectiveness of reducing turbidity as the flocs formed during coagulation have more time to settle under the gravitational forces (Dianpalupidewi et al., 2022)
4.6 Effect of pH on the Coagulation-Flocculation Process
The pH significantly influences the efficiency of coagulation-flocculation in reducing suspended soil. This is because the pH affects the reaction between the colloids and the active chemical agents, such as coagulants and flocculants. The pH also affects the surface charge of coagulants and the stabilization of suspension. Different types of coagulant-flocculant have varying levels of effectiveness depending on the water's condition and the composition of the wastewater contaminants. Some types may work better in relatively acidic or alkaline stages.
Therefore, it is essential to identify and determine the wastewater pH conditions to find the optimum pH at which the coagulant-flocculant can work best in the treatment system (Rao, 2015).
According to Saritha et al. (2017), the pH level can indicate the effectiveness of improving other water parameters such as viability and turbidity during the coagulation-flocculation process. The study found that alum and chitin work most effectively at pH 6-8, respectively.
The pH level also affects the dosage amount used in the process. As the pH condition of water doesn’t fulfill the requirements, more chemical agent is added to achieve the removal goals.
The optimal reduction of suspended particles is achieved by using the optimal coagulant dosage and neutral pH conditions, which increases destabilized particles by increasing charged groups followed by charge neutralization, resulting in a decrease in optimum dosage.
Slightly acidic water may result in smaller floc and slower settling velocity as more charged particles extend. Additionally, neutral pH for color removal patterns also results in the most effective outcome as it prevents more resuspension of solids and vice versa for significantly higher or lower pH.
In this practicum, Aluminum sulfate (Al2(SO4)3) serves as a coagulant. This coagulant can indirectly affect water conductivity through the presence of dissolved ions, such as OH- and hydronium ions, which depend on the water’s pH. The practicum results show a gradual pH decrease as the dosage increases for both coagulation and coagulation-flocculation processes. This also proves that the addition of alum dosage will decrease OH- ion resulting in more acidic water. The practicum results for coagulation on 5 mL, 7 mL, 9 mL, 10 mL, and 12 mL decreased the pH of wastewater from 6.9 to 5.78, 5.13, 4.69, 3.25, and 3.55. Meanwhile, the pH results for a coagulation-flocculation process for each dosage are 5.82, 5.37, 4.18,
4.06, and 3.43 respectively. According to a study, this chemical agent works best within a neutral pH range, but it still produces favorable results between pH 5-8 (Tahraoui et al., 2024).
4.7 Important Factors in Jar Test Method
Jar test apparatus is laboratory equipment that can imitate the coagulation-flocculation process in actual wastewater treatment for experimental purposes in manipulating and varying the treatment of water samples. The independent variables that can be tested using the jar test are mixing speed, coagulation dosage, and detention time. These variables are important factors in the jar test method that determine the effectiveness of the coagulation-flocculation process. Different treatments may cause a significant after-result depending on the condition of the water sample (Mensah-Akutteh et al., 2022).
In coagulation-flocculation, besides adjusting the coagulant dosage, mixing time and detention also play an essential role in reducing impurities. Longer mixing times can lead to flocs breakage, especially during the flocculation process. On the other hand, if the detention time is too short, it can result in inefficient collision between coagulants and colloids. In addition, the mixing velocity also plays a crucial role in the jar test. According to Anggraini (2015), the right mixing velocity for coagulation and flocculation promotes the effective reaction of colloids and active chemical agents. Too low mixing velocity during coagulation can lead to an uneven reaction, while a too-fast mixing velocity during flocculation can break down the flocs, making them turn into a colloid again.
CHAPTER V CONCLUSION
5.1 Conclusion
The coagulation and flocculation process is a primary essential process in wastewater treatment with the main purpose of reducing suspended solids in water that implicate in water turbidity. Coagulation is defined as a process of adding an active chemical known as a coagulant agent to destabilize colloid and agglomerate it into flocs, bigger particle sizes that are easier to settle and separate. Coagulation is always followed by a process called flocculation, where flocs are forced to gain a density so that they can settle easily as the weight increases. Both processes involve the addition of chemical substances and a mixing process which may have different requirements according to the condition of the wastewater.
Therefore, this practicum is focused on examining the principles of coagulation and flocculation, determining the optimum dosage of coagulant using the jar test method, also analyzing factors that affect the coagulation-flocculation process including pH, turbidity, and viability.
The results of the practicum indicate that a 5 mL dosage of 10 g/L aluminum sulfate is optimal for the coagulation process, achieving a turbidity removal rate of 95.65%. For the coagulation-flocculation process, a 10 mL dosage is considered the most effective, resulting in a turbidity removal rate of 98.83%. The coagulant's optimum point was determined using a jar test, which produced the most significant improvement in viability, turbidity, and pH parameters. Less viability or uncolored water is the most desirable for clean water. Turbidity, on the other hand, indicates the water's clarity, with the optimal process being determined based on the absence of solid particles suspended in the water. The pH parameter's most optimal result is determined by using a sample that is close to the normal pH range.
The practicum results also show that the increase in dosage can result in varied results of turbidity in coagulation or coagulation-flocculation. Both coagulation and flocculation show an unrelated correlation between dosage and turbidity removal which proves with R2<1 in the regression equation. The fluctuation results are caused by several factors that affect the effectiveness of the process such as pH and water’s initial turbidity. Less or more factors can result in worse results of coagulation-flocculation. Therefore, jar test has been a prominent method to examine and analyze factors influencing the coagulation-flocculation process.
5.2 Suggestion
The learning objectives of this practicum have been effectively conveyed. No significant improvements are required for this practicum. However, to gain a more thorough understanding, it would be beneficial to conduct observations using a variety of factors influencing coagulation-flocculation such as rotary speed and detention time.
BIBLIOGRAPHY
Anggraini BO. 2015. Peningkatan Efektifitas Proses Koagulasi-Flokulasi dengan Menggunakan Aluminium Sulfat dan Polydadmac. Tugas Akhir. Jurusan Teknik Lingkungan, Fakultas Teknik Sipil dan Perencanaan, Institut Teknologi Sepuluh Nopember.
Fauzani D, Notodarmojo S, Handajani M, Helmy Q, Kardiansyah T. 2021. Cellulose in natural flocculant applications: a review. Journal of Physics: Conference Series 2047(1):
12030. DOI: 10.1088/1742-6596/2047/1/012030.
Lee CS, Robinson J, Ching MF. 2014. A review on application of flocculants in wastewater treatment. Process Safety and Environmental Protection 92(1): 489–508.
Nasriyanti D. 2020. Aktivitas Koagulasi Ekstrak NaCl Biji Lamtoro (Leucaena leucocephala) dan Biji Turi (Sesbania grandiflora) dalam Pengolahan Air Sungai Selokan Mataram.
Skripsi. Program Studi Kimia, Fakultas Matematika dan Ilmu Pengetahuan Alam, Universitas Islam Indonesia.
Saritha V, Srinivas N, Srikanth Vuppala NV. 2015. Analysis and optimization of coagulation and flocculation process. Applied Water Science 7(1): 451–460.
Sibiya P, Rathilal S, Tetteh EK. 2021. Coagulation treatment of wastewater: kinetics and natural coagulant evaluation. Molecules 26(1): 698.
Winarni A. 2016. Optimasi Proses Koagulasi dan Flokulsi Limbah Lindi Hitam dari Hasil Pembuatan Bioetanol. Skripsi. Program Studi Kimia, Fakultas Sains dan Teknologi, Universitas Islam Negeri Syarif Hidayatullah.
ADDITIONAL BIBLIOGRAPHY
Dianpaludewi T, Hamid FA, Sulistianingsih K, Mubarok R. 2022. Eefisiensi penurunan turbiditas pada pengolahan air dengan metode jar tes. SNTEM 2(1): 676–679.
Hassem A, Mehdinejad MH. 2021. Investigating the feasibility of removing the rapid mixing unit in conventional surface water treatment and its effect on turbidity removal. Water Practice and Technology 16(4): 1173–1181. DOI: 10.2166/wpt.2021.070.
Malik QH. Performance of alum and assorted coagulants in turbidity removal of muddy water.
Applied Water Science 8(4): 1–4.
Mensah-Akutteh H, Buamah R, Wiafe S, Nyarko KB. 2022. Optimizing coagulation–
flocculation processes with aluminum coagulation using response surface methods.
Applied Water Science 12(188): 1–13.
Rao LN. 2015. Coagulation and flocculation of industrial wastewater by chitosan. International Journal of Engineering and Applied Sciences 2(7): 50–52.
Tahraoui H, Toumi S, Boudoukhani M, Touzout N, Sid ANEH, Amrane A, Belhadj AE, Hadjadj M, Laichi Y, Aboumustapha M. 2024. Evaluating the effectiveness of coagulation–
flocculation treatment using aluminum sulfate on a polluted surface water source: a year-long study. Water 16(1): 400. https://doi.org/10.3390/w16030400.
ATTACHMENT
ADDITIONAL ATTACHMENT
ATTACHMENT OF ACCEPTED DATA RESULT