TWO LAYERED BALLAST SYSTEM FOR IMPROVED PERFORMANCE OF
RAILWAY TRACK
CHAITANYA CALLA
A thesis submitted in partial fulfilment of the University’s requirements for the Degree of Doctor of Philosophy
December 2003
Coventry University
Abstract
Considerable evidence suggests that, ballast is the main cause of uniform and non- uniform settlement of ballasted railway track, provided the subgrade is adequately specified. The requirement of a good track is that the sleepers are firmly supported by the ballast bed but over a period of time uneven settlement of the ballast will cause voids to form under the sleepers leading to unacceptable ride quality of track. Voids below sleepers can lead to major track defects and in worst cases can be the cause of vehicle derailment (Ball 2003, Cope and Ellis 2001- p206). Regular maintenance is required to remove voids below sleepers and correct other track geometry faults for smooth, safe and efficient running of the railways.
The fundamental principle of track maintenance is to lift the track wherever it is low and pack ballast firmly under the sleepers ( Tazwell 1928, Frazer 1938, Cope and Ellis 2001 - p231). Track maintenance has evolved from manual methods of track maintenance, beater packing and measured shovel packing, of early railways to today’s sophisticated mechanised automated systems of maintenance, tamping and stoneblowing, but the basic principles of maintenance still remain the same. Beater packing or tamping works by compressing existing ballast below and around the sleepers into the void below the sleeper while in measured shovel packing and stoneblowing new stones of smaller size are introduced into the void below the sleeper. Ideally ballast below sleepers once compacted by traffic should be left undisturbed, which is the case for measured shovel packing and stoneblowing techniques of maintenance but beater packing and tamping disturbs ballast below the sleepers (Tratman 1909 - p361, Cope and Ellis 2001 – p260). The durability of track geometry of track maintained by the stoneblower is higher, but tamping still remains the preferred option as opposed to stoneblower for track maintenance (Ball 2003). Both
The proposed two layered ballast system described in this thesis replaces the crib ballast around the sleepers by stones of size smaller than standard railway ballast. The aim is to fill the voids below the sleepers before they become unacceptably large, without use of expensive plant or manual intervention. Model and full scale laboratory tests carried out using the proposed two layered ballast system have demonstrated that with smaller stone as crib ballast (ballast around the sleepers) a void below the sleeper will be filled up to the average particle size of the crib ballast, by smaller crib ballast particles flowing into the void below the sleeper (Claisse et al 2002, Claisse and Calla 2003). The system is self- maintaining and does not require manual intervention or use of mechanical tools or plant once the smaller ballast has been placed in the crib.
ACKNOWLEDGEMENTS
Work on this thesis has been carried out under the guidance of Dr Peter Claisse and late Dr Michael Keedwell. The author wants to express his deep and sincere gratitude to his guides Dr Claisse and Dr Keedwell for giving him the opportunity to work on this project and for their invaluable guidance and deep insight into the subject. The research project has been funded by Balfour Beatty Rail Company and RMC Concrete products and the author would like to thank Tony Darroch of RMC and Charles Penny of Balfour Beatty Rail for their invaluable advice on various practical aspects of this project. The author is grateful to the technicians at the School of Science and the Environment for their support and encouragement throughout the project. The author also wants to thank Austin Reeves and Jim McCartney for their cooperation and support while writing the thesis.
Contents
PageAbstract ii
Acknowledgements iv
Contents v
List of figures xiii
List of tables xxiii
Executive Summary xxv
1. Introduction
1.1 Two layered ballast system 2
2 Literature review
2.1 Introduction 5
2.2 Rails 6
2.3 Sleepers 7
2.4 Ballast 11
2.4.2 Ballast depth 12
2.4.2 Material for ballast 15
2.4.3 Ballast size 16
2.4.4 Ballast fouling and drainage 17
2.5.1 Voids below sleeper 21
2.5.1.1 Wet spots and ballast failure 26
2.5.1.2 Twist faults and cyclic tops 28
2.5.1.3 Track geometry measurement and analysis 30
2.6 Track maintenance 33
2.6.1 Beater packing 34
2.6.2 Ordinary and measured shovel packing 35
2.6.3 Mechanised tamping 38
2.6.3.1 Use of hand held tamping tools 38
2.6.3.2 Use of fully mechanised automatic tamping machines 38 2.6.4 Pnuematic ballast injection machines (Stoneblowers) 50
2.6.4.1 Hand held stoneblowing machines 50
2.6.4.2 Mechanised pneumatic ballast injection machines 52 2.6.5 Dynamic track stabiliser and crib and shoulder surface
compactor 59
2.7 Ballast specification – a historical perspective and present problems 61
2.7.1 Ballast material 61
2.7.2 Ballast size 63
2.8 Railway track loads 67
2.9 Ballast settlement equations 69
2.10 Model and full scale testing of ballast 73
2.10.3 Model test by Ishikawa et al 77
2.11 Alternatives to conventional ballasted track 78
3 Measurement and virtual instrumentation
3.1 Introduction 83
3.2 Data acquisition instruments 83
3.3 DAQ drivers or driver softwares 84
3.4 Application software 86
3.4.1 Front panel and block diagram 87
3.4.2 Functions 90
4 Laboratory test set up
4.1 Introduction 97
4.2 Simple and uplift cycles 98
4.3 Model test set up 100
4.3.1 Model test components 101
4.3.1.1 Sleepers 102
4.3.1.2 Ballast and subgrade 103
4.3.1.4 Types if runs 108
4.3.1.5 Problems with oil pressure 112
4.3.2 Virtual instrumentation of model test set up 114 4.3.2.1 Calibration of compression machine and displacement 115
4.3.2.2 Labview control panel 117
4.3.3 Data processing 120
4.3.4 Instrumented sleeper 124
4.3.4.1 Computer set up for the instrumented sleeper 126
4.3.4.2 Calibration of strain gauges 127
4.4 Box test set up 136
4.4.1 The ballast box 136
4.4.2 Hardware set up for the test 138
4.4.3 Ballast for box test 140
4.5 Test set up for full scale laboratory test 140
4.5.1 Sleeper, rail and ballast 141
4.5.2 Boundary conditions 141
4.5.3 Displacement measurement 144
4.5.4 Simple and uplift cycles 144
5 Model test results 147
5.1 Observations from two dimensional glass model 148
5.2 Model tests 149
5.2.1 Tests on monoblock sleepers 150
5.2.1.1 Initial tests on the two layered ballast system- Type A runs 150
5.2.1.1.1 Observations on the initial tests 152
5.2.1.2.1 Observations 158
5.2.1.2.2 Discussion 162
5.2.1.3 Effect of crib ballast particle size and uplift height in uplift
cycles 162
5.2.1.3.1 Uplift height 163
5.2.1.3.1.1 Observations 165
5.2.1.3.2 Particle analysis 168
5.2.1.3.2.1 Observations 170
5.2.1.3.3 Discussion 172
5.2.1.4 Effect of bottom ballast size and grading on the two layered
ballast system 173
5.2.1.4.1 Effect of bottom ballast grading 173
5.2.1.4.2 Effect of bottom ballast size 174
5.2.1.4.2.1 Observation 175
5.2.1.5 Uplift equal to displacement cycles 176
5.2.1.5.1 Observations 178
5.2.1.6 Tests with different configuration of simple and uplift cycles
– Type B runs 179
5.2.1.7 Tests on twin block sleepers 183
5.2.3 Tests on steel sleepers 186
5.2.3.1 Initial testing 186
5.2.3.2 Comparison of results for 5mm and 2mm crib ballast 188
6 Full scale test results 193 6.1 Box test
6.1.1 Tests with 50mm bottom ballast and 50mm crib ballast 194
6.1.1.1 Observations 195
6.1.2 Tests with 50mm bottom ballast and smaller crib ballast 196
6.1.2.1 Test with 20mm crib ballast 196
6.1.2.1.1 Observations 197
6.1.2.2 Box test with 5mm crib ballast 201
6.1.3 Tests with 20mm bottom and crib ballast 205
6.1.3.1 Observations 205
6.1.4 Test with graded ballast 206
6.1.4.1 Observations 209
6.2 Full scale test on a single sleeper and rail assembly 211 6.2.1 Initial tests with sleeper spacing 550mm 211
6.2.1.1 Observations 213
6.2.2 Tests with sleeper spacing 600mm 215
6.2.2.1 Test with 50mm bottom and 20mm crib ballast 215 6.2.2.2 Tests with 50mm bottom ballast and different sizes of crib
ballast 220
6.2.2.2.1 Test with 20mm stone and sand as crib ballast 221
6.2.2.3.1 Observations 228 6.2.2.4 Test to simulate the stoneblowing machine design uplift 231
6.2.2.4.1 Observations 233
6.2.3 Tests with sleeper spacing at 800mm 235
6.2.3.1 Observations 236
7 Discussion on results
7.1 Introduction 237
7.2 Ballast compression under sustained cyclic loading 238
7.2.1 Observations 239
7.3 Sleeper height gain in uplift cycles for Type A runs 240 7.4 Observations on empirical analysis and discussion on results 252
7.4.1 A maximum (Am) Vs A empirical (Ae) 252
7.4.2 Parameter – Sleeper spacing 253
7.4.3 Parameter – Uplift height and crib ballast particle size 258 7.4.3.1 Model tests carried out without bottom ballast on sandpaper 258 7.4.3.2 Full scale tests (including box tests) 260
7.4.4 Constant c and B 261
7.4.4.1 Effect of sleeper spacing on constant c in model tests 261 7.4.4.2 Model tests on sandpaper base compared with model tests on
50mm bottom ballast 262
7.4.4.3 Model tests on 50mm bottom ballast compared to full scale
7.4.4.4 Void size and crib ballast particle size Vs c for full scale test 265 7.4.4.5 Tests run on 20mm crib and bottom ballast 266
7.4.4.6 Constant B 268
8 Live track trials
8.1 Introduction 269
8.2 Methodology for carrying out the live track trials 269 8.2.1 Displacement measurement using digital video photography 270
9 Conclusions 277
Appendices 280
References 291
List of figures
Figure 1.1 Cross-section through proposed two layered ballast system 3
Figure 1.2 The potato masher principle 4
Figure 2.1 Ballasted railway track with concrete sleepers (Cope 2001) 6 Figure 2.2 An early horse drawn railway on wooden longitudinal sleepers 6 Figure 2.3 An artists impression showing the first passenger train ever run. 8
Figure 2.4 Concrete sleepers 9
Figure 2.5 Track being laid on steel sleepers 9
Figure 2.6 Stress distribution from sleeper to subgrade 12 Figure 2.7 Details of ballasted track in UK in the early 1900’s with
hardcore ballast and top ballast 15
Figure 2.8 Inherent track quality – Influence of rail shape and ballast shape
(Selig and Waters 1994) 20
Figure 2.9 Graphs demonstrating frequent maintenance required by
inherently poor track (Selig and Waters 1994) 20 Figure 2.10 Graph showing effect of track quality on maintenance cycle and
intervention levels for different traffic (Selig and Waters 1994) 21 Figure 2.11 Pell void meter fixed to bottom flange of the rail (Cope 2001) 22 Figure 2.12a Coventry – Nuneaton railway line as seen from level crossing on
Coundon road in Coventry, close to the author’s house. 23 Figure 2.12b Coventry - Nuneaton railway line with cyclic fault 23
the sleepers 25 Figure 2.14 Voids below concrete sleeper again identified by white powder
around the sleeper
25
Figure 2.15 Wet spot with water ponding in the crib (Ball 2003) 26 Figure 2.16 An advanced stage of wet spot with voided sleepers and fouled
ballast (Ball 2003) 27
Figure 2.17 Wet spot causing sleeper damage, observe the ballast displaced
out of the crib (Selig et al 1994) 27
Figure 2.18 An advanced stage of wet spot which will require ballast
renewal (Cope 2001) 28
Figure 2.19 Cyclic top in continuous welded track 29
Figure 2.20 Dipped joints caused by insufficient packing of ballast below
joints (Cope 2001) 30
Figure 2.21 High speed recording car capable of recording at speeds of 125
miles per hour (Cope 2001) 31
Figure 2.22a Track with poor geometric quality – standard deviation 6.8mm 32 Figure 2.22b Track geometric quality restored by maintenance – standard
deviation 3.1mm 33
Figure 2.23 Identifying slack in the track using simple levelling techniques of three sighting boards prior to measured shovel packing (Cope
2001) 36
Figure 2.26 A close-up view of on track tamping machine showing the
tamping tines 40
Figure 2.27 Tamping tines attached to a power unit (Selig and Waters 1994) 40 Figure 2.28 Effect of progressive fouling on length of tamping cycle (Selig
and Waters 1994) 41
Figure 2.29 Progressive decrease in time between tamping (Selig and Waters
1994) 42
Figure 2.30 Tamper design standard deviation and implemented standard
deviation (Ball 2003) 44
Figure 2.31 Comparison of vertical standard deviation recorded by tamper
and the HSTRC before and after treatment (Ball 2003) 45 Figure 2.32 Vertical standard deviation recorded by the HSTRC 1,3,6,12
months after tamper treatment of the track (Ball 2003) 46 Figure 2.33 Track fouling on British Railways (Ball 2003) 49 Figure 2.34 Track fouling on British Railways (Mc Michael et al 1992) 49 Figure 2.35 Schematic diagram showing operation of pneumatic ballast
injection machines 51
Figure 2.36 Hand held stoneblowing process in operation (Selig and Waters
1994) 51
Figure 2.37 Stoneblowing machine 52
Figure 2.38 Close-up photograph showing the tubes used for blowing stones
under the sleepers 52
stoneblower and HSTRC before and after treatment (Ball 2003) 55 Figure 2.40 Vertical standard deviation as recorded by the HSTRC 1,3,6,2
months after stoneblower treatment 56
Figure 2.41 Comparison of fouling by tamping and stoneblowing (Harsco
track technologies 1997) 59
Figure 2.42 Close-up view of dynamic track stabiliser unit (Cope 2001) 60 Figure 2.43 Crib and shoulder ballast compactor (Selig and Waters 1994) 61 Figure 2.44 Figure showing track ballasted with 37.5mm (1.5inch) slag
ballast (Randell 1913) 64
Figure 2.45 Box test arrangement by Selig et al 74
Figure 2.46 Box test set up by Anderson et al 76
Figure 2.47 Moving wheel load test set up 77
Figure 2.48 PACT track 79
Figure 2.49 Concrete sleepers embedded in concrete base slab 80
Figure 2.50 Ladder track used in the U.K. 81
Figure 2.51 Ladder track Wakui et al 2002 82
Figure 3.1 A simple program for reading analog signals using DAQ board 86 Figure 3.2 Controls and Indicators on Labview Control (Front) panel. 87 Figure 3.3 Controls and indicators of figure 3.2 as they appear on Labview
Block Diagram.
88
Figure 3.5 Examples of Structures in Labview. 91
Figure 3.6 For loop example 92
Figure 3.7 While Loop example 93
Figure 3.8 Case Structure example 94
Figure 3.9 Sequence structure 95
Figure 3.10 Formula node example 96
Figure 4.1 Two dimensional representation of track ballast and sleepers 97 Figure 4.2 Schematic diagram showing ‘simple’ and ‘uplift’ cycles 99 Figure 4.3 A typical result from a test run with 20 ‘simple cycles’ and 20
uplift cycles. The crib ballast was stone of smaller size. 100
Figure 4.4a Monoblock sleepers 101
Figure 4.4b Steel sleeper used for the model test 101
Figure 4.4c Twin block sleepers 102
Figure 4.5a Avery Denison loading machine used for testing. 105
Figure 4.5b Photographs of the model test set-up 106
Figure 4.6 Typical model test load cycles 109
Figure 4.7 Typical loading graph for uplift equal to displacement run, one simple load cycle followed by uplift cycles with uplift height
Figure 4.8 A typical loading graph for type B runs. 112 Figure 4.9 Model test data fitted with a moving average curve. 114
Figure 4.10 Calibration of voltage in Labview. 116
Figure 4.11a Calibration of compression machine 116
Figure 4.11b Calibration of displacement transducer 116
Figure 4.12 Control panel 118
Figure 4.13 Test run without bottom ballast 120
Figure 4.14 Test run without ballast 121
Figure 4.15 Comparison of raw data and processed data from a model test 122 Figure 4.15a Model test data fitted with a moving average curve 124
Figure 4.16 Details of strain gauge sleeper 125
Figure 4.17 Hardware set up for instrumented sleeper 126 Figure 4.18 Labview control panel for strain gauge program 127 Figure 4.19 Change in stress under the strain gauge sleeper in simple and
uplift load cycles 129
Figure 4.20 Strain gauge sleeper calibrated for tension in metal bars 130 Figure 4.21 Calibration of strain gauge 1 and 3 for tension in metal bar 131 Figure 4.22 Strain gauges calibrated for compression in the metal bars 132 Figure 4.23 Calibration of compression load on instrumented sleeper 132 Figure 4.24 Combined graph for calibration in compression and tension 133 Figure 4.25 Strain gauge readings for test with no ballast 134
testing 136
Figure 4.28 Ballast box 137
Figure 4.29 Cross-section through full scale test set up 141
Figure 4.30 Full scale test set up 142
Figure 4.31 Full scale test set up 143
Figure 5.1 Two dimensional glass model 147
Figure 5.2 Results from initial tests on two layered ballast system 152 Figure 5.3a Test with sleepers in 5mm crib ballast and different spacing 157 Figure 5.3b Tests with sleepers in 2mm crib ballast and different spacing 158
Figure 5.4 Test set up without 5mm bottom ballast 163
Figure 5.5a Effect of uplift height on sleeper height gain 164 Figure 5.5b Uplift height against maximum height gain 164 Figure 5.6 Comparison of 20 uplift cycles for test with 5mm bottom ballast
and test without bottom ballast 166
Figure 5.7a Effect of particle size on sleeper height gain 170
Figure 5.7b Particle Vs Maximum gain 170
Figure 5.8 Comparison of test runs with 5mm and 2mm bottom ballast 175 Figure 5.9a Lift height equal to settlement test for 5mm bottom ballast 177 Figure 5.9b Comparison of test run on 5mm and 2mm bottom ballast 178 Figure 5.10 Type B runs with different uplift heights 180 Figure 5.11a Tests on twin block sleepers – Type A runs in 5mm crib and
Figure 5.11b Tests on twin block sleepers – Type A runs in 2mm crib ballast 184 Figure 5.12 Steel sleeper placed ballast with no initial displacement 187
Figure 5.13 Tests on steel sleepers 188
Figure 5.14 Load in strain gauge 1 and 3 for first 100 load cycles. Twenty
simple cycles followed by uplift cycles were run 190 Figure 5.15 Complete strain gauge load data for all load cycles strain gauge
1 and 3 191
Figure 6.1 Box test with 50mm bottom and crib ballast. 194
Figure 6.2 Model test and box test results 195
Figure 6.3 Box test with 20mm crib ballast, uplift height in uplift cycles
25mm 197
Figure 6.4 Comparison of box test and model test results 199
Figure 6.5a Box test with 20mm crib ballast 200
Figure 6.5b View through inspection window 200
Figure6.6 Box test results with 5mm and 20mm crib ballast. 201 Figure 6.7a Test with 5mm crib ballast - photograph taken after the test was
complete. 202
Figure 6.7b Photograph showing movement of 5mm crib ballast to the centre
of the sleeper cross-section. 203
Figure 6.8 Simple cycles – test run with 50mm and 20mm bottom ballast 206
Figure 6.11a Movement of crib ballast below the sleeper 214 Figure 6.11b Movement of crib ballast below the sleeper 215 Figure6.12 Sleeper displacement for sleeper spacing 600mm with 20mm
crib ballast. The total void size at the start of the test was 30mm. 216 Figure 6.13 Comparison of results from full scale test, box test and model
test. 217
Figure 6.14 Full scale test with faster rate of loading – uplift cycles only. 219 Figure 6.15 Tests with 20mm crib ballast and sand ballast compared 223
Figure 6.16 Test with sand as crib ballast 224
Figure 6.17 Tests with 10mm and 5mm crib ballast uplift cycles only. 225 Figure 6.18 Full scale test in 10mm crib ballast with sloping bottom ballast. 227 Figure 6.19 Comparison of test with 20mm and 50mm bottom ballast 228 Figure 6.20a Photograph of test with 20mm bottom and crib ballast 230 Figure 6.20b Photograph of test with 20mm bottom and crib ballast 230 Figure 6.21 Simulation of high uplift used by tampers or stoneblowers in full
scale test. 233
Figure 6.22 Tests with sleeper spacing 600mm and 800mm compared. Crib
ballast size for both tests was 20mm stoneblowing stone. 235
Figure 7.1 Comparison of box test results with Selig et al. 239 Figure 7.2 Sleeper uplift height gain for different tests. 241 Figure 7.3 Model test for sleepers at 60mm spacing with 2mm crib ballast,
uplift cycles. 243 Figure 7.4 Empirical modelling of model test data for sleeper spacing
600mm and 20mm crib ballast uplift height 25mm, data has been
converted to equivalent full scale. 245
Figure 7.5 Box test with 10mm crib ballast, 50mm bottom ballast, uplift
height 25mm. 246
Figure 7.6 Full scale test with 20mm crib ballast, curve fitting using
equation (7.4) 247
Figure 7.7 Model test with 45mm sleeper spacing 2mm crib ballast 248
Figure 7.8 Box test with 7mm crib ballast 248
Figure 7.9 Am Vs Ae for all test data. 253
Figure 7.10 Sleeper spacing Vs Ae/Ap. 254
Figure 7.11 Model tests without bottom ballast. 258
Figure 7.12 Full scale tests 260
Figure 7.13 Value of constant c for different sleeper spacing 262
Figure 7.14 Average particle size / void size Vs c 263
Figure 7.15 Model tests and Full scale tests (including box test) on 50mm
bottom ballast. 264
Figure 7.16 Box tests and full scale tests 50mm bottom ballast – value of
constant c 265
Figure 7.17 Ae Vs B for all test data 268
List of tables
Table 2.1 Proposed ballast depths by Selig and Waters (1994) 13 Table 2.2 Ballast depth on British Railways (Cope 1993) 14 Table 2.3 British Railways sources of fouling (Selig and Waters 1994) 47 Table 2.4 Ballast contamination on British Railways (Ball 2003) 48 Table 2.5 Development of British Rail Ballast specification 67
Table 4.1 Grading of full scale and model scale railway ballast 103
Table 4.2 Ballast pressures for model tests 108
Table 5.1 Initial model test parameters 151
Table 5.2 Tests with different sleeper spacing 156
Table 5.3 Sleeper height correction 159
Table 5.4 Sleeper uplift height gain 165
Table 5.5 Predicted and measured maximum height gain 167 Table 5.6 Single size stone fractions used for particle analysis tests 169
Table 5.7 Sleeper height gain 171
Table 5.8 Predicted and measured height gain 172
Table 5.9 Bottom ballast grading 174
Table 5.10 Different crib and bottom ballast configuration for uplift equal to displacement cycles
177
Table 5.11 Sleeper spacing and crib ballast combination for test on twin 183
Table 6.1 5mm ballast gradation 204
Table 6.2 Sleeper uplift height gain 204
Table 6.3 Mixed ballast grading 208
Table 6.4 Grading of 5mm and 10mm aggregate used as crib ballast 221
Table 6.5 Sleeper height gain 229
Table 7.1 Results of empirical modeling 249
Executive Summary of Research
The research involved laboratory, testing at both model scale and full scale on the proposed two-layered ballast system. The different types of tests carried out during the research are shown in the chart on page xxvi. A voided sleeper was simulated in all the tests by lifting the sleeper up between cycles. In type A runs the sleeper was lifted up after each load cycle. In type B runs the sleeper was lifted up after the passage of a ‘train’ on the track i.e. 10 load cycles. In uplift equal to displacement cycles the sleeper uplift was equal to sleeper displacement into the ballast, i.e. the sleeper was lifted up to the datum zero level set at the start of each test.
A typical track settlement curve after tamping of ballast or on a newly constructed track is shown in figure (i). Track settlement immediately after tamping or in a newly constructed track is very rapid initially but reduces with time as shown in the graph. The laboratory testing for the research was carried out in the region of the track settlement graph (Figure (i)) where the rate of settlement was very low, again as shown in the graph.
Figure (i) Track Settlement with time.
Track Settlement
Time
Track Level
Region of graph for Laboratory Testing
Test Summary
10th scale model tests
Wooden monoblock sleepers
Steel sleepers
Instrumented sleeper
Observations from a two dimension model for different size crib ballast.
Concept of simple and uplift cycles developed.
Twin block sleepers
Type A runs Uplift equal to
displacement cycles
Type B runs
Parametric study with different size bottom and crib ballast with different size of voids below sleepers
Type A runs with 5mm bottom and 2mm crib ballast
Tests with different size of bottom ballast and 2mm crib ballast
Tests with 5mm bottom and 2mm crib ballast and different size of voids below sleepers
Full s tests
Box T
Type A runs
Parame
with di
bottom ballast differen voids b
sleeper Type A runs
Parametric study with different size bottom and crib ballast with different size of voids below sleepers and different sleeper spacing
Type A runs
1. Introduction
Ballasted railway track consists of track superstructure of rails and sleepers supported on a layer of granular material (stones) called ballast. Ballast provides a ‘firm but elastic’
support to the track superstructure and distributes stresses from the sleepers to the subgrade.
Ballast also provides for immediate drainage of rainwater from the track but arguably the most important function of ballast is to allow maintenance of track, required to keep the track geometry within certain tolerances for safe and efficient running of trains. Ballast by weight and by volume is the largest component of the track and cost of buying and distributing ballast forms a significant part of the entire Civil Engineering budget of the railways (Cope 1993, p314). In spite of the fact that ballast is the most important component of the permanent way most attention has been focused on the track super structure of rails, fasteners and sleepers, not much consideration has been given to understand the behaviour of ballast in detail (Selig and Waters 1994, p1.1).
Loss of track geometry can be broadly defined as departure beyond a certain tolerance, of the track from its design horizontal and vertical alignment, referred to in the Railway terminology as loss of ‘line’ and ‘level’. Many authors are of the opinion that of all the components of the permanent way ballast is the controlling factor of loss of geometry of track (Shenton 1984, Selig & Waters 1994 – p8.3, Tratman 1909 – p25). Ballast has been identified as the main cause of average and differential settlement of railway track with passage of traffic. Track settlement is also influenced by the inherently variable nature of the formation but if the formation is adequately specified ballast remains the main cause of loss of geometry and subsequent loss in ride quality of the track (Selig and Waters 1994, p8.32). Differential settlement of ballast can cause voids to be formed under the sleepers, which is a major maintenance issue in Railways around the world. Voids below sleepers can lead to major track defects and in worst cases can be the cause of vehicle derailment (Ball 2003, Cope and Ellis 2001 – p206). Continuous inspection of track is required to identify problem areas and carry out maintenance to the track, to correct track geometry problems including voids below the sleepers. Track maintenance has evolved from manual
1930’s to today’s sophisticated mechanised automated systems of maintenance like tamping and stoneblowing, these are described in detail in the literature review. Both modern systems of track maintenance viz. tamping and stoneblowing are in principle automation of beater packing and measured shovel packing methods. Thus both tamping and stoneblowing inherit the drawbacks of the manual track maintenance methods.
The proposed two layered ballast system described in this thesis replaces the crib ballast around the sleepers by stones of size smaller than standard railway ballast. The aim is to fill the voids below the sleepers before they become unacceptably large, without use of expensive plant or manual intervention.
1.1 Two layered ballast system
The concept of two layered ballast system was proposed by Dr Michael Keedwell of Coventry University and patented by him (Keedwell 2003). The system consists of replacing 50mm boxing ballast (crib ballast) around the sleepers with stone of smaller size as shown in figure 1.1.
The research reported in this thesis shows that, with smaller size crib ballast when a void is formed under the sleeper larger than a certain size the smaller crib ballast rolls into the void maintaining sleeper vertical alignment. Dr Keedwell likened this idea to the potato masher principle as illustrated in figure 1.2. The potato masher placed in a cylinder filled with sand once lifted, will not be able to move to its original position as the void below will be filled with sand.
Figure 1.1 Cross-section through proposed two layered ballast system
The system has been patented in the US and Australia (Keedwell 2003). The patent is for a system supporting a rail of a rail track above a substrate. The rail is supported on the upper face of a support (sleeper) with the lower surface facing the substrate, the support is maintained between the lower surface (of the sleeper) and the substrate and the movement of the rail towards the substrate is inhibited. The patented system is designed to deal with the problems of voids below the sleepers and provide a better alternative to the maintenance process of tamping and stoneblowing. The scope of the patent covers continuous support for road or rail vehicles in form of beams or rails placed under the wheels in the direction of travel with cross members (sleepers) resting on a substrate called ballast or road pavement materials placed over ground surface or formation and space between cross members filled with granular material. The spacing and dimensions of the cross members and particle size
Crib ballast
Bottom Ballast
any gaps that form between the cross members and ballast or road pavement materials, thus compensating for uneven settlement of ballast or road pavement materials and providing a self – levelling support system
.
The research in this thesis looks at practical application of the system to ballasted railway track. A history of development of specifications for the permanent way components and permanent way maintenance methods is given in chapter 2 along with a literature review of research on ballast and railway track maintenance. Virtual instrumentation and measurement methods are described in Chapter 3. The laboratory test set up for model tests and full scale tests is described in Chapter 4. Results from model tests are described in Chapter 5 and results from full scale tests are described in Chapter 6. A discussion on the results of model tests and full scale tests is presented in chapter 7. A
2. Literature review
2.1 Introduction
Railway is considered as one of the fundamental innovations in the development of transportation.
The railway is distinguished from other modes of transport by carriages with smooth metal wheels running on smooth metal rail supported by sleepers resting on a track bed of graded stone known as ballast (more recently the slab track). The great advantage of railway is that the friction or rolling resistance of a smooth metal wheel running along a smooth rail is much lower than that of any type of road vehicle (Rolt 1968, p11). One of the main disadvantages is the regular maintenance required by the ballasted railway track. It is accepted that the cost of maintaining a railway track is several times greater than that of an equivalent length of road lane.
Railways as seen today are not a result of some instantaneous development but is the result of combination of ideas which have been around for a few hundred years. The figure 2.1 below shows a typical modern ballasted track with concrete sleepers laid to a good standard (Cope and Ellis 2001, p – ‘inside cover page’).The history of development of the railways is described in this chapter with particular emphasis on development of ballast specification and maintenance techniques.
Figure 2.1 Ballasted railway track with concrete sleepers (Cope and Ellis 2001)
2.2 Rails
The rails support and guide the wheels of the vehicle. Their profile has been the object of continuous improvement since the appearance of the railways. Wooden railways were used in the mines from the sixteenth century onwards.
Figure 2.2 An early horse drawn railway on wooden longitudinal sleepers (www.railwaycentre.com 2003)
These wooden wheels were initially provided with a running surface made of wooden blocks, which was subsequently replaced by wrought iron plates in the industrial revolution. This evolved further to cast iron plates and later to edge rails with flanged iron wheels. In 1825, the Stockton and Darlington Railway was constructed adopting track of wrought iron rails resting in cast iron chairs supported on stone blocks set in the ground at three feet (0.9m) intervals. The rails used in the Stockton and Darlington railways were of
‘T’ section, 4.5m long and weighed approximately 120N per metre. Soon with the development of new technology steel rails substituted the cast iron rails. Until the second world war the bullhead or ‘dumbbell’ section was standard throughout. The first trials with the flat bottom rails were carried out at Cheddington in 1936 . This rail became the British Standard in February 1949. The flat bottom rail has been redesigned continuously to suit the increasing needs of traffic and high speed trains and recently the British railway has opted for the 60 kg/m section for its railways in place of the existing 56 kg/m section (Hope 2000).
2.3 Sleepers
The sleepers (also known as ties) maintain the line, level and the gauge of the rails and resist action of those forces tending to alter the line and level of the rails. The early makers of the permanent way mistakenly aimed at complete rigidity of the railway track by laying the track on massive stone blocks or stone sleepers. George Stephenson stuck to the system of track on rigid stone blocks for his Liverpool and Manchester railway (See figure 2.3) but it soon became evident to other engineers that laying track on rigid stone blocks led to frequent rail breakage under the heavy locomotives and these stone blocks were soon replaced by timber cross sleepers (Rolt 1968, p14).
Figure 2.3 An artists impression showing the first passenger train ever run. It seems a horse drawn carriage was run alongside to compare the ‘horsepower’ of six horses to steam power but note the track in the foreground with rails sitting on top of massive stone blocks with no ballast (www.railcentre.co.uk 2003)
The need to find a replacement to wooden sleepers arose at the start of World War -II.
Reinforced concrete sleepers were not found satisfactory and steel sleepers were not approved for use in UK because of the cost and fear of corrosion in the variable weather environment. During World War II the first prestressed concrete sleepers were put in the West Coast mainline at Cheddington near Tring on 21st February, 1943 (Taylor 1993).
Development of prestressed concrete sleepers took place about the same time as the development of the flat-bottomed rail. Prestressed concrete sleepers have been the Standard for British rail but the use of steel sleepers is slowly gaining acceptance in the UK. The standard prestressed concrete sleepers used in the UK are normally 2515 mm. long by 264 mm. wide. The depth varies from 203mm. at the rail seat to 165mm. at the center (RMC
Figure 2.4 Concrete sleepers
Figure 2.5 Track being laid on steel sleepers
Higher stresses are developed in the ballast below a twin block sleeper and thus adequate ballast depth should be provided for optimum performance. In monoblock sleepers the stress distribution is better leading to lower stresses in ballast compared to twin block sleepers but as twin block sleepers are heavier they provide better transverse stability to the track. Due to the flexible tie bar in between the twin block sleeper the track requires extra maintenance to ensure that the blocks do not tilt differentially and the track does not loose gauge.
The use of steel sleepers is being promoted on British rail when relaying sections of track but this is still in its trial period (Hope 2000). Steel sleepers as seen in figure 2.5 have an inverted trough shape with spade ends. Initially when the sleepers are laid on the ballast the sleepers sit on their spade ends but passage of traffic soon forces the spade ends into ballast with the ballast partially filling the inverted trough shape of the sleeper. The remainder of the trough is filled by tamping the ballast. Steel sleepers are being considered for use in tunnels as they can be laid with reduced depth of bottom ballast as compared to wood or concrete. One of the problems with steel sleepers is the reduced lateral resistance to track movement, but better lateral resistance is offered by the spade ended sleepers.
Track laid with steel sleepers can be maintained by tamping machines but not by stoneblowing machines, the working of the stoneblowing and tamping machines has been described further.
It is interesting to note that the treated wood sleeper is the material of choice for the majority of track in the U.S. and that 98% of the 14 million sleepers installed in 1988 were of wood (Anon. 1989). Wood is expected to remain the first choice for sleepers in USA in the near future with concrete sleepers coming second (Wanek 2001). Plastic and composite
Sleepers are spaced below rails so as to spread the wheel loads over an area of ballast large enough to ensure that neither the ballast nor the sub-grade are overstressed (Cope 1993). Slightly different sleeper spacing is used in different railways around the world but the sleeper spacing varies from 500mm minimum to 700mm maximum. In the U.K. sleeper spacing is in the range of 650mm to 700mm (Profillidis 1995, p128) but recently on the Channel Tunnel Rail Link sleeper spacing of 600mm has been used to reduce stresses on ballast and subgrade. Decreased sleeper spacing results in more uniform track response (Selig and Stewart 1982) but decreased spacing below the existing standards will inhibit maintenance and sleeper spacing above existing standards gives increasingly unfavourable response (Selig and Stewart 1982). Thus current industry standards for sleeper spacing already reflect an optimal design considering costs, maintenance procedures and foundation load distribution (Selig and Stewart 1982)
2.4 Ballast
Ballast forms the largest component of ballasted railway track in terms of cost and volume. It is estimated that British rail will be spending approximately £ 136 million per annum on ballast supply alone by 2005, this does not include the cost of placing the ballast (Ball 2003).
The term ballast as a part of railway track originated on Tyneside in the UK. In the Guinness Railway Book (Marshall 1989), John Marshall has said that ships carrying coal away from Newcastle returned ‘in ballast’ laden with gravel and other materials to maintain stability. This ‘ballast’ was dumped by the quays and was used to provide a solid bed for the tramways, which carried the coal. This association of the word ballast with the tramways was continued and was adopted for the railways.
It has been mentioned that early railway engineers aimed at complete rigidity of track by installing track on massive stone blocks laid on level ground (See figure 2.3). Randell (1913) describes the efforts of early engineers who “sought to form a solid bed, by
describes an instance on a railway track between Manchester and Leeds where sleepers were fastened directly to a dressed rock cutting, this track lasted a few weeks. Instead of laying the sleepers directly onto the ground the engineers realised the need for a resilient base to the sleepers, more importantly they realised the need to keep the track top ‘level’
and thus the need for material below the track, which would allow lifting and packing of the track. In many instances a sprinkling of ballast was considered sufficient bed (Randell 1913). Ballast was viewed as a medium for surfacing the track and Ahlf (1995) describes a rule of thumb in early railways that, ‘ballasting and raising of the track should not exceed the amount of lift necessary to restore the surface of the track’ (Ahlf 1995). The material had to be a right of balance of rigidity and elasticity to carry the load of railway traffic without causing damage to the track superstructure components and to be able to distribute the loads to the subgrade. The material had to be free draining to prevent waterlogging of the track. Thus a set of conflicting requirements led to the development of a layer of granular material under the sleepers called ballast. To summarise the ballast functions:
Ballast provides resiliency to the track and distributes stresses from the sleepers to the subgrade. It provides lateral and longitudinal stability to the track and maintains track gauge. The ballast facilitates maintenance and provides immediate drainage of rainwater from the track. As specified by Cope (1993, p312) the above functions are performed in a manner such that the position of the rail:
1. does not, in the loaded condition change with time;
2. returns to its original position after the passage of each train;
3. moves elastically under vehicle loading within tolerable limits for the mechanical design and use of those vehicles.
To perform the above functions ballast depth, size and shape are specified and the best material suited for ballast is also specified. The practice is generally similar in railways around the world with some local variations(Cope 1993, p313).
al 1999). The underlying principle is to have minimum depth of track bed such that pyramids of support from sleeper to subgrade should touch or overlap (see fig. 2.6) (Cope 1993, p313). This ensures that that the loading on the subgrade is uniform. A minimum depth of ballast is also required to facilitate maintenance operations like tamping.
Rail
Sleeper Crib ballast
Ballast depth
Figure 2.6. Stress distribution from sleeper to subgrade
Various design methods have been in use to design ballast depth, early simplistic methods of design have now been replaced by more rational methods of design, which take into account various factors affecting ballast performance. British railways developed a
“threshold stress” design method for the depth of ballast. The design was to limit the stress on subgrade soil to within the ‘threshold stress’ to prevent subgrade failure by excessive plastic deformation (Heath et al 1972).
Selig has described minimum ballast depths for carrying out different ballast functions as given below in Table 2.1 (Selig 1998).
Function Ballast depth
To provide resiliency to track on a subgrade less stiff than the ballast 150mm – 300mm To provide enough ballast for storage of fouling material 300mm – 375mm
To accommodate tamping Around 225mm
To reduce stress on underlying sub ballast or subgrade 150mm – 450mm Table 2.1 Proposed ballast depths by Selig and Waters (1994)
Selig concludes that a minimum of 300mm – 450mm ballast is required below the sleepers and this applies to heavily used track. For lightly trafficked track the ballast depths could be reduced but not below 150mm – 300mm. Selig has defined two granular layers under the sleepers one being the ballast just below the sleepers and the other being the sub ballast between the ballast and the subgrade. Li and Selig (1998) have given methods for design of granular layer thickness in railway tracks which include both the sub ballast and the ballast.
Recommended ballast depths on British rail for various track types are given in table 2.2 (Cope 1993).
Line Speed (km/h) Line Tonnage (tonnes/year) Ballast Depth (mm.)
177 to 201 7 million upwards
Below 7 million
280 230
129 to 169 15 million upwards
Below 15 million
280 230
Below 129 All 150
Table 2.2 Ballast depth on British Railways (Cope 1993)
Recently on the West Coast Mainline an increased ballast depth of 300mm has been adopted to account for variable subgrade conditions (Sharp et al 2002).
deflection of the top table of the rail (Cope 1993, p313). Structurally modelling the rail as a beam on an elastic foundation track modulus can be defined as “ The uniformly distributed line load required to produce unit deflection of the support” (Cope 1993, p313). An elastic ballast with lower track modulus will deflect more under the load and the bending moment in the rail will be high. To limit deflection of the track it is important that the track modulus is fairly high although a stiffer ballast will transmit vibration into the surrounding ground (Cope 1993, p313).
To provide longitudinal stability to the track ballast is filled in the cribs to the top of the sleepers and to provide lateral stability to the track ballast shoulders are formed on sleeper ends to a typical width of 300 – 600mm depending on the type of track. For track with continuous welded rails track shoulders are heaped 125mm above the sleeper top level to prevent buckling of track. To increase the lateral resistance of track a technique called ballast gluing is used on the British Rail (Railtrack 1996). Approved glue materials are used to bind the stones together at their contact points. To increase lateral stability the gluing is carried out only on shoulder ballast. The depth of gluing is typically 200mm and width is 300mm. Maintenance tamping is permissible after gluing provided gluing has been carried out on shoulder ballast only.
It is interesting to note that as early as 1909, Tratman (1909, p25) recommends minimum depth of ballast below the sleepers as 300mm for track with heavy traffic, with well formed shoulders to provide lateral resistance, similar to current practice. In Britain ballast was laid in two layers with bottom layer of ballast (hardcore ballast) being stones 225mm (9inches) in size and top layer being the standard ballast of granite, flints, gravel or slag (Randell 1913, Hamnett 1956) (See figure 2.7). This practice was discontinued in the 1950’s (Hamnett 1956).
Figure 2.7 Details of ballasted track in UK in the early 1900’s with hardcore ballast and top ballast (Hamnett 1956).
2.4.2 Material for ballast
Ballast being the largest component of the permanent way in terms of volume and cost ideally it should be a cheap material capable of being packed (Cope 1993, p314). It is now universally accepted that good quality hard angular stone free from dust and dirt and not prone to cementing action is the best material for ballast. Stone ballast can withstand heavy loads without getting crushed and with a crushed angular rock it is possible to achieve proper frictional interlocking of ballast particles.
Selig (1998) has divided ballast properties into two categories:
a. Individual particles and b. Assembly of particles.
Gradation – is the mean particle size and range of particle sizes.
Selig opines that the normal practice on railways is to put limits on acceptable values of these individual index properties and the problem is that no correlation exists between the ballast index properties and the performance of ballast in the track.
The important properties considering ballast as an assembly of particles are strength, stiffness, resistance to deformation under repeated loading, resistance to flow of water, ease of tamping and voids for storage of fouling materials (Selig 1998). Interestingly these properties change over time as the ballast becomes fouled.
2.4.3 Ballast size
Provided that ballast is good quality durable angular stone, its most important parameter is its size and gradation. Ballast size should be chosen such that it supports the track superstructure, allows for drainage of water, and also lends itself to maintenance for correcting track geometry faults.
The choice for ballast gradation is generally similar in all countries with some local variations but it is interesting to note the difference in the French and the British ballast specifications. Current practice on British rail is to use single size stone with majority of ballast of size 30mm to 50mm. Ballast on French rail is a well graded ballast with stone sizes ranging from 63mm maximum to 15mm minimum with the majority of particles in the size range 20mm to 40mm (Profillidis 1995, p143). French ballast is of a broader gradation with major proportion of the particles being smaller than 40mm (Wood 2002).
This is significantly different from what is used on British rail.
Cope (1993, p315) explains the requirement of optimum particle size distribution of ballast as a balance between a very uniform aggregate which will have a higher percentage of voids and larger voids but lower strength and well graded aggregate which will have less voids but higher strength.
Selig concludes that effect of particle size on strength of ballast is unclear (Selig and Waters 1994, p7.26) but tests seems to suggest that strength of ballast is more for a broader gradation than a uniform gradation and some research suggests that broadly graded ballast of smaller size is stronger than uniformly graded ballast of large size, although results are inconclusive. It was observed that ballast compression (cumulative plastic strain) was higher for a uniformly graded ballast as compared to a broadly graded ballast with a smaller mean size. Determining the optimum choice of ballast specification according to Selig is difficult due to the conflicting particle requirements among the various ballast functions.
One important observation made by Selig, not mentioned by other authors, is that maintenance by tamping of track is better with a narrow range of particle sizes. Triaxial tests carried out by Indraratna et al (1998) seem to suggest that there is more particle breakage in ballast with a broader gradation which is densely compacted.
2.4.4 Ballast fouling and drainage
The term fouling can be broadly defined as the filling up of the voids in ballast with particles of size smaller than 6mm (Selig and Waters 1994, p8.18). New ballast does not contain more than 2% of the particles smaller than 6mm in size (Selig and Waters 1994 – p8.18). Over a period of time the proportion of smaller particles increases and beyond a certain limit the smaller particles prevent ballast from providing - support to the sleepers, drainage of water from the sleepers and a means of correcting track geometry faults. Such ballast is called spent ballast and has to be replaced.
Main sources of fouling are (Selig and Waters 1994, p8.18):
1. Ballast breakdown due to traffic and tamping
2. Infiltration from ballast surface either airborne or delivered with ballast or dropped from trains i.e. fouling due to external sources
3. Sub grade infiltration and
shows that ballast fouling is due to ballast degradation under loads and due to the effect of tamping. 76% of fouling is due to ballast breakage, which could be both from tamping and traffic. The German experience is that majority of ballast fouling is due to external sources of fouling. British Railways have estimated that the maximum contribution to fouling is by the tamping process, this has been discussed in detail in succeeding sections.
Fouling of track, as mentioned earlier, prevents ballast from carrying out its functions but the effect of each fouling material is different (Selig and Waters 1994, p8.31). Selig et al have said that fouling of track by sand and fine gravel size particles increases the shear strength of ballast and increases stability decreasing ballast compression from traffic if coarse ballast particles still form the ballast skeleton. Fouling by sand and gravel also increases frost protection. Track drainage remains adequate until all the voids are filled up although drainage gradually decreases. The problem occurs when fouled track is tamped.
This causes segregation of particle sizes and soon all the voids are filled up. On fouled track alignment by tamping is not durable thus frequent tamping is required increasing maintenance costs and further damaging ballast. Still Selig et al are of the opinion that fouling by coarse sand and gravel particles does not increase maintenance costs significantly. They have said that loss of performance of track usually occurs when fouling materials contain silt and clay size particles (fines). Silt and clay size particles combine with the coarser fouling elements to form an abrasive slurry. This will cause problems like sleeper attrition and increased ballast deterioration. There will be severe loss in drainage of track and ponding water will further worsen the problem. Maintenance of such track with tamping is impossible and as ballast is contaminated with clay it cannot be cleaned but has to be totally replaced.
2.5 Ballast and track geometry deterioration
Most authors are of the opinion that of all the components of the permanent way ballast is the controlling factor of loss of geometry of track (Shenton 1984, Selig & Waters 1994 – p 8.32, Tratman 1909 – p25), if the formation is adequately specified. Ballast in a newly laid track or a track just after routine maintenance operations is compacted under traffic and
geometry develop, commonly known as twist or cyclic top faults (Cope and Ellis 2001, p45). Track geometry deterioration is also the cause of wet spots on track. These geometric faults have been described in detail in succeeding paragraphs.
Both Selig & Waters (1994, p15.10) and Shenton (1984) have mentioned inherent track quality. It has been observed that track has an inherent shape which it acquires at the time of its original construction. A track constructed with level compacted ballast and straight rails has a good inherent quality. Achieving changes in the inherent track shape is very difficult. A track having good inherent quality has a good ride quality while a track with poor inherent quality requires much maintenance (See figure 2.9). For short distances the rail imprints its shape on the ballast while for longer distances the rail bends to the shape of the ballast bed (See figure 2.8). Thus a track constructed with straight rails and level ballast bed with uniform settlement properties will have low rate of deterioration.
Figure 2.8 Inherent track quality – Influence of rail shape (a) and ballast shape(b) (Selig and Waters 1994)
Figure 2.9 Graphs demonstrating frequent maintenance required by inherently poor track (Selig and Waters 1994)
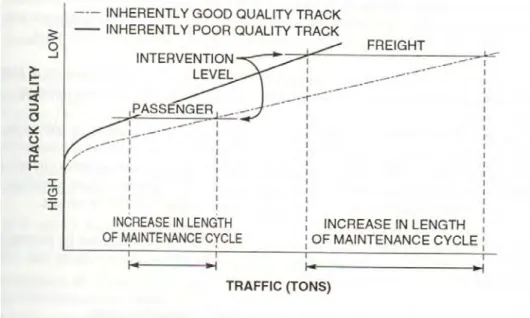
Undulations in the track induce vertical vibrations in passing vehicles and depending on their frequency these vibrations reduce ride quality of track and cause track damage. The minimum geometric quality to which the track has to be maintained is a function of the speed and type of traffic being carried on the track. Tracks carrying high speed or passenger traffic will need to be maintained to a higher geometric quality than will tracks dedicated to low speed and/or freight traffic (Selig & Waters 1994, p15.16). As shown in figure 2.10 maintenance intervention for passenger traffic will be more frequent than for freight traffic.
Also shown is the effect of track inherent quality on maintenance cycle of the track.
Figure 2.10 Graph showing effect of track quality on maintenance cycle and intervention levels for different traffic (Selig and Waters 1994)
2.5.1 Voids below sleeper
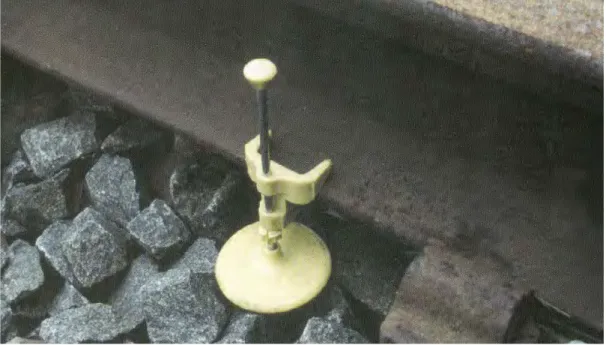
Voids under sleepers are a common occurrence in the railways and are a major cause of track geometry deterioration and ballast degradation. Voids can be detected by watching vertical movement of the sleeper under traffic or by striking the sleeper with a hammer and subsequently measured by installing instruments like void meters on the track (Fig. 2.11). Voided sleepers occur either as single sleepers supported by adjoining sound sleepers or as a group of loose sleepers again supported by adjoining sound sleepers effectively hanging from the rail. A track with a single voided sleeper if not attended to, soon deteriorates to a group of loose sleepers.
Figure 2.11 Showing Pell void meter fixed to bottom flange of the rail (Cope and Ellis 2001)
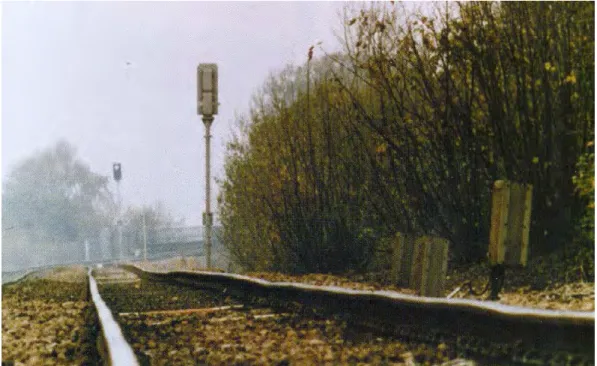
The author while doing his research was living in Coventry in a house adjacent to the Coventry - Nuneaton line and had to pass a level crossing on his way in to work and back home everyday. Thus whenever the level crossing was closed it presented an opportunity to the author to observe the track when the trains passed. On both the up and down lines the author could observe loose voided sleepers and the movement could be estimated to be around 10-15mm. There already was a speed limit of 35 mph in place on that track and looking along the length of the track one could see that there were dips in the track at several locations very similar to a cyclic top fault described further, a photograph of the track is given in figure2.12.
Figure 2.12a Coventry – Nuneaton railway line as seen from level crossing on Coundon Road in Coventry, close to the author’s house. Note the cyclic fault in the track. Speed limit of 35-40 mph is in force on the track as seen in the photograph.
Figure 2.12b Coventry - Nuneaton railway line with cyclic fault.
Similarly on a trip to the Coventry railway station by the author and his supervisor many loose sleepers were observed and on jointed track close to the railway station the sleeper movement was excessive with voids below the sleepers estimated to be more than 15mm. Thus voided sleepers seems to be a common but serious maintenance problem on British Rail network.
Cope and Ellis (2001, p206) has given a detailed description of problems occurring due to voids under the sleepers, which is not discussed in as much detail in any other literature on Railway Track. One of the reasons might be the fact that modern track geometry recording cars measure the loaded profile of the track and thus are not able to differentiate between a track surface irregularity and voids below sleepers as both track defects appear as a similar distortion on the output data of the track geometry recording cars. Cope et al have discussed at length the track defects occurring as a result of voids in ballast below the sleepers. Voids below sleepers lead to development of wet spots, cyclic tops or bad tops and aggravate the effect of twist faults. Voids below sleepers can be easily identified by white powder around the sleepers and rounding of ballast particles in wooden sleepers (See figure 2.13). In concrete sleepers again tell tale signs are white powder around the sleepers and less angular ballast on the upper surfaces (See figure 2.14).
Problems due to voids below sleepers are usually the cause for problems to other track component like loose or missing fittings, missing rail pads, rail weld failure, failure of joints in a jointed track etc. Thus it is important to keep the rail bearing portion of each sleeper well packed and free from voids (Cope and Ellis 2001 – p206, Tazwell 1928, Frazer 1938, Tratman 1909).
Figure 2.13 Voids below wooden sleeper identified by white powder around the sleepers
Figure 2.14 Voids below concrete sleeper again identified by white powder around the sleeper.
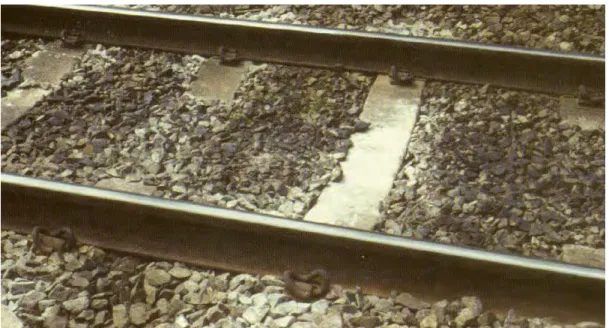
2.5.1.1 Wet spots and ballast failure
Cope et al mentions that the most common form of ballast failure is the wet spot or slurry spot, although this perhaps relates to track conditions within the U.K. This occurs where sleepers are poorly packed. When the wheel passes over a loose sleeper it causes the sleeper to impact the ballast damaging the soffit of the sleeper and also causing ballast breakage in that area. The powdered concrete produced due to sleeper damage and particles of stone broken from the ballast, mix with rain water and form a lean mix concrete which in dry weather sets in the form of a trough around the affected sleepers which then helps retain water around the sleepers (Cope and Ellis 2001 – p225, Selig and Waters 1994 – p8.30) (See figures 2.15, 2.16, 2.17, 2.18). The process is self perpetuating if the problem of voids below the sleepers is not corrected and spreads to adjacent sleepers quickly. If only under one rail the slurry spot indicates a twist fault but if under both rails it can lead to development of a cyclic top. It is not possible to correct a track with wet spot by regular maintenance and if in an advanced stage (Figure 2.18) the only solution is track possession and repair or replacement.
Figure 2.15 Wet spot with water ponding in the crib (Ball 2003)
Figure 2.16 An advanced stage of wet with voided sleepers and fouled ballast (Ball
Figure 2.17 Wet spot damage to the sleepers, observe the ballast displaced out of the cribs (Selig and Waters 1994)
Figure 2.18 An advanced stage of wet spot which will require ballast renewal (Cope and Ellis 2001)
Wet spots are one of the major maintenance problems on British Rail. Ball reports that there are 3642 wetbeds in the West Midlands area of the UK over track length of 359 miles (Ball 2003). Ball estimates that there are approximately 173540 wetbeds across the railway network in the U.K. Network Rail has theoretically limited the maximum voiding below sleepers to 7mm but this level of compliance is not possible in all locations and thus a larege proportion of the track remains substandard waiting for renewal (Ball 2003).
the train on the curve. On curved track one rail is positioned higher than the other intentionally and this is called cant transition in railway terminology. A cant transition can develop unintentionally in case of badly supported sleepers, this type of fault is called twist fault. Voids below sleepers along with minor faults in track vertical geometry will accelerate the development of twist faults (Cope and Ellis 2001, p45).
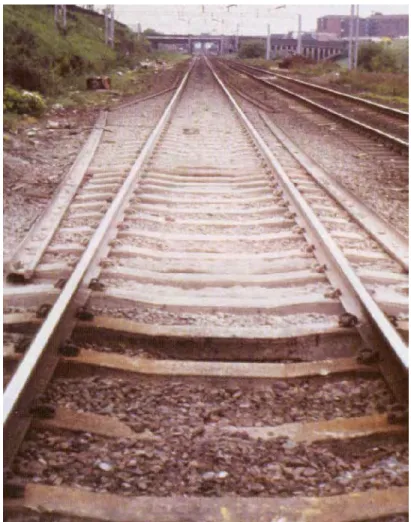
A cyclic top is a series of dips and humps at regular intervals on the track (See figure 2.19 and 2.20). Cyclic top causes vehicles to bounce while travelling over the dips and in extreme cases can cause derailment (Cope and Ellis 2001, p48). Voids under the sleepers can be the direct cause for cyclic tops but it is also usual for wet spots to lead to development of cyclic tops thus voids below sleepers indirectly causing cyclic top.
Figure 2.19 Cyclic top in continuous welded track. In extreme cases these dips can cause vehicle derailment (Cope and Ellis 2001)
Figure 2.20 Dipped joints caused by insufficient packing of ballast below joints (Cope and Ellis 2001)
Both the above conditions can be detected by track geometry recording machines and should be treated before they exceed their allowable limits.
2.5.1.3 Track geometry measurement and analysis
To maintain track ride quality within acceptable limits for the passengers and to
Track quality measurement is carried out by track inspection cars and the use of these cars can be traced back to the 1920’s in France when the ‘hallade’ system was used for track recording (Cope 1993, p487). Prior to the 1920’s the track quality was assessed by visual inspection of the track and observing voided sleepers moving under the track. Since the 1970’s British Rail Research has developed track geometry recording cars with on board computer systems for recording and analysing data, these are known as High Speed Track Recording Cars (HSTRC) (Figure 2.21). These cars are operated over the entire railway network periodically at set intervals to record the condition of track geometry. The output then forms the base for planning and carrying out railway maintenance. It also generates a number of key performance indicators, which allows monitoring of track maintenance being carried out.
Figure 2.21 High speed track recording car capable of recording at speeds of 125miles per hour (Cope and Ellis 2001)
The HSTRC makes use of an inertial system of measurement which makes use of the displacement arising from the inertia of a spring mounted mass in an accelerometer to sense
fixed to a railway vehicle this arrangement provides a reference line form which vertical and horizontal track profile measurements can be made. Displacement sensors across the suspension are used for vertical profile measurements while optical sensors are used to measure the horizontal profile (Cope 1993, p488). Additional instrumentation is used to measure cross level, curvature, gradient and corrugation amplitude. The magnitude of track irregularities is obtained in the form of standard deviation of the vertical and horizontal profiles. Standard deviation of track provides a convenient way of quantifying the track geometric quality. Standard deviation is calculated as the square root of the mean of the squares of the individual data samples, each of which represents a departure from an assumed mean whose value is zero. A standard deviation of zero corresponds to a perfect track and maximum reported value of 9.9mm corresponds to an extremely poor quality. A scale of intermediate values is thus available to specify the quality of all classes of line (Cope 1993, p500). Figure 2.22a shows a track with poor geometric quality, standard deviation 6.8mm and 2.22b shows the same track after maintenance, standard deviation 3.1mm.
Figure 2.22a Track with poor geometric quality – Standard deviation 6.8mm
Figure 2.22b Track geometric quality restored by maintenance, standard deviation 3.1mm 2.6 Track Maintenance