Quality of Life:
Assessment for Transportation Performance Measures
Ingrid E. Schneider, Pricipal Investigator Department of Forest Resources
University of Minnesota
January 2013
Research Project Final Report 2013-05
To request this document in an alternative format, please contact the Affirmative Action Office at 651-366-4723 or 1-800-657-3774 (Greater Minnesota); 711 or 1-800-627-3529 (Minnesota Relay). You may also send an e-mail to [email protected].
(Please request at least one week in advance).
Technical Report Documentation Page
1. Report No. 2. 3. Recipients Accession No.
MN/RC 2013-05
4. Title and Subtitle 5. Report Date
Quality of Life: Assessment for Transportation Performance January 2013
Measures 6.
7. Author(s) 8. Performing Organization Report No.
Ingrid E. Schneider, Tian Guo, and Sierra Schroeder
9. Performing Organization Name and Address 10. Project/Task/Work Unit No.
Department of Forest Resources CTS Project #2011009
University of Minnesota 11. Contract (C) or Grant (G) No.
1530 Cleveland Avenue North
St. Paul, MN 55108 (C) 89261 (G) 198
12. Sponsoring Organization Name and Address 13. Type of Report and Period Covered
Minnesota Department of Transportation Final Report
395 John Ireland Boulevard, MS 330 14. Sponsoring Agency Code
St. Paul, MN 55155
15. Supplementary Notes
http://www.lrrb.org/pdf/201305.pdf
16. Abstract (Limit: 250 words)
Quality of life (QOL) is a commonly used term. Defining QOL, however, is an ongoing challenge that experts often take on with minimal input from citizens. This groundbreaking research sought citizen input on what comprised QOL and what role transportation played in it. Further, this research explored in detail the important factors across the breadth of transportation and how the Minnesota Department of Transportation (MnDOT) was performing on these important factors. The research encompassed three phases between 2010 and 2011: (1) an extensive literature review on QOL, (2) 24 focus groups that asked Minnesota’s citizens about their QOL, and (3) a mail questionnaire about what matters in quality of life, transportation and their intersection. Eleven related quality of life factors emerged, including transportation: education, employment and finances, environment, housing, family, friends and neighbors, health, local amenities, recreation and entertainment, safety, spirituality/faith/
serenity, and transportation. Within transportation, seven important areas were identified that predicted satisfaction with MnDOT services: access, design, environmental issues, maintenance, mobility, safety and transparency.
Results reveal that a) QOL is complex and transportation plays an important and consistent role in it across Minnesota; b) transportation is critical to QOL because it connects us to important destinations in aspects that matter most; and c) Minnesotans can readily identify what matters and how the state is performing within the breadth of transportation services.
17. Document Analysis/Descriptors 18. Availability Statement
Access, Mobility, Safety, Maintenance, Design, Communications, No restrictions. Document available from:
Planning, Transparency, Focus groups, Questionnaires, National Technical Information Services, Segmentation, Factor analysis, Bicycling, Pedestrians, Active Alexandria, Virginia 22312
Quality of Life: Assessment for Transportation Performance Measures
Final Report
Prepared by:
Ingrid E. Schneider Tian Guo Sierra Schroeder
Department of Forest Resources University of Minnesota
January 2013
Published by:
Minnesota Department of Transportation Research Services
395 John Ireland Boulevard, MS 330 St. Paul, Minnesota 55155
This report documents the results of research conducted by the authors and does not necessarily represent the views or policies of the Minnesota Department of Transportation or the University of Minnesota. This report does not contain a standard or specified technique.
The authors, the Minnesota Department of Transportation, and the University of Minnesota do not endorse products or manufacturers. Trade or manufacturers’ names appear herein solely because they are considered essential to this report.
Acknowledgments
We would like to extend our deepest appreciation to the citizens who participated in the focus groups and who completed the questionnaires. Without their participation, the project would not be possible. The extensive guidance and insight provided by Karla Rains and the Technical Advisory Panel was essential to project success. For the performance measures element, Deanna Belden was essential. Further, the financial and logistical support provided by the Minnesota Department of Transportation for this work is gratefully acknowledged. Thank you to Kent Gustafson and Sierra Schroeder, who did fantastic facilitation of the focus groups, and Lisa Filter for reviewing the focus group elements as well as for assistance with qualitative data review. We recognize Lilly Willenstein for assistance with qualitative data entry. Finally, a thank you to the University of Minnesota Center for Transportation Studies staff for support in project
implementation and Clara Schreiber in the Department of Forest Resources for formatting this report.
Table of Contents
Chapter 1. Introduction ... 1
1.1 Purpose and Objectives ... 1
1.2 Approach ... 1
Chapter 2. Literature Background ... 2
2.1 Quality of Life... 2
2.1.1 Measuring Quality of Life ... 2
2.1.2 Predicting and Understanding Variance in Perceived Quality of Life ... 2
2.2 Quality of Life and Transportation ... 6
Chapter 3. Focus Groups ... 9
3.1 Study Method ... 9
3.1.1 Approach ... 9
3.1.2 Study Setting... 10
3.1.3 Sampling ... 10
3.1.4 Data Analysis ... 10
3.2 Results ... 11
3.2.1 Quality of Life ... 11
3.2.2 Transportation System and Quality of Life ... 12
3.2.3 Transportation System and Quality of Life: Comparisons by Age Group ... 14
3.2.4 Transportation System and Quality of Life: Metropolitan Area and Non-Metro Minnesota ... 15
3.2.5 Transportation System and Quality of Life: Findings among Select Ethnically Diverse Groups ... 16
3.2.6 Transportation System and Quality of Life: Communications ... 16
3.3 Transportation System and Quality of Life: Future Needs ... 17
Chapter 4. Questionnaire Study ... 19
4.1 Study Method ... 19
4.1.1 Data Collection ... 19
4.1.2 Measures ... 20
4.1.3 Data Analysis ... 22
4.2 Results ... 24
4.2.1 Response Rate ... 24
4.2.2 Research Questions ... 25
4.2.3 MnDOT Priorities, Short and Long Term... 52
4.2.4 Demographic Profile and Community Experience ... 52
4.3 Discussion and Conclusions ... 59
4.3.1 How Does Transportation Contribute to Satisfaction with Quality of Life Among Minnesotans? ... 59
4.3.2 If/How Does Satisfaction with Transportation Areas (Access, etc.) Contribute to Satisfaction with Transportation Overall? ... 60
4.3.3 Transportation Area Importance, Satisfaction, and Performance ... 60
4.3.4 Opportunities ... 61
Chapter 5. Performance Measures Review ... 62
5.1 Methods... 62
5.1.1 Existing Measures ... 62
5.1.2 Customer Quality of Life Data ... 62
5.1.3 Collaborative Team Discussions ... 62
5.1.4 Results ... 63
5.1.5 Discussion and Implications ... 66
References ... 68 Appendix A: Focus Group Discussion Guide
Appendix B: Focus Group Schedule
Appendix C: Focus Group Telephone Screener
Appendix D: Focus Group Categories – Definitions, Subthemes, and Examples Appendix E: Survey Questionnaire
Appendix F: Postcard Reminder
List of Tables
Table 2.1: Significant predictors of quality of life in various studies, 2011 ... 4
Table 2.2: Significant predictors of quality of life by different travel modes (Arlington County 2007) ... 6
Table 2.3: Quality of life related performance measurement among departments of transportation, 2011 ... 7
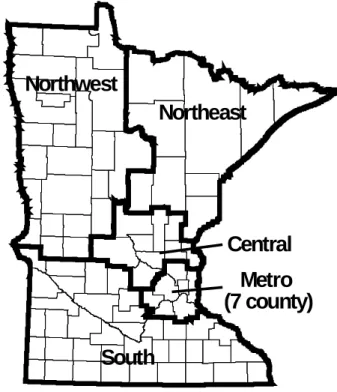
Table 4.1: Counties identified and regions used for data acquisition, Minnesota, 2011 ... 20
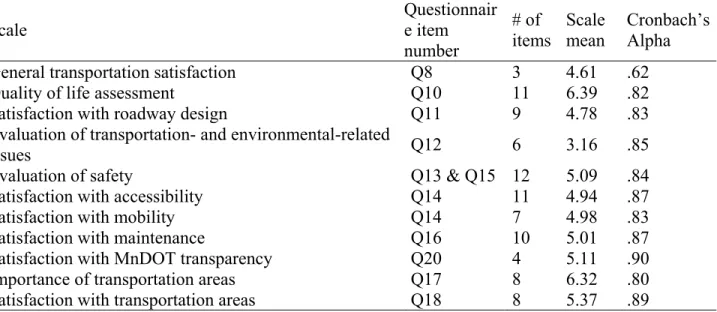
Table 4.2: Item and scale statistical summary for predictor variables, Minnesota, 2011 ... 21
Table 4.3: Response rate of quality of life and transportation survey, Minnesota, 2011 ... 25
Table 4.4: State population distribution compared to sample representation, Minnesota, 2011 . 25 Table 4.5: Importance of various quality of life areas among Minnesotans, 2011 ... 27
Table 4.6: Stepwise regression analysis explaining the variance in quality of life among Minnesota residents, 2011 ... 29
Table 4.7: Stepwise regression analysis explaining the variance in quality of life among Minnesota residents of varying age groups, 2011 ... 30
Table 4.8: Stepwise regression analysis explaining the variance in quality of life for commuters and noncommuters in Minnesota, 2011 ... 30
Table 4.9: Stepwise regression analysis explaining the variance in quality of life among people with disabilities in Minnesota, 2011 ... 31
Table 4.10: Stepwise regression analysis explaining satisfaction with MnDOT services, 2011 . 31 Table 4.11: Stepwise regression analysis explaining commuter satisfaction with MnDOT services, 2011 ... 32
Table 4.12: Stepwise regression analysis explaining satisfaction with MnDOT services among people with disabilities, 2011 ... 32
Table 4.13: Importance of transportation areas among Minnesota residents, 2011 ... 35
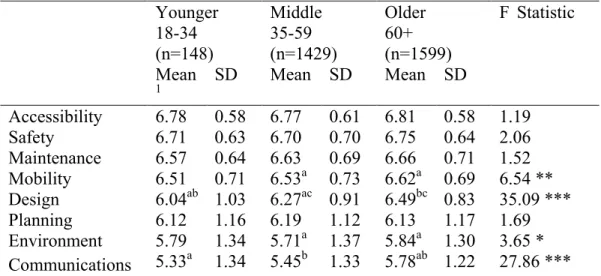
Table 4.14: Analysis of variance comparing importance of transportation areas among age groups, 2011 ... 36
Table 4.15: Differences in importance of transportation areas between commuters and noncommuters in Minnesota, 2011 ... 37
Table 4.16: Satisfaction with transportation areas among Minnesota residents, 2011 ... 38
Table 4.17: Satisfaction with transportation areas among different age groups in Minnesota, 2011... 41
Table 4.18: Differences in satisfaction with transportation areas between commuters and
noncommuters in Minnesota, 2011 ... 41 Table 4.19: Factor analysis of quality of life areas, Minnesota, 2011 ... 52 Table 4.20: Percent of open-ended respondents’ ideas for short- and long-term MnDOT
priorities, 2011. ... 53 Table 4.21: Demographics of respondents to transportation and quality of life questionnaire in Minnesota, 2011 ... 54 Table 4.22: Residential experience among respondents to questionnaire, 2011 ... 58 Table 4.23: Frequency of travel modes for various trip purposes in Minnesota, 2011 ... 58 Table 4.24: Commute travel frequency and length among respondents to questionnaire, 2011 . 58 Table 5.1: Existing performance measures and customer-identified important transportation areas ... 63 Table 5.2: Stepwise regression analysis explaining the variance in satisfaction with
transportation Minnesota, 2011 ... 66 Table 5.3: Factor analysis of 11 significant predictors of satisfaction with MnDOT services, Minnesota, 2011. ... 66
List of Figures
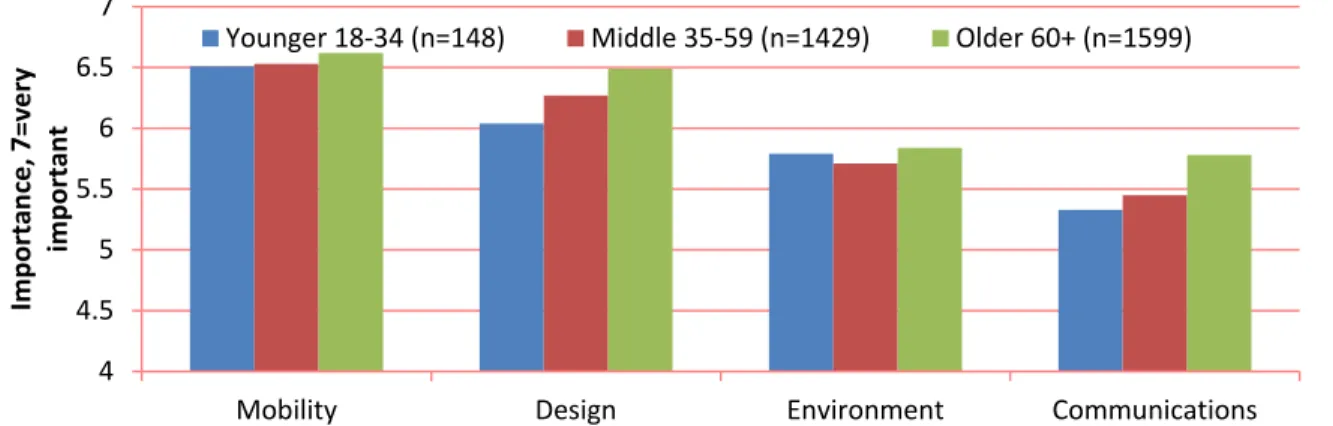
Figure 4.1: Regions identified and used for data acquisition and analysis ... 19 Figure 4.2: Mean importance of quality of life areas among Minnesotans, 2011. ... 26 Figure 4.3: Percent of respondents reporting life area as one of most important. ... 26 Figure 4.4: Diagram illustrating relative contribution of various life dimensions to explain overall quality of life among Minnesotans, 2011. ... 28 Figure 4.5: Diagram illustrating relative contribution of various transportation areas to explain satisfaction with MnDOT services among Minnesotans, 2011. ... 32 Figure 4.6: Importance of transportation areas among Minnesota residents, 2011. ... 33 Figure 4.7: Qualitative assessment of most important transportation areas in Minnesota, 2011. 34 Figure 4.8: Importance of transportation areas by region, Minnesota 2011. ... 34 Figure 4.9: Differences in importance of transportation areas by age groups in Minnesota 2011.
... 36 Figure 4.10: Satisfaction with transportation areas among Minnesota residents, 2011. ... 37 Figure 4.11: Differences in satisfaction with transportation areas by regional residence among Minnesotans, 2011. ... 40 Figure 4.12: Differences in satisfaction with transportation areas by age group among Minnesota residents, 2011. ... 42 Figure 4.13: Importance and performance analysis plot of transportation areas among Minnesota residents, 2011. ... 43 Figure 4.14: Importance and performance analysis for transportation areas in metro Minnesota, 2011... 44 Figure 4.15: Importance and performance analysis for transportation areas in central Minnesota, 2011... 45 Figure 4.16: Importance and performance analysis for transportation areas in northeast
Minnesota, 2011. ... 46 Figure 4.17: Importance and performance analysis for transportation areas in northwest
Minnesota, 2011. ... 47 Figure 4.18: Importance and performance analysis for transportation areas in southern
Minnesota, 2011. ... 48 Figure 4.19: Importance and performance analysis for transportation areas for younger group in Minnesota, 2011. ... 49
Figure 4.20: Importance and performance analysis for transportation areas for middle-aged group in Minnesota, 2011. ... 50 Figure 4.21: Importance and performance analysis for transportation areas among older-aged group in Minnesota, 2011. ... 51 Figure 4.22: Number of people and autos per household in Minnesota, 2011. ... 55 Figure 4.23: Percentage of people reporting a disability. ... 56 Figure 4.24: Percentage of respondents self-identified as commuters or non-commuters in Minnesota, 2011. ... 56 Figure 4.25: Average commute distance in miles by region in Minnesota, 2011. ... 57 Figure 4.26: Distribution of number of days a week traveling to work in Minnesota, 2011. ... 57
Executive Summary
Quality of life (QOL) is a commonly used term. Defining QOL, however, is an ongoing challenge that experts often take on with minimal input from citizens. This groundbreaking research sought citizen input on what comprised QOL and what role transportation played in it.
Further, this research explored in detail the important factors across the breadth of transportation and how the Minnesota Department of Transportation (MnDOT) was performing on these important factors. Results will inform MnDOT planning, reporting, programming, and services.
The research encompassed three phases between 2010 and 2011: (1) an extensive literature review on QOL, (2) 24 focus groups that asked Minnesota’s citizens about their QOL, and (3) a mail questionnaire about what matters in quality of life, transportation and their intersection.
Results reveal: QOL is complex and transportation plays an important and consistent role in it across Minnesota; transportation is critical to QOL because it connects us to important
destinations in aspects that matter most; and Minnesotans can readily identify what matters and how the state is performing within the breadth of transportation services.
Seeking Citizen Input
The focus groups provided a wealth of information about what constituted QOL. To quantify the importance of different parts of QOL and transportation identified in the focus groups, we used a mailed questionnaire to a representative sample of 7,488 Minnesota residents, stratified by county. Considering traditional survey research responses, an impressive 45% of questionnaires (n=3,484) were returned. Those responding largely mirrored Minnesota although, as we expect in mail survey research, respondents were more frequently older, educated and white. The following information summarizes the key survey findings related to the project goals.
Results
The Quality of Life Context
Overall, Minnesotans are satisfied with their QOL. The average level of satisfaction was nearly 6.15 on a scale from 1 to 7, with 7 being “very satisfied.” Eleven QOL areas were examined:
education, employment and finances, environment, housing, family, friends and neighbors, health, local amenities, recreation and entertainment, safety, spirituality, faith and serenity, and transportation. All QOL areas were rated as important at some level, including transportation.
Notably, transportation held similar importance across all regions of Minnesota. Older
Minnesotans rated education and employment as less important than those in the younger group.
In contrast, older Minnesotans rated transportation, spirituality, and local amenities and services as more important than those in younger groups. Considering QOL importance by region of residence, differences emerged in six of the areas. Generally, residents in the northeast identified all six of these areas as less important than others in the state.
The eleven QOL areas were analyzed to see if and how they related. The factor analysis revealed the QOL areas fell into 3 broad groups: 1) health, family, and friends; 2) education, environment, employment, transportation and housing; 3) local services/amenities and recreation; with
spirituality/faith/serenity remaining on its own.
Transportation Importance and Satisfaction
When Minnesotans described transportation, they talked about it across several major areas (in alphabetical order): access, design, environmental issues, maintenance, mobility, safety and transparency. Accessibility refers to access to destinations or people’s ability to reach the destinations they must visit to meet their needs and desire to visit to satisfy their wants.
Design describes the physical layout of the transportation system and includes the multiple components that make up the system (e.g. roads, signs, and lights). Environmental issues include air, water, and light. Maintenance is a broad category that describes road surfaces, paint
indicators, general repair, and seasonal upkeep. Mobility is defined as the movement of people from one place to another in the course of everyday life. Safety emerged as a primary category in discussing transportation related QOL indicators. Multiple safety elements exist: physical
conditions, human behavior, and the interaction among these factors. Transparency included subthemes of communication, finances and planning.
Minnesotans deemed all transportation areas evaluated as important—5.6 and above on a 7-point scale. Much like the older participants found transportation more important than those in younger groups, they also identified specific transportation areas as more important: design, mobility, communications and environmental issues.
Overall, respondents were satisfied with MnDOT services, with a total of 84% satisfied at some level. Considering satisfaction by age, older residents were consistently more satisfied with MnDOT performance in all transportation areas than the other age groups. When region of residence is taken into account, differences in satisfaction with MnDOT performance emerged in all transportation areas except accessibility. The differences varied by region.
Examining gaps between importance and satisfaction, four of the eight transportation areas were rated as MnDOT performing ‘good work’: accessibility, safety, mobility, and design. Planning, environment, and communications appeared in the ‘lower emphasis,’ while maintenance was in the ‘concentrate here’ area. MnDOT’s performance on six of eight transportation areas was rated as satisfactory when using a cutoff of 5 on a 7-point satisfaction scale. However, maintenance and planning fell below the 5 level.
To further understand what comprised satisfaction in the important areas of maintenance, respondents rated a number of aspects in each area. Six of the ten items received satisfactory evaluations: visible highway signs, clearing roads of ice and snow, clear pavement/road markings, rest area for road trips, roadside visual appeal, and clearing roads of debris. When these items were used to predict satisfaction with maintenance, the following were significant predictors: smooth road surface, clearly visible road and pavement markings, the visual appeal of the road, clearing road debris, and rest areas for road trips. Notably, visible highway signage, clearing sidewalks of snow, eliminating weeds, and removing litter did not predict satisfaction with maintenance at the state level. However, additional analysis revealed the very high importance of snow and ice removal for roads and its relationship with smooth road surface.
planning, accessibility, design, safety, communication and mobility. Environment was not a significant predictor in this model. This model also generally held true for commuters.
Performance Measure Consideration
Comparisons of existing measures with items deemed important by a representative sample of Minnesotans revealed MnDOT is measuring many things that matter to Minnesotans,
consistency exists among the data when identifying the most important elements to satisfaction with transportation, and 11 items can explain half the variance in satisfaction with transportation.
As such, results from the consumer data affirm many existing measures but offer the opportunity to adjust select reporting and performance indicators. Such adjustments, however, must consider the breadth of factors influencing performance and reporting requirements such as budgetary issues and federal reporting requirements.
Considering all of the performance measures MnDOT reported as of 2011, most were identified as important by Minnesotans. Gaps in what appeared important to project respondents and existing publicly reported indicators existed in safety, the environment, and transparency.
Opportunities
A variety of implications and opportunities for transportation emerge from these results, several of which are highlighted below.
Maintain, Map and Maximize Partnerships
Across Minnesota it is clear that transportation plays an important and consistent role in QOL.
However, transportation is one of eleven areas of QOL. As such, connecting and integrating with relevant partners is essential. Certainly MnDOT already has a number of vibrant partnerships in areas most important to Minnesota. Investigating and implementing ways to maximize those partnerships toward seamless and comprehensive services can enhance MnDOT’s role in quality of life as well as Minnesotans’ satisfaction with QOL.
Attention to maintenance opportunities are very clear. Predictive analysis revealed smooth road surface, clear road and pavement markings, the visual appeal of the road, clearing road debris, and rest areas for road trips predicted satisfaction with maintenance statewide.
Planning is part of a larger ‘transparency’ area that was identified as a lower emphasis area for the current time period, but does appear to increase as a priority for the future. Notably, at the time of the survey MnDOT was embarking on a 50-year transportation planning process.
Certainly residential choice, work patterns, and multimodal developments are important factors for future planning processes.
Given the aged are a large and growing percent of the population, their higher satisfaction with transportation is important to note and retain. Identifying and attending to changing
transportation needs through individual life stages is a pressing issue in Minnesota and the U.S.
as a whole. Similarly, the role transportation plays for non-white residents and new immigrants is important but under-researched. Ensuring diverse voices are incorporated into MnDOT programs and planning can strengthen them now and for the future.
Chapter 1. Introduction
‘Quality of life’ (QOL) is increasingly of interest among transportation officials and academics alike. Despite this interest, research on QOL and transportation is in its infancy. Therefore, an opportunity exists to improve transportation planning and management as well as advance transportation knowledge as it relates to QOL. Assessing Minnesotans’ content and importance of QOL and how it relates to transportation can inform the Minnesota Department of
Transportation (MnDOT) program and service delivery.
1.1 Purpose and Objectives
This study assessed and evaluated transportation-related QOL indicators and the role of MnDOT programs and services in QOL. Three interrelated approaches were undertaken: (1) a literature review (Guo and Schneider 2010), (2) focus groups (Schroeder, Schneider, and Gustafson 2011), and (3) a questionnaire.
Specifically, the project sought to answer five questions:
• If/how does transportation contribute to satisfaction with QOL among Minnesotans?
• If/how does satisfaction with transportation areas (access, etc.) contribute to satisfaction with transportation overall?
• How important is each of the transportation areas (access, etc.)?
• How satisfied are Minnesota residents with each of the transportation areas (access, etc.)?
• How does perceived MnDOT performance compare with perceived importance on each of the transportation areas (access, etc.)?
1.2 Approach
A multiple-methods approach provided data for the project. Both focus groups and a
questionnaire were used. Focus groups asked Minnesotans to describe the depth and breadth of the QOL concept and the relationship between transportation and QOL. A questionnaire
quantified the concepts identified in focus groups: importance of eleven QOL areas, importance and satisfaction with seven transportation areas, and satisfaction with MnDOT services. The data was combined to inform a comprehensive review of MnDOT performance indicators to assess if and how they could better reflect the concerns of Minnesotans.
Chapter 2. Literature Background
Quality of life (QOL) research within and beyond transportation is briefly reviewed in this section. Researchers with diverse interests have explored QOL with a variety of methodologies.
Within QOL research, however, attention to the role transportation plays in QOL remains scant.
2.1 Quality of Life
QOL has been of research interest since the 1960s. As an indicator of the health and function status of individuals and society (Campbell, Converse, and Rodgers 1976; WHOQOL 1998; Das 2008; Sarmiento, Schmid, Parra, Diaz-del-Castillo, Gomez, Pratt, Jacoby, Pinzon, and Duperly 2010), QOL has been studied in various areas including health care (Ferrans 1996; WHOQOL 1998; Moons, Budts and Geest 2006; Sarmiento et al. 2010), gerontology (Gabriel and Bowling 2004; Spinney, Scott, and Newbold 2009), public affairs (Das 2008; Senlier, Yildiz, and Aktas 2009), and community development (Sirgy, Rahtz, Cicic, and Underwood 2000). QOL has been operationalized in a variety of ways (Ferrans 1996; Moons et al. 2006) yet with a shared focus on perceived well-being. Well-being, happiness, life satisfaction, and living standard are used interchangeably in QOL research (Diener, Emmons, Larsen, and Griffin 1985).
2.1.1 Measuring Quality of Life
As early as the 1960s, Cantril (1965) explored people’s concerns with QOL. In the 21st century, life domain selection is often highly research-context specific (Malkina-Pykh and Pykh 2008).
Campbell et al. (1976) measured general QOLas well as specific domains that included marriage, family life, health, neighborhood, friendships, housework, and job. Similarly, Sirgy et al. (2000) studied general QOL with 14 domains including job situation, financial situation, health,
education, leisure life, environment, housing situation, and spiritual life. The World Health Organization’s WHOQOL-100 and WHQOL-Brief questionnaires assess six QOL domains, with various subdimensions: (1) physical, (2) psychological, (3) level of independence, (4) social relationship, (5) environment, and (6) spirituality/religion/personal beliefs (WHOQOL 1998).
Among them, the environmental domain includes transport, work satisfaction, home
environment, health and social care, participation in and opportunities for recreation/leisure activities, and physical environment. In their study, the Cronbach’s α for the four-item transportation scale was .83.
Hagerty, Cummins, Ferriss, Land, Michalos, Peterson, Sharpe, Sirgy, and Vogel’s (2001) review of the 22 most frequently used QOL indices suggest seven domains for future research:
relationship with family and friends, emotional well-being, material well-being, health, work and productive activity, feeling part of one’s local community, and personal safety. However, they also suggested that “supplementary domains may be important to particular populations”
(Hagerty et al. 2001, p.75).
2.1.2 Predicting and Understanding Variance in Perceived Quality of Life
Conclusive predictive models for QOL remain absent in the published literature. Existing empirical studies that attempt to predict QOL find mixed predictive power and varied sets of
important domains (London, Crandall, and Seals 1977; Michalos and Zumbo 1999; Sirgy et al.
2000; Turksever and Atalik 2001; Kapteyn, Smith, and Soest 2009; Senlier et al. 2009; Power, Bullinger, and Harper 1999; Table 2.1). London et al. (1977) found studied how job and leisure life predicted 25% of the variation in general QOL. In Turksever and Atalik’s (2001) study on QOL in seven city districts, the predictive power (R-squared) for each city district ranged from 16.6% to 99.6% and the predictive power for the general model for the city was 32.6%. Michalos and Zumbo (1999) also found differences in the QOL model’s predictive power where it
explained 49% and 53% of the variation in life satisfaction among rural seniors and university students.
Satisfaction with transportation was a significant predictor of QOL for seniors but not for university students. From a different point of view, Chamberlain (1985)’s early research found an association between QOL and basic life values.
Like the predictive power varies, so do significant predictors of QOL (Table 2.1). For example, London et al. (1977) found four significant predictors to QOL: (1) things done with family, (2) things done with friends, (3) the work itself, and (4) pay, fringe benefits and security. Michalos and Zumbo (1999) also found job opportunities were significant predictors of QOL. However this is not equated with income as Kapteyn, Smith, and Soest (2009) identified income was the least important determinant of global life satisfaction, compared to other predictors. Education has unclear impacts on QOL: Michalos and Zumbo (1999) found that it was not a significant QOL indicator but Senlier et al. (2009) did. Power, Bullinger, and Harper’s (1999) cross-culture test of the WHO’s instrument found two major domains explained the most QOL variance:
physical and psychological. Using a different method, Doi, Kii, and Nakanishi (2008) quantified the weights of five life areas and found “service and cultural opportunity” had the largest weight followed by “environmental benignity,” and “safety and security”, “spatial amenity” and
“economic opportunity.”
Similarly, while intuitively the importance of life domains differ by age and circumstance (Hu 2009), as of the 1990s few studies included these distinctions (Cummins, Mccabe, Romeo, and Gullone 1994). Even into the 21st century, few studies have addressed this issue. Instead, research has tended to focus on single age groups. For example, Gabriel and Bowling’s (2004) focus-group study with individuals age 65 and older found several QOL themes were important, including access to local facilities and services, transportation, good health and mobility, good social relationships, help, and support.
Like the paucity of QOL studies by age groups, few research studies compare QOL across different geographic locations. At a national level, Kapteyn, Smith, Soest, and Netspar (2009) compared global life satisfaction in the Netherlands and the U.S. They found that family and social relations best predicted global life satisfaction, followed by job/daily activity, health, and income. At the local level, Moller (2001) identified differences in perceived QOL and
satisfaction with public service among residents in Durban, South Africa’s living areas.
Suburban residents reported significantly higher satisfaction with QOL than those in townships
in three of Istanbul’s seven districts, but it was not a significant predictor at the city level. At the city level, “travel to work” significantly predicted QOL but it was not significant at any district level. The number of predictors between geographic levels was also different: some districts had only two significant predictors of QOL while others had five significant predictors.
Table 2.1: Significant predictors of quality of life in various studies, 2011 Author
(Year) Population Variance explained (R2)
Significant predictors Not significant predictor
London et
al. (1977) U.S. adults .25 Things done with family, Things done with friends, The work itself, and Pay, fringe benefits and security.
The people you work with, What it is like where you work, What you have available for doing your job, The people you see socially, The organizations you belong to, The sports and recreation facilities you yourself use, or would like to use, The entertainment you get from tv, radio, movies, and local events and places Michalos
and Zumbo, (1999) a
University clerical
staff .57 Health, Financial security, Family relations, Job, Friendships, Housing, Recreation activity, Self- esteem, Transportation, and Education
Area lived in
Rural seniors .49 Health, Financial security, Family relations,
Friendships, Housing, Area lived in, Recreation activity, Religion, Self- esteem, Transportation, Government services, Living partner
-
Eastern northern
community .53 Health, Financial security, Family relations,
Friendships, Housing, Area lived in, Recreation activity, Religion, Self- esteem, Transportation, Government services, Living partner
Job
University of
Guelph students .53 Health, Financial security, Job, Family relations, Friendships, Housing, Recreation activity, Self- esteem, Education
Area lived in, Religion, Transportation
World sample of
students .49 Health, Financial security, Family relations,
Friendships, Housing, Area lived in, Recreation activity , Self-esteem, Transportation, Living partner, Education
Job, Religion
Prince George
residents in 1994 .60 Job, Friendships, Housing, Self-esteem, Government services, Living partner
Health, Financial security, Family relations, Area lived in, Recreation activity, Religion, Transportation, Education
Prince George
residents in 1997 .64 Financial security, Family relations, Job,
Friendships, Self-esteem, Living partner
Health, Housing, Area lived in, Recreation activity, Religion, Transportation, Government services Power et
al. (1999)b Seattle, WA .75 Physical domain, Psychological domain, Social relationships domain, Environment
-
Sirgy et
al. (2000) Communities from
U.S. and Australia .56 Community, Family, Finances, Personal health, Leisure life, Spiritual life,
Job, Education, Friendship, Neighborhood, Environment, Housing, Cultural life, Social Status
Turksever and Atalik (2001) b
.33 Health, Climate, Crowding, Sporting, Housing conditions, Travel to work,
Environmental pollution
Shopping facilities,
Education provision, Cost of living, Noise levels, Job opportunities, Relation with neighbors, Parks and green areas, Leisure opportunities, Crime rate, Accessibility to public transportation, Traffic congestion
Senlier et
al. (2009) Turkish .25 Education facilities, Quality of environment, Safety, Public transport, Neighborhood
Social and cultural facilities, Sufficiency of health
services, Quality of health services,
Note.a Michalos and Zumbo (1999) applied their simple linear QOL life model comprising 14 items to various populations and obtained various predictive power and subset of items that were significant in explaining general QOL. bPower et al. (1999) also reported their study finding in other 14 countries, including Japan, Israel, Australia, and U.K. cTurksever and Atalik (2001) reported regression model explaining QOL both at city and district levels. The table presented
2.2 Quality of Life and Transportation
Transportation has emerged as an important, yet still not entirely understood element to QOL.
Further, rather than a holistic approach to transportation, select transportation areas are typically studied such as public transit and parking (Senlier et al. 2009), accessibility and mobility (Doi, Kii, Nokanishi 2008), or a transportation systems efficiency (Das 2008).
The degree to which transportation or aspects of transportation affect QOL varies. Michalos and Zumbo (1999) found transportation’s influence on satisfaction with life was significant, yet very weak (β < .1). Forkenbrock’s (2004) focus group study among Iowa residents found several transportation items were important to residential QOL: commuting, safety, and choice of transportation modes. Turksever and Atalik (2001) found travel to work was a significant
predictor to life satisfaction, yet accessibility to public transportation and traffic congestion were not. In contrast, public transport did predict QOL in Turkey according to Senlier et al. (2009).
Shafer, Lee, and Turner (2000) studied if and how greenway trails influence QOL, finding urban greenway trails were perceived as contributing most to community QOL through resident
health/fitness, the natural areas they provide, better land use, and resident pride.
As of 2011, a single study quantitatively addressed the influence of transportation on QOL by mode of travel (Arlington County 2007). In their assessment, Arlington County determined QOL had several predictors, including transportation. In contrast, safety, shopping opportunities, ease of getting around the area, and diversity were not significant QOL predictors. QOL predictors also differed by mode of travel (Table 2.2).
Table 2.2: Significant predictors of quality of life by different travel modes (Arlington County 2007)
Travel Mode Significant quality of life predictors
Drive alone public education, transportation system and services, ease of getting around the area, entertainment and recreation opportunities, safety, attractive residential communities, the economy
Train ease of getting around the area, public education, safety, entertainment and recreational opportunities, attractive residential communities, transportation system and services, diversity
Bus ease of getting around the area, entertainment and recreation opportunities, public education, safety
Carpool
/vanpool ease of getting around the area, the economy, public education, attractive residential communities
Bike job opportunities, transportation system and services, public education, ease of getting, and the economy
Walk public education, ease of getting around the area, safety, transportation system and services, entertainment and recreational opportunities
As of 2011, several state transportation departments have integrated QOL into their performance measurements, typically with objective measures such as highway fuel use per vehicle mile traveled or population within a two-hour drive of commercial air service (Table 2.3). However,
objective conditions do not always reflect consumer satisfaction (Cummins, 2000; Das, 2008) and thus there is a need to engage consumers and integrate their ideas more explicitly.
Table 2.3: Quality of life related performance measurement among departments of transportation, 2011
Agency Quality of life related performance measurement Connecticut Department of
Transportation (2009) Specific projects including Transit Oriented Development, Diesel Locomotive Initiatives; aviation enhancing QOL (Bradley International Airport); airport noise mitigation;
Bradley gong green; recycled construction and maintenance materials; improving winter highway maintenance; new M8 rail fleet; buses and bus facilities; congestion; traffic
incident management; traffic management systems;
bikeways, walkways and trails; business development program
Virginia Department of
Transportation (Smith 2009) Tons per year of mobile source emissions; tons per year of mobile source greenhouse gas emissions; fuel usage per capita; acres of wetlands replaced.
Oregon Department of Transportation (Reif & Brian 2005)
Transportation cost index
Arlington County Commuter
Service (2007) Ease of getting around without car, choice/variety of options, cost, time required to make trips, convenience, dependability, safety, comfort, Arlington County Commuter Service is meeting residents’ needs, ability to travel around AC, ease of getting around with car, ease of getting around by bus, ease of getting around by bicycle, ease of getting to other destinations without a car.
Toward a consumer-centric view, several transportation areas of interest were identified in focus groups with Minnesota residents in 2010: access, design, environment, maintenance, mobility, safety, and transparency (Schroeder, Gustafson, and Schneider 2011). Of these, only a few have received any attention in the research literature as they relate to QOL: mobility, safety, and design.
Research regarding the impact of mobility on QOL focuses on the aged and people with functional impairment (Gabriel and Bowling 2004; Hjorthol, Levin, and Siren 2010; Gagliardi, Marcellini, Papa, Giuli, and Mollenkopf 2010). Mobility and accessibility are consistently
identified as important among the aged (Spinney et al. 2009; Loti and Koohsari 2009; Hjorthol et al. 2010). For example, Gabriel and Bowling’s (2004) focus group study with older people identified mobility as an important theme. Hjorthol, Levin, and Siren (2010) studied mobility of different groups of older people and found car ownership and use among older people was more
was a significant predictor of mobility satisfaction in Italy, but not life satisfaction in either Italy or Germany.
Safety has been recognized as an important indicator of QOL as well as a transportation evaluation criterion. In Parra, Gomez, Sarmiento, Buchner, Brownson, Schimd, Gomez, and Lobelo’s (2010) work, traffic safety was positively associated with health-related QOL among older adults. Chatterjee, Wegmann, Fortey, and Everett (2001) summarized how several metropolitan planning organizations (MPOs) addressed safety and security issue in both the long-range and short-range transportation planning processes. Their case study-oriented project found although safety and security were reflected in planning policies and goals and short-range project selection, there were few instances in which long-range planning incorporated these issues.
Although the general role of transportation system design on QOL is rarely studied, various studies support the link between the built environment, including transportation, and public health (Frank and Engelke 2001; Frank and Kavage 2009). Studies suggest providing a walkable environment increases physical activity levels and promotes neighborhood QOL (Frank and Kavage 2009; Frank, Sallis, Saelens, Leary, Cain, Conway, and Hess 2009). However, Sarmiento et al. (2010) found the walkability indicators such as bike lane density, street network density, and distance to transportation were not significant predictors to WHOQOL scores.
This brief review of QOL research reveals an opportunity for practitioners and researchers alike to better understand the effect of transportation on QOL in general as well as specific
transportation areas on QOL. The following chapter introduces the research methods used to address if and how transportation impacts QOL among Minnesotans, the role of various transportation areas to transportation satisfaction, and the relationship between importance and satisfaction with MnDOT performance on various transportation areas.
Chapter 3. Focus Groups
3.1 Study Method
Twenty-four focus groups were conducted across the state of Minnesota in the late summer and early fall of 2010. This section describes the details of those focus groups in the following sections: approach, study setting, sampling, and data analysis.
3.1.1 Approach
Focus groups sought a better understanding of the factors that influence Minnesota residents’
opinions, experiences, and descriptions of QOL. Focus groups with Minnesota citizens, from different age groups and from all across the state, qualitatively explored the various factors that constitute QOL and captured citizens’ stories and lived experiences in their own voices. This approach was used based on a 2009 MnDOT pilot study of five focus groups in the metropolitan area of Minneapolis-St. Paul, specifically in Woodbury and East St. Paul.
Twenty-four focus group sessions were conducted between August and November 2010. Focus groups were deemed to be most appropriate to elicit deep insights and perceptions to explore and describe the depth and breadth of the QOL concept. Each focus group had between five and twelve participants and standard focus group procedures were followed for each session (Krueger and Casey 2008). Participants were provided a nominal cash gratuity ($75) to
participate. Participation was voluntary and all participants were assured of confidentiality and anonymity.
A guide for the focused discussion was developed and used during the pilot study in 2009 (Appendix A). This guide was reviewed and amended by University of Minnesota researchers and MnDOT representatives. The questioning route was then pilot tested on August 31, 2010, in the initial focus group meeting. The purpose of pilot testing was to ensure the questions were delivered in a conservational manner, easily understood by participants, and generated the type of information needed to address the research questions of interest. Approximately six questions were used, and the questions were grouped in a funnel sequence that progressed from simple warm-up questions to more meaningful questions. This technique created a permissive environment and first eased the participants into the focus group setting and encouraged everyone to speak; then later narrowed participant attention in on areas of research interest (Krueger and Casey 2008; Goldenkoff 2004). The opening questions were designed to introduce members of the group to each other and get people comfortable talking. Next, transition
questions probed participants to describe the various factors that contribute to or detract from their QOL. The facilitators did not define QOL, instead participants were asked to reflect on their current life stage and describe the factors that influence their life and make-up their own QOL.
During these transition questions, the moderator listed all the QOL factors on a flip chart and facilitated discussion to explore how each factor contributed to or detracted from QOL. After the
A set of key questions focused specifically on ways in which the transportation system
contributes to or detracts from QOL. The participants themselves had conceptualized a meaning for QOL in the previous exercise and used this same framework to describe the impact the transportation system had on QOL. Again, the moderator created a list of the contributing and detracting factors as the group generated ideas. During this discussion, participants were asked to think specifically about MnDOT and to describe how MnDOT could improve QOL. Finally, closing questions explored participants’ anticipated future needs from the transportation system and thoughts on how MnDOT could contribute to QOL in the next generation. In conclusion, all participants were invited to make final comments on the topic of the transportation system and QOL.
Each session lasted about an hour and a half, and refreshments were provided during the focus group. Each of the focus group discussions was digitally recorded. The data set includes the audio recordings, the flip charts generated in each session, and the research team’s notes from each session.
3.1.2 Study Setting
The focus groups were conducted in 13 communities across Minnesota and the locations were selected to capture a broad state representation. A variety of geographical areas were included as well as variety of community sizes including both metropolitan and micropolitan (Appendix B).
At least one community from each of MnDOT’s eight districts was represented and between one and three focus groups was conducted at each location. The focus group discussions took place in easily accessible public meeting areas such as a library conference room or classroom. These settings created a neutral atmosphere and were convenient for area residents.
3.1.3 Sampling
A Twin Cities-based market research company obtained the sample from a telephone census- block purchased list. Participants from each community were grouped according to age to represent three major life stages: (1) younger life stage (age 20 to 34), (2) middle life stage (age 35 to 59), and (3) older life stage (age 60 to 75). Participants were screened to meet selected criteria, however, a very diverse sample was still recruited (Appendix C). The focus groups included a mix of ethnic diversity, age, and people who used multiple modes of transportation.
All participants were screened to determine they met several criteria: lived within the city limits of their community, lived in the area at least the last three years, lived in Minnesota at least the last five years, between the ages 20 and 75, drive or travel as a passenger at least 20 miles per week, as well as not employed with a company or agency that may bias responses (such as MnDOT).
3.1.4 Data Analysis
Multiple audio reviews of the recorded discussions and meticulous reading and rereading of the focus group notes was the focus on the analysis. Each focus group session was first summarized in a table to document the key themes and perspectives that emerged during the session. The multiple tables were then synthesized to facilitate a side-by-side comparison among the sessions.
Finally, across cases, the textual data were organized in categories and subcategories. During this
coding process similar themes were identified across focus groups and were grouped under a representative name. Field notes from multiple facilitators added to data verifiability as did significant researcher corroboration and discussion.
3.2 Results
A total of 215 Minnesota residents participated in 25 focused discussions between August and November 2010 (Appendix B). These facilitated meetings across the state revealed multiple dimensions that contribute to and detract from area residents’ QOL as well as the variety of ways in which the transportation system influences QOL. Findings that describe overall QOL are presented first, and then transportation- related QOL indicators. Next, findings are compared among the age groups, between the metropolitan area and the outstate regions, and among select diverse groups. Finally, findings on communications and future needs related to the
transportation system are presented.
3.2.1 Quality of Life
Focus group participants were asked to discuss the quality of their lives and identify factors that contribute to and detract from QOL. The term “quality of life” was not predefined; instead, each group was encouraged to conceptualize what it meant in terms of their own life experiences.
Across cases, similar themes emerged to describe QOL. Notably the themes were reflective of the findings from the 2009 pilot study and also of the QOL themes documented in existing literature. Similar to the pilot study, the factors that made up QOL were generally uniform across ages, locality, and gender. Nearly all groups identified the same basic factors that make up QOL;
however, there was some variety in the discussion of how each factor contributed to or detracted from QOL. The 11 categories most frequently were used to describe QOL included: education, employment and finances, environment, housing, family, friends and neighbors, health, local amenities, recreation and entertainment, safety, spirituality/serenity/faith, and transportation.
• Education: Pre-kindergarten through post-secondary education contributed to overall QOL across all the focus groups. The younger age group represented the most parents of school-aged children, and good local schools were considered the most important. Good schools were also identified as important features of a community and schools played a part in attracting residents to a town and motivating them to stay. Quality of education and access to higher education were other parts of this QOL factor.
• Employment and finances: Many QOL factors acted as simultaneous contributors and detractors. While financial safety and secure employment were cited as QOL contributors, other employment and financial concerns were frequently identified as QOL detractors.
Having a job was important, as were opportunities for advancement. Job opportunities and the current state of the economy were listed as concerns, particularly among the middle age group. The younger age group identified student loans and being in debt as examples of financial strains.
• Family, friends and neighbors: A social community made up of family, friends, and neighbors was cited by all groups as an important QOL factor. Good neighbors and sense of a tight-knit community positively impacted QOL and was described frequently.
Family relationships including spouse, children, parents, siblings, and extended family were also important QOL factors, and proximity of family members also influenced QOL.
The types of relationships varied by aged; however, this category emerged as an important QOL factor across all the focus groups.
• Health: Good health was cited a QOL contributor, while health problems or poor health was a serious QOL detractor. Health concerns were addressed most by the older age group but all groups described access to quality healthcare as a QOL contributor.
• Local amenities: All groups expressed a sense of regional or local pride and a strong community identity. A variety of local amenities were cited as participants described their QOL. Examples include community services, clean streets, library, farmers market, local parks, shopping, town sized “just right,” and community situated with good access to surrounding towns and areas.
• Recreation and entertainment: Although examples of activities varied, recreation and entertainment was described as a QOL factor by all groups. Most frequently recreation and entertainment contributed to QOL, but in some cases the lack of recreation options or limited activities were described as QOL detractors.
• Safety: Safety was a top of mind QOL factor across all cases. A safe and secure neighborhood and community contributes to QOL. On the other hand, safety concerns and issues of crime, vandalism or violence are QOL detractors. Safety issues were described most by the middle and older age group.
• Spirituality/serenity/faith: Faith in a higher power and involvement in church or a religious community contributed to QOL. Individuals differed in practices and beliefs, but spirituality consistently added to QOL among participants. Serenity included descriptions of feelings of peace and freedom; some examples include relaxing and
enjoying free time, valuing honesty, visiting a peaceful area, and feeling rooted in an area.
• Transportation: This category was described as both a detractor and a contributor.
Participants also noted that transportation was interrelated with other QOL factors.
Specifically, respondents discussed how transportation facilitates other QOL factors. For example, respondents relied on transportation to enjoy local amenities, access to health care facilities, connect with family and friends, and travel to work. Transportation QOL contributors include safe roads, ease of getting around, convenient access to destinations, a variety of transportation options, and good snow removal. Transportation issues were also identified as QOL detractors in some cases: long commute times, construction detours and delays, dangerous road areas, and distracted drivers.
3.2.2 Transportation System and Quality of Life
Participants described the primary factors within the transportation system that contributed to or detracted from QOL. Notably, respondents seemed very unclear about transportation system jurisdictions. Rather than a concern with who managed the transportation systems, respondents were concerned about the systems themselves. The most frequently mentioned factors included (in alphabetical order): access, design, environment, maintenance, mobility, safety, and
transparency (communications/planning). These seven concepts are interrelated. For example,
safety is influenced by maintenance of road surfaces and mobility or movement depends first on access to destinations. Focus group participants across cases discussed these concepts both in terms of contributing to and detracting from QOL. Within each of the categories, subthemes emerged providing additional depth of meaning to the construct (Appendix D).
• Access: Accessibility refers to access to destinations or people’s ability to reach the destinations they must visit in order to meet their needs and desire to visit to satisfy their wants (Center for Transportation Studies). Much of the existing research as of 2010 measured access in terms of people’s ability to reach a destination in a personal automobile. This auto-based conceptualization is limited and measures of access are expanding to reflect the variety of access opportunities people may reach their
destinations. As such, subthemes of this category include: public transportation, service transportation, air travel, nonmotorized transportation, trains, and light rail transit.
• Design: The concept of transportation system design is particularly related to access and mobility. Design describes the physical layout of the transportation system and includes the multiple components that make up the system (e.g. roads, signs, and lights). Local neighborhood streets, regional roads, and interstate connections are all dynamic; as such, design improvement emerged as a subtheme in this category. However, these changes require funding and subsequently, costs emerged as another subtheme. In some cases the physical layout of the transportation system was easy to use and expedited travel, in other cases the layout was poor and confusing to use. Related to this, quality and efficiency were additional subthemes of design.
• Environment: Several characteristics of the environment are shaped and influenced by the transportation system. Respondents noted carbon emissions and air pollution as subthemes for this category. Beyond atmospheric emissions, the transportation system is also responsible for adding considerable sound and light to the environment, and, as such, noise and light pollution are additional subthemes of this category.
• Maintenance: Maintenance is a broad category that describes road surfaces, paint
indicators, general repair, and seasonal upkeep. Potholes and other poor road surfaces can negatively influence pavement ride quality and reduce customer satisfaction with state highway maintenance. Snowfall and Minnesota winters make seasonal maintenance particularly important. Therefore, respondents described subthemes of this category that included road quality, snow and ice removal, and efficiency.
• Mobility: Mobility describes movement, the actual process or experience involved with moving from one point or another. Mobility is defined as the movement of people from one place to another in the course of everyday life (Hanson 2010). While access is required for people to reach desired destinations, mobility refers to the physical
movement to get there. This concept of mobility describes movement, such as congestion or free-flowing traffic, travel time, and total hours of delay. Subthemes of this include:
traffic flow, commute time, construction, congestion, and travel time within and between communities.
• Safety: Safety emerged as a primary category in discussing transportation related QOL
troubled intersections or poorly marked streets, railroad crossings, and interactions between vehicles and bikers or pedestrians.
• Transparency: Several subthemes emerged in the focus groups adding depth and breadth to the concept of transparency. Communication in its various forms appears to be most associated with transparency; specific subthemes include communication about finances and planning.
3.2.3 Transportation System and Quality of Life: Comparisons by Age Group
Each focus group defined QOL and identified the ways in which the transportation system impacts QOL. Many similarities emerged across all the groups, specifically the seven major themes described above were discussed by all participants. However, the importance of each theme and the examples mentioned differed among the groups. Those age group differences are presented below.
• Younger Age Group (20 to 34): For this age group, discussions around the transportation systems focused most on access, specifically connectivity and ability to reach
destinations related to employment and family activities. This group represented a variety of young professionals and also young parents; as such, their experience with the
transportation system was primarily related to travel associated with employment,
schools, and shopping. Public transportation, a subtheme of the access category, was also discussed most frequently by this age group. Participants in the younger aged focus group sessions identified ways in which public transportation was both a contributor and a detractor to QOL. Light rail, inexpensive options, access to multiple destinations, park and rides at bus stops, and free bus rides for children and students were mentioned as public transportation QOL contributors. On the other hand, long waits for the bus and limited distances and destinations available with public transportation were identified as QOL detractors.
• Middle Age Group (35 to 59): Much of the discussion among the middle age group participants was an overlap between the younger and older groups. Access was an
important QOL factor within the transportation system, and service transportation options were discussed frequently in addition to public transportation options. Examples of service transportation, a subtheme of the access category, include taxi service, dial-a-ride, door-to-door bus services, and grocery and drug store deliveries. Service transportation was generally a QOL contributor; however, limited hours and schedules for some of these services were identified as QOL detractors.
• Older Age Group: This group experienced the transportation system differently because nearly all the participants in the older age group were retired or not employed full time.
This group talked about the transportation system primarily in terms of access to health care, shopping, leisure travel, visiting family, and other personal trips. Much more than the younger group and somewhat more than the middle age group, the older age group identified service transportation as the most important subtheme of the access category.
Like the middle age group, service transportation was frequently a QOL contributor;
examples include taxi service, intercity shuttle service, medical van service, home pick- up options, and specialized services such as meals on wheels and other medical services.
The cost of some of these services and limited availability were mentioned as QOL detractors. For all groups, particularly the middle and the older age group, safety was a
top of mind transportation QOL factor. The middle group and older age group also had transportation system-related safety factors as top of mind contributors to QOL.
Examples of such factors include flashing emergency lights, rumble strips, brighter lights and intersections, and overhead signs giving advance warning about a crash, road
conditions, or other safety hazard.
3.2.4 Transportation System and Quality of Life: Metropolitan Area and Non-Metro Minnesota
At least one focus group was conducted in each MnDOT region, and a many communities were represented, including several Twin Cities Metropolitan groups and a variety of towns and cities outside the metro. Each group experienced the transportation system somewhat differently as a result of its specific locality; overall, differences emerged particularly between metropolitan area groups and non-metro groups. Across the state, the same seven main categories were identified as ways in which the transportation system influences QOL; however, certain factors were emphasized more by non-metro Minnesota groups while other factors were more important to the metropolitan groups.
• Access: Within the metropolitan area, accessibility was a greater QOL contributor and mobility was frequently described as a QOL detractor. Access, or the ability to reach destinations, was mentioned as a positive aspect to living in the metro area. The Twin Cities were described as accessible, and participants explained that multiple
transportation options are available to connect people with destinations. This variety of transportation modes included light rail, public bus, private bus, shuttles, personal automobile, light rail, air travel, and nonmotorized transportation. As participants
discussed nonmotorized transportation, the idea of connectivity and access again emerged as a QOL contributor. Specifically the Greenway trail in Minneapolis and the Grand Rounds facilitated access to destinations by bike or on foot.
• On the other hand, non-metro focus groups participants more frequently noted access issues as transportation-related QOL detractors. These respondents described different transportation modes as limited as the variety of options available as insufficient.
Participants explained that their ability to reach regional destinations was restricted, and connectivity to the Twin Cities was inadequate. Non-metro focus group participants expressed a desire for improved accessibility and noted that increased transportation options with a greater variety of destinations and longer distances would enhance access.
• Mobility: Mobility issues were often noted as transportation-related QOL detractors in the metropolitan focus group sessions. Mobility describes movement, and participants in these groups experienced several factors that inhibited quick and efficient movement.
Such factors that restricted mobility include rush hour traffic, congestion, long commute times, road construction, and delays.
• Restricted mobility was not experienced as frequently by non-metro respondents compared to focus group participants in the metro area. In fact, several examples of