FINANCIAL PROFITABILITY AND RESOURCE USE EFFICIENCY OF MUSTARD CULTIVATION IN BELKUCHI
UPAZILA OF SIRAJGANJ DISTRICT
MD. AL IMRAN
DEPARTMENT OF AGRICULTURAL ECONOMICS SHER-E-BANGLA AGRICULTURAL UNIVERSITY
SHER-E-BANGLA NAGAR, DHAKA-1207
JUNE, 2020
FINANCIAL PROFITABILITY AND RESOURCE USE EFFICIENCY OF MUSTARD CULTIVATION IN BELKUCHI UPAZILA OF
SIRAJGANJ DISTRICT
MD. AL IMRAN
BY
REGISTRATION NO.: 13-05716 A Thesis
Submitted to the Faculty of Agribusiness Management, Sher-e-Bangla Agricultural University, Dhaka,
in Partial fulfillment of the requirements for the degree of
MASTER OF SCIENCE (MS) IN AGRICULTURAL ECONOMICS SEMESTER: JANUARY-JUNE, 2020
A
pproved by………
Professor Gazi M. A. Jalil
Chairman
Department of Agricultural Economics Sher-e-Bangla Agricultural University, Dhaka -1207
……….……….…
Professor Gazi M. A. Jalil
Co-Supervisor
Dept. of Agricultural Economics Sher-e-Bangla Agricultural University,
Dhaka -1207 ……….……….…
Dr. Bazlul A. A. Mustafi Supervisor Former Director of BRRI
Department of Agricultural Economics Sher-Bangla Agricultural University Sher-e-Bangla Nagar, Dhaka-1207, Bangladesh
CERTIFICATE
This is to certify that the thesis entitled “FINANCIAL PROFITABILITY AND RESOURCE USE EFFICIENCY OF MUSTARD CULTIVATION IN BELKUCHI UPAZILA OF SIRAJGANJ DISTRICT” submitted to the Department of Agricultural Economics, Faculty of Agribusiness Management , Sher-e- Bangla Agricultural University, Sher-e-Bangla Nagar, Dhaka in partial fulfilment of the requirements for the degree of Master of Science (MS) in
Agricultural Economics
, embodies the result of a piece of bona fide research work carried out by Md. Al Imran, Registration No. 13-05716 under my supervision and guidance. No part of the thesis has been submitted for any other degree or diploma.I further certify that any help or source of information, as has been availed of during the course of this investigation has been duly acknowledged by the author.
Dated: June, 2020 Dhaka, Bangladesh
……….
Dr. Bazlul A. A. Mustafi
Supervisor
Former Director of BRRI
THIS THESIS IS LOVINGLY
DEDICATED TO MY
PARENTS
FINANCIAL PROFITABILITY AND RESOURCE USE EFFICIENCY OF MUSTARD CULTIVATION IN BELKUCHI UPAZILA OF SIRAJGANJ
DISTRICT ABSTRACT
The study was undertaken to determine financial profitability and resource use efficiency of mustard cultivation as well as major constrains faced by farmers at farm level. The study was conducted in two villages namely Garamashi and Chandanganti under Belkuchi upazila of Sirajganj district. Data were collected by using interview schedule from the randomly selected 60 respondents during 1st January to 30th January, 2020. After analyzing the data per hectare mustard cultivation, total cost of production was Tk. 48462, Tk. 51411 and Tk. 55435 for small, medium and large farm respectively. Per hectare gross return was Tk. 65450, Tk. 64700 and Tk. 63950 for small, medium and large farm respectively. Per hectare gross margin was Tk. 38596, Tk. 35789 and Tk. 31954 for small, medium and large mustard cultivation respectively.
Net return was calculated by deducting gross cost from gross return and these were Tk.
16988, Tk. 13289 and Tk. 8515 for small, medium and large mustard cultivation farm respectively. Benefit cost ratio was 1.35, 1.26 and 1.15 for small, medium and large mustard cultivation respectively. From Cobb-Douglas production function analysis, it was observed that the coefficients of human labour, seed, MoP and pesticides were significant at different level of probability for small, medium and large mustard cultivation farm respectively and the coefficients of urea and TSP was not significant while the coefficients of pesticide were negatively significant for mustard cultivation respectively. Resource use efficiency indicated that all of the resources were under used for mustard cultivation except overutilization of urea and pesticide. So, there is a positive effect of key factors in the production process of mustard cultivation. This study also identified some of the problems associated with mustard cultivation. The findings revealed that lack of credit facility was the 1st problem followed by high price of fertilizers and Lack of storage facility was last obstacle of mustard cultivation in the study area. Therefore, credit facilities are the first suggestion to overcome the problem.
ACKNOWLEDGEMENT
All of my gratefulness to almighty Allah who enabled me to accomplish this thesis paper. I would like to express my heartiest respect, deepest sense of gratitude, profound appreciation to my Supervisor, Dr. Bazlul A. A. Mustafi, Former Director, Bangladesh Rice Research Institute and Adjunct Faculty, Department of Agricultural Economics, Sher-e-Bangla Agricultural University, Dhaka for his sincere guidance, scholastic supervision, constructive criticism and constant inspiration throughout the course and in preparation of the manuscript of the thesis.
I would like to express my heartiest respect and profound appreciation to my Co- supervisor and Chairman, Professor, Professor Gazi M. A. Jalil, Department of Agricultural Economics, Sher-e-Bangla Agricultural University, Dhaka for his utmost cooperation and constructive suggestions to conduct the research work as well as preparation of the thesis.
I would like to thank all of my family members who have helped me with technical support to prepare this thesis paper. I also thank all of my roommates and friends to help me in my research work.
Mere diction is not enough to express my profound gratitude and deepest appreciation to my mother, brothers, sisters, and friends for their ever-ending prayer, encouragement, sacrifice and dedicated efforts to educate me to this level.
June, 2020 The Researcher
LIST OF CONTENTS
CHAPTER TITLE PAGE
ABSTRACT i
ACKNOWLEDGEMENT ii
LIST OF CONTENTS iii-v
LIST OF TABLES vi
LIST OF FIGURES vi
LIST OF APPENDICES vi
ABREVIATIONS vii
CHAPTER I INTRODUCTION 1-5
1.1 Background of the Study 1
1.2 Worldwide importance of Mustard among the oil crops 2
1.3 Mustard Cultivation Areas of Bangladesh 3
1.4 Justification of the Study 4
1.5 Specific objectives of the study 5
1.6 Limitation of the Study 5
1.7 Organization of the thesis 6
CHAPTER II REVIEW OF LITERATURE 7-11
CHAPTER III METHODOLOGY 12-22
3.1 Introduction 12
3.2 Methods of Data Collection and Data Collecting
Instruments 12
3.3 Selection of the Study Area 12
3.4 Selection of Sample and Sampling Technique 15
3.5 Preparation of questionnaires 15
3.6 Data Collection and processing 15
3.7 Analytical Technique 16
3.7.1 Procedure for computation of Cost and revenue 16 3.7.2
3.7.3 3.7.4
Cost of human labor Animal labor cost Machinery cost
16 17 17
3.7.5 Seed cost 17
3.7.6 Cost of fertilizers 17
3.7.7 Interest on operating capital 18
3.7.8 Land use cost 18
3.7.9 Total variable cost 18
3.7.10 Total Fixed cost 19
3.7.11 Total cost 19
3.7.12 Margins of farmer 19
3.7.13 Net farm income farmers 19
3.7.14 Cobb-Douglas production function 19
3.7.15 Undiscounted Benefit Cost Ratio (BCR) 20
3.7.16 Measurement of Resource Use Efficiency 20
3.7.17 Problems Faced in Collecting Data 21
3.8 Measurement of Resource Use Efficiency 22
CHAPTER IV DEMOGRAPHIC PROFILE OF RESPONDENTS 23-28
4.1 Age 23
4.2 Education 24
4.3 Occupation 25
4.4 Experience in mustard cultivation 25
4.5 Family size 26
4.6 Farm size 27
4.7 Annual family income 27
CHAPTER V PROFITABILITY OF MUSTARD
CULTIVATION 29-34
5.1 Introduction 29
5.2 Pattern of input use 29
5.3 Pattern of input use for mustard cultivation 29 5.4 5.5 Human labor cost
Cost of land preparation 30 30
5.6 Seed cost 30
5.7 Cost of fertilizers 30
5.8 Cost of pesticides 32
5.9 Total Variable Cost 32
5.10 Total Production Cost 32
5.11 Interest on operating capital 32
5.12 Land use cost 32
5.13 Total Fixed Cost 33
5.14 Profitability of mustard cultivation 33
5.15 Production of mustard in the study area 33
5.16 Total revenue 33
5.17 Gross farm income 34
5.18 Net farm income 34
5.19 Benefit cost ratio (BCR) 34
5.20 Concluding Remarks 34
CHAPTER VI FACTORS AFFECTING AND RESOURCE USE
EFFICIENCY OF MUSTARD CULTIVATION 35-38
6.1 Introduction 35
6.2 Factor affecting of mustard production 35 6.3 Resource use efficiency of mustard production 37
6.4 Concluding Remarks 38
CHAPTER VII PROBLEM FACED BY THE FARMERS IN
MUSTARD PRODUCTION 39-44
7.1 Introduction 39
7.2 Problems faced by the farmers 39
7.2.1 Lack of credit facility 39
7.2.2 Lack of government attention 40
7.2.3 Lack of quality seed 40
7.2.4 Low price of mustard 40
7.2.5 High transportation cost 40
7.2.6 Lack of pesticide 40
7.2.7 Lack of storage facilities 41
7.3 Farmer’s suggestions to solve their problem 42
7.3.1 Need credit facilities 42
7.3.2 Supply good quality of seed 42
7.3.3 Development of market facilities 42
7.3.4 Mustard price should be increased 43
7.3.5 Available insecticides and pesticides 43
7.3.6 Reduce transportation cost 43
CHAPTER VIII SUMMARY, CONCLUSION AND
RECOMMENDATION 45-53
8.1 Summary of the Study 45
8.2 Conclusion and Policy Recommendations 49
REFERENCES 51-55
LIST OF TABLES
TABLE TITLE PAGE
1.1 Shows area and production of mustard in various division of Bangladesh 3 4.1 Distribution of the farmers according to their age 23 4.2 Distribution of the farmers according to their education 24 4.3 Distribution of the farmers according to their experience in mustard cultivation 26 4.4 Distribution of the farmers according to their family size 26 4.5 Distribution of the farmers according to their farm size 27 4.6 Distribution of the farmers according to their annual income 28 5.1 Level of input use per hectare of mustard cultivation 29 5.2 Per hectare cost of mustard cultivation in the study area 31 5.3 Profitability of mustard cultivation per hectare 33 6.1 Estimated values of coefficients and related statistics of Cobb- Douglas production function 36 6.2 Estimated resource use efficiency in mustard production 37
7.1 Problems faced by the farmers 41
7.2 Farmer’s suggestions to solve their problems 44 LIST OF FIGURES
FIGURE TITLE PAGE
3.1 Map of Sirajganj district showing Belkuchi upazila 13 3.2 Map of Belkuchi upazila showing the study area 14 4.1 Distribution of the farmers according to their occupation 25
ABBREVIATIONS
BBS Bangladesh Bureau of Statistics GDP Gross Domestic Product BCR Benefit Cost Ratio
NGOs Non-Governmental Organization
BB Bangladesh Bank
MP Muriate of Potash
HYV High Yielding Variety TSP Triple Super Phosphate
STW Shallow Tube Well
DTW Deep Tube-Well
SPSS Statistical Package for Social Science
LUC Land Used Cost
TVC Total Variable Cost
NR Net Return
MFC Marginal Factor Cost MVP Marginal Value Product MPP Marginal Physical Product
GM Geometric Mean
CHAPTER I INTRODUCTION
1.1 Background of the Study
Bangladesh is mainly an agro-based country dominated by crop production. The area of the country is 147570 square kilometers The population growth rate is about 1.37% per year and the overall male female ratio is 102:100. The per capita income is1909 US Dollars in the country (MoF, 2020). About 10.5% of the populations live in the extreme poverty measured in the term of their minimum calorie intake per day (MoF,2020).
Agriculture is the main stay of the economy of Bangladesh and this sector contribute about 13.6% of total Gross Domestic Production (GDP). The economy of Bangladesh is based on agriculture which is transforming from traditional to modern system. Bangladesh agriculture has witnessed an all-time high growth rate of 7.62 percent in 1999-2010 (MoF, 2012). A high growth rate achieved in the crop sector enhanced overall growth rate in agricultural sector. Although the contributions of agricultural percentage share declining but total value is increasing in the economy of Bangladesh. About 45.1% of the total national labor forces are employed by the agricultural sector (Bangladesh Economic Review, 2019) and about 70% people of this country are directly or indirectly involved with this sector.
The oil seed sub sector accounts 1.37% to Gross Domestic Product (BBS, 2019).
Various types of crops are produced in this country. Oil seed crops are treated as minor crops. Due to increase of area under cereal crops for meeting the increasing demand of food-stuff, land under Oil seed crops has declined and price of oil has gone up (Anwar, 2004). The government of Bangladesh has, therefore, provided priority to the agriculture sector to increase the production of Oil seeds by giving subsidy to the farmers on different inputs such as fertilizer; irrigation etc.
1.2 Worldwide importance of Mustard among the oil crops
Rapeseed and mustard are popularly called ‘Mustard’ which is a leading oilseed crop, covering about 80% of the total oilseed area and contributing to more than 60% of the total oilseed production in Bangladesh. It is a cold loving crop which is grown during Rabi season. Mustard is a leading oil crop in Bangladesh.
Mustard is an important oil crop and currently ranked as the world’s third important oil crop in terms of area and production. Mustard is one of the most important oilseed crops throughout the world after soybean and groundnut. Worldwide total annual production of Mustard is 630.40 lacks metric ton from an area of 343.30 lacks ha (FAO, 2013). But it ranks top in respect of area and production among the oil crops grown in many countries. Mustard oil has been using as cooking oil from the time immemorial. The average yield of Mustard is1500Kg/ha. Total production and per hectare seed yield of this crop may be increased by using high yielding variety (HYV) and improved production technologies (Gonzales et al., 1993). Oil cake is a nutritious food items for cattle and fish. It is also a good organic fertilizer for crops. Dry mustard plants may be used as fuel. According to the World Agriculture Towards 2015/2030 an FAO Perspective, oil seed crops responsible for a good part of agricultural land expansion (MoA,2011). The three fast growing oilseed crops (soybeans, rapeseed and sunflower) have been responsible for a good part of the expansion of cultivated land under all crops in the developing countries and the world as a whole (Gujrati, 1998). In terms of the expansion of land under the four major oil crops (soybeans, sunflower, Mustard and oilpalm) was 63 million ha, that is, these four crops accounted for all the increase in world harvested area and more than compensated for the drastic declines in the area under cereals in the industrial countries and the transition economies (Jabbar and Islam, 1981). The growth of food demand in the developing countries was the major driving force behind the rapid growth of the oil crops sector in the historical period (Islam, 2006).
The most of the countries played a major role in these developments. Table 1.1 shows the past and present of oil crops production contribution of Bangladesh in different years.
1.3 Mustard Cultivation Areas of Bangladesh
In Bangladesh there are 30 agro-ecological zones, among them 8 division are good for Mustard production (BBS, 2020).
Table 1.1 shows area and production of mustard in various division of Bangladesh Name
of Regions
2016-2017 2017-2018 2018-2019
Area
(acre) Production
( M. ton ) Area
(acre) Production
( M. ton ) Area
(acre) Production ( M. ton ) Barishal
Region 4604 1952 4810 2133 4795 2175
Chottagram
Region 44382 26534 34013 21753 37926 22018
Dhaka Region 255917 101967 203091 83883 142386 59694 Khulna
Region 94547 43482 87184 41934 61121 30401
Mymensing
Region 29642 12664 36524 14370 34174 14573
Rajshahi
Region 325597 137574 321112 148089 320410 147417 Rangpur
Region 69990 33439 66656 34070 62114 31504
Sylhet Region 6581 5248 6484 5305 4316 3958
Bangladesh 831260 362860 759874 351537 667242 311740 Sirajganj 122525 54164 120576 52726 122920 53793
Source: BBS, 2020
In the year 2016-2017, in sirajganj district, total production area were 122525 acre and the total production were 54164 metric ton, on the other hand in the year 2017-2018, total production area were 120576 acre and the total production were 52726 metric ton and in the year 2018-2019, total production area were 122920 acre and the total production were 53793 metric ton (Table 1.1).
1.4 Justification of the Study
Edible oils play vital roles in human nutrition by providing calories and aiding in digestion of several fat soluble vitamins, for example Vitamin A (NRC, 1989). The per capita recommended dietary allowance of oil is 6 gm/day for a diet with 2700 Kcal (BNNC, 1984). At least 15% (405 Kcal) of the total calories must come from visible and invisible oils or fats for maintaining good health. Some oilseeds are also a sources of good quality protein, vitamins and fuel. Oilcake is also an important manure for crop production and livestock feed. Bangladesh has to spend a huge amount of foreign exchange on imports of edible oils and oilseeds to meet the increasing demand of its population. The value of imports is increasing years after years. However, in Bangladesh, mustard is grown in limited area on commercial basis. But, there Is a demand for mustard all over the country. Farmers allocate land and other resources in the production of different crops on the basis of relative financial profitability & resource efficiency. With the rapid increase in population and urbanization, the demand for oil production has been increasing. To meet up growing demand of oil without importing, cultivable area of mustard should be increased. The high demand of oil can only be met by increasing its production vertically. While making production decision, farmers consider costs of production against the yield of the crop. So, profitability study on mustard is expected to reveal valuable information relating to farms and farmers growing this crop. With the importance of mustard cultivation in Bangladesh, it is necessary to find out the maximum level of mustard produced per unit of land using the existing level of resources.
Efficient use of resources can provide the farmers to have higher production from the available resources. The situation is particularly critical in a country like Bangladesh where per hectare recommended amount is seldom used in production.
However, a few systematic financial investigations on oilseed crops were undertaken either by private or government organizations and were not sufficient to satisfy the demand of extension workers, policy makers, research personnel’s and farmers. In this context, this study will help to diagnose the problems and prove our understanding on the interrelated problems of farmer’s choice making in producing mustard. The findings of the study will generate basic financial data on the production practices of mustard.
Policy-makers and research managers need overall information on oilseed crops to formulate suitable policy guidelines on oilseeds. However, an in-depth analysis is needed to explore the causes of low adoption and find out the ways for the expansion of mustard and others oilseed cultivation. The present study will explore the challenges and opportunities in the oilseeds sector of Bangladesh and it will provide valuable information to the individual farmers and researcher who will conduct further studies of the similar nature and encourage them in conducting more comprehensive and detailed investigation in this particular field of study.
Keeping this in view the study was undertaken with the following specific objectives.
1.5 Specific objectives of the study
The specific objectives of the study are as follows;
a. To describe the socio-economic characteristics of mustard farmers in Sirajganj district;
b. To estimate the financial profitability of mustard cultivation in the study area;
c. To determine the resource use efficiency of the mustard cultivation and
d. To identify the major problems of mustard cultivation in Sirajganj district.
1.6 Limitation of the Study
Considering time, money and other necessary resources available to the researcher and to make the study meaningful and manageable from the research point of view, it was necessary to impose some restrictions as stated below:
1. The investigation was depended on the data given by the selected growers during their interview.
2. For some cases, the researcher faced unexpected interference from the over interested side talkers while collecting data from the target respondents.
3. Due to shortage of time the study could not cover wide areas for collecting necessary information for avoiding inverse relation of the profit.
4. The shortage of money and time that did not allow taking a large numbers of samples to show the real significances among all categories farmers.
5. The farmers always remained busy in field work and it was difficult to collect information from their wife and children without consulting their husband.
1.7 Organization of the thesis
This thesis consists of eight chapters. Chapter I deal with the introduction including the background, justification and objectives of the study. Next, review of related literature is presented in Chapter II. Chapter III deals with the research methodology of the study.
The results and the discussion of the study are presented in Chapter IV, V, VI and VII. Finally, the summary, conclusions and recommendations of the study are presented in Chapter VIII.
CHAPTER II
REVIEW OF LITERATURE
A number of studies have examined financial profitability and resource efficiency of different agricultural crops in Bangladesh. This section presents the literature review in details resource use efficiency and profitability measurement analysis for the cereals and non-cereals using different financial analysis. The main purpose of this chapter is to review some related studies in connection with the present study. Although a number of studies have been done related to mustard cultivation in Bangladesh, only a few studies have so far conducted related to financial profitability and resource use efficiency of mustard cultivation in Bangladesh. Again, some of these studies may not entirely relevant to the present study, but their findings, methodology of analysis and suggestions have a great influence on the present study.
Monayem et al. (2015) conducted a study on production of oilseeds in Bangladesh, since a lot of foreign exchange was spent for importing edible oils and oilseeds to meet domestic demand. Up-to-date and nationally representative data and information are scarce. Therefore, this paper analyzed the profitability and comparative advantage of oilseed production in Bangladesh. It covers a total of 1,980 farms collected from 11 oilseed growing districts, namely Manikgonj, Faridpur, Tangail, Mymensingh, Rajshahi, Pabna, Dinajpur, Noakhali, Luxmipur, Comilla and Jessore. Four oilseed crops, namely mustard, sesame, groundnut and soybean are considered for the study.
The production of local variety sesame (Til-6) and soybean is marginally profitable to the farmers compared to competing crops except Aus rice. The country has comparative advantage in producing oilseeds for import substitution since the DRC estimates for selected oilseed crops are less than unity. However, mustard production is not so advantageous for Bangladesh since the value of DRC is close to unity.
Uddin (2018) conducted a study conducted on profitability and resource use efficiency of mustard cultivation in the selected areas of Tangail district in Bangladesh and found that total cost of production was Tk. 47848, Tk. 57082 and Tk. 64519 for marginal, small and medium mustard production respectively. Per hectare gross return was Tk.
70359, Tk. 75264 and Tk. 75934 for marginal, small and medium mustard production, respectively.
Per hectare gross margin was Tk. 44760, Tk. 42804 and Tk. 34678 for marginal, small and medium mustard production, respectively. Net return was calculated by deducting gross cost from gross return and these were Tk. 22511, Tk. 18182andTk.11415 for marginal, small and medium mustard production, respectively. Benefit cost ratio was 1.47, 1.32 and 1.18 for marginal, small and medium mustard production, respectively.
From Cobb-Douglas production function analysis, it was observed that the coefficients of land preparation cost, seed cost, irrigation cost, MoP cost and pesticides cost were significant at different level of probability for marginal, small and medium mustard production, respectively and the coefficients of urea cost and TSP used was not significant while the coefficients of human labor was negative and insignificant for marginal, small and medium mustard production, respectively. Resource use efficiency indicated that all of the resources were underused for mustard production except overutilization of human labor cost, urea and TSP cost. So there is a positive effect of key factors in the production process of mustard production.
Hossain (2013) conducted a study on the farmers’ perception on profitability of Mustard cultivation in between aman and boro rice. Findings indicate that majority of the farmers’ (59 percent) had high level of perception on profitability of Mustard cultivation in between Aman and Boro rice. Still there were some respondents (41 percent) had medium perception. Thus, it is indicative that there is scope to take necessary steps to bring 41 percent farmers to high level of perception.
Rahman (1995) carried out an economic study with mustard and without mustard cropping pattern in Comilla district. He found that per hectare yield and net return were 1245.90 kg and Tk 5683.89 respectively. The study also revealed that per hectare net return of with mustard cropping pattern (Mustard-HYV Boro-T. Aman) was Tk 19792.16 which was higher than without mustard cropping pattern (HYV Boro-T.
Aman-T. Aus) Tk 13965.28.
Hussain et al. (1983) conducted a study on mustard production in some areas of Pabna, Dhaka and Brahmanbaria. The average yield of mustard was estimated 1140 kg per hectare. Average gross return and net return were Tk 7182 and 4760 per hectare respectively while the average gross cost was Tk 5774. The study has shown that return to cash cost ratio of mustard was 2.97.
Rabbani et al. (2013) found out that the management and technological training is needed to the farmers to increase farm production and income from Mustard cultivation.
The author showed that less of proper technological advancement and proper information supply Mustard production level become low and inefficient resource allocation increase the cost of production.
Rayhan et al. (2013) conducted in Sirajganj district of Bangladesh to determine the profitability and resource use efficiency of Mustard production. Both descriptive statistics and functional analysis was done to achieve the objectives of the study. The author showed that the productivity and profitability was satisfactory for Sirajganj Mustard farmers. The author also suggested that if the farmers of Sirajganj district use the resources efficiently it could increase the production level more for the Mustard farmers in the study area.
Begum et al. (2011) conducted a study to assess the costs and returns from the cultivation of selected crops in different locations. He finds the benefit cost ratios over total costs were 1.61, 1.72, 1.62, 3.55, 1.90, 2.17 ,3.72, 1.94 and 2.64 for the cultivation of mustard, groundnut, mungbean, sweetpotato, cabbage, cauliflower, tomato, cucumber and okra respectively. High costs of fertilizers and insecticides were the major constraints to higher production for most of the crops as mentioned by the sample farmers.
Ogunniyi (2011) had done a study to measure profit efficiency among mustard producers in Oyo State, Nigeria. He showed that profit efficiencies of the farmers varied widely between 1% and 99.9% with a mean of 41.4% suggesting that an estimated 58.6% of the profit is lost due to a combination of both technical and allocative inefficiencies in mustard production. From the inefficiency model, it was found that education, experience, extension and non-farm employment were significant factors influencing profit efficiency. This implies that profit inefficiency in mustard production can be reduced significantly with improvement in the level of education of sampled farmers.
Barkat et al. (2010) revealed that smaller farmers were more restricted in their choices and opportunities because of their lack of assets and their financial profits from crop production activities are not moderate. A selective, targeted fertilizer subsidy scheme for only the smaller farmers may be the correct subsidy policy. In recent times, it has happened quite often that farmers have complained of not receiving the required amount of fertilizers and even sometimes not any fertilizer at all at the dealer’s shops. The study found huge deficit of fertilizers among small farmers, whereas larger farmers were less likely to be fertilizer-deficit as compared to the smaller farmers. The reasons behind the huge deficit of the fertilizers could be attributed to high price of fertilizers, lack of availability on time, transportation problem and so forth.
Das (2000) conducted a comparative analysis of HYV BR-29and hybrid Alok mustard in Kalihati Upazila of Tangail District. He determined the costs, returns and relative profitability of HYV BR-29 and Alok mustard. In order to attain objectives,66 farmers from 6 villages were selected as sample. Analysis of costs and returns showed that the total cost of BR-29 was Tk.13206.75 and that for Alok variety wasTk.13894.45. Again, return above full cost for BR-29 variety was found to be higher than Alok variety Tk.
6350.61 per acre. Therefore, production of BR-29 variety was found to be profitable compared to Alok variety.
Rahman (2000) conducted a study to determine the economics of Boro-mustard production in Melandah Upazilla of Jamalpur district. The major findings of the study were that BR-29 was profitable enterprise from the viewpoints of small medium and large farmers. Per hectare costs orBR-29 were calculated at Tk.3295.54,Tk. 32485.63 and 33617.40 for small, medium and large farmers respectively. Per hectare Yield of BR29 were 6290kg, 6600kg and 6100kg, respectively. In general human labor, power tiller, seedling, fertilizers, Irrigations and insecticides emerged as the very crucial contributors to increased income from BR 29 Boro production.
Nantu (1998) conducted a study to identify costs, returns and resource use efficiency in the production of Boro mustard in some selected area of Bangladesh. The costs of production of Boro mustard per hectare were Tk. 25547, Tk. 25857.73, andTk.27548.07 for small, medium and large farmers respectively. Per hectare yield of Boro mustard under different farm categories were 2875.85 kg, 3230.95kg and 3152.50 kg
respectively. The net returns per hectare were Tk. 2075.09, Tk. 4986.09 and Tk.
2232.48 respectively.
Yao (1997) assessed the cost and benefit of the Thai agricultural diversification policy in 1994–96. He suggested that Mustard was also more profitable as soybeans and mug beans implying that government intervention may incur efficiency losses. Sensitivity analyses showed that potential price changes, increasing water scarcity, and the effects of crop production on the environment were important concerns which justify government intervention.
Das and Sharma (2012) this study has examined the trends and variability in the growth of rapeseed and mustard crop in Nagaon district as well as in the state Assam as a whole.
For the analysis purpose, the relevant secondary data from 1980-81 to 2009-2010 have been examined. The compound growth rates have been estimated with the help of exponential function and variability has been calculated by using technique of co- efficient of variation. For the convenient of comparison the whole period is subdivided into three periods. The study concludes that a moderate to high significant growth has been observed in case of area, production and yield of rapeseed and mustard for Nagaon district and the state of Assam as a whole covering the study period. Concerning the variability, the study concludes that there persist wide fluctuations in the growth of area, production and yield of rapeseed and mustard over the study period.
Chapter Summary
Most of the above studies mainly focused on cost, return and economic analysis of oil crops but a little of them were focused on oil seed crops. There is also a very little effort on measuring resource use efficiency of oil seed crops production. Nevertheless, no empirical study has yet been conducted specially on the financial profitability and resource use efficiency analysis of mustard production. So, the present study, a moderate attempt has, therefore, been taken in this direction and be considered as a pioneering work in this field so far as systematic investigation into the cost, returns and resource use efficiency of this enterprise is concerned in some selected areas of Sirajganj district.
3.1 Introduction
CHAPTER III METHODOLOGY
Methodology is an indispensable and integrated part of any research. The reliability of a scientific research depends to a great extent on the appropriate methodology used in the research. Unreliable results may very often be obtained by following an inappropriate methodology. Careful considerations are needed by a researcher before conducting a study. The researcher has great responsibility in describing clearly what sorts of research design, method and procedure is to be followed in selecting the study area, the sampling technique and the analysis and interpretation to arrive at the correct conclusions. A chronological description of the methodology used for this piece of research is presented below:
3.2 Methods of Data Collection and Data Collecting Instruments
Both technical and socio-economic data were needed for this research. The researcher himself was collected the data by interviewing the selected respondents.
The measures taken were:
Built-in-check in the interview schedule;
Field checking and
Independent re-interviewing of the respondents.
3.3Selection of the Study Area
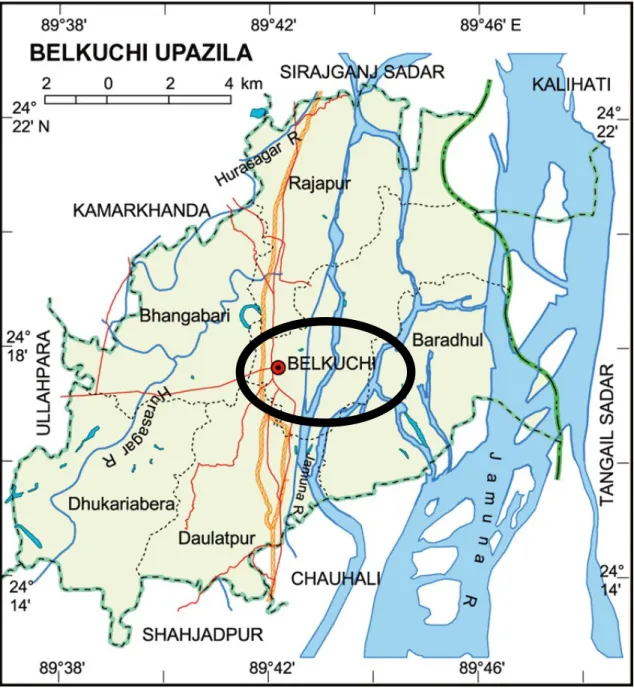
The study areas are located in the northern region of Bangladesh. The selection of the area in which a research concerning a farm business survey is conducted depends on the particular purpose of the survey and the possible cooperation from the farmers. The purposes would, therefore, be better served in this area where there were various types of farmers available. Sirajganj district were purposively selected because there were a large number of mustard growers in the areas of Bangladesh and mustard is the main producing crop in these areas besides the researcher had easy access to these areas. The area had relatively homogeneous soil type and topographical conditions. On the basis of higher concentration of mustard production and considering easy road communication, Belkuchi upazila under Sirajganj district was purposively selected for this study. The producer’s information was collected from two selected villages namely Garamashi and Chandanganti under Belkuchi upazila. The study areas are shown by an arrow on the map (Fig.3.1 &3.2).
Figure 3.1 Map of Sirajganj district showing Belkuchi upazila
Figure 3.2 Map of Belkuchi upazila showing the study area
3.4 Selection of Sample and Sampling Technique
Sampling is an important part of survey work. It was not possible to interview all the farmers of the study area due to time limits and resource constraints. The mustard farmers were selected purposively from the study area. Sixty farmers was selected from two villages (30 farmers from each) as a sample size of the study in Belkuchi Upazila under Sirajganj district.
3.5 Preparation of questionnaires
Once the survey objectives and associated data needs and analyses were specified, a questionnaire was developed to record the information needed for analysis. Attention was given to the general form of the questionnaire to see that the questions followed a logical and appropriate sequence. Care was taken in wording questions to ensure that they were unambiguous and easily understood to ensure cooperation by respondents.
According to the objectives of the study three sets of interview schedules were prepared for collecting data. Questionnaire was used for collecting information from mustard farmers. All schedules were pre-tested and finalized after necessary correction, modification and adjustment. Questionnaire had contained such type of questions which are relevant (i.e. cost of production and selling price of mustard etc.) to the study.
3.6 Data Collection and processing
Generally most farmers in Bangladesh do not keep written records on annual or daily transactions or activities. So, it was very difficult to collect data and the researcher had to rely completely on the memory of the farmers. Data for the study were collected from 1st January to 30th January, 2020. Data were collected from the respondents through face to face interviews by the researcher himself. During data collection the objectives of the study were clearly explained to the respondents so that they could respond freely.
Producers were interviewed at two selected villages under Belkuchi upazila in Sirajganj district. The respondents were interviewed during their leisure time so that they could respond easily. To overcome errors and to ensure collection of accurate data from the field/study area, all possible measures were taken. Such as, after completion of each interview, each schedule was checked and verified to make sure that answer to each item had been properly recorded. If there were any items which were overlooked or contradictory, the respondents were again interviewed for relevant corrections.
Adequate measures were taken to make the information was reliable and accurate to
make them meaningful for the present study. Secondary data regarding areas, production, market value and other related aspects of mustard production and mustard marketing were collected from various published books, reports and journals. For this study the data obtained refers to last mustard season. After the collection of data, each schedule was verified for the sake of consistency and completeness. Editing and coding were done before putting the data in the master sheets. All the collected data were summarized and scrutinized carefully and necessary summary tables were made from the excel sheets.
3.7 Analytical Technique
Tabular analysis was used mainly based on average, In order to arrive at a meaningful conclusion a mainly tabular method of analysis was followed. By using arithmetic means and percentage of different costs, gross margins and net profit were calculated in the tabular form.
3.7.1 Procedure for computation of cost and Return
The cost of inputs for agricultural production is an important factor which affects the decision making process of farmers. Farmers in the study area used purchased as well as home supplied inputs which were valued at the prevailing market rate and sometimes at government rates in the area during the surveys period or as per the price at which farmers bought the inputs. Pricing of the purchased inputs was easy whereas the prices of home supplied inputs were estimated by using the opportunity cost principle.
Opportunity cost of an input is defined as the income which an input is capable of earning in an alternative employment in or outside the farm. The profitability of mustard production was calculated by the following indices.
These indices were previously used by (Hasan et al. 2016). In this study this has been used this method. In calculating cost of the farmer the following components of costs were considered: (a) human labor (b) seed (c) fertilizers (d) pesticides (e) interest on operating capital (f) land use cost.
3.7.2 Cost of human labor
Human labor is the most important input in producing and marketing every agricultural product. It was required for different operations as land preparation, sowing/broadcasting, weeding, fertilizer application, irrigation using, insecticides, harvesting and carrying, threshing and drying, loading and unloading etc. Usually there were two different types of human labor: (a) family labor and (b) hired labor. Family labor included the farmer himself, the adult males and females as well children of a farmer's family and the permanent labor appointed by him. The cost of hired labor was calculated at the wage rate actually paid by the farmers. In this study, human labor was measured in terms of man-days. The cost of human labor was calculated on the basis of the average wage rate.
3.7.3Animal labor cost
Animal were generally used for laddering in land preparation and threshing and animals were hired during cultural operations. Most of the farmers of the study areas used their own animals. Sometimes they also hired power animals on pair hour basis. Animal labor included a pair of animals and an attended. An animal pair day consisted of six hours.
For calculating animal labor cost, the cost of human labor was deducted from the cost paid for the services of a pair of with the ploughman, because the cost of attended was included in the human labor cost.
3.7.4 Machinery cost
The costs of Machinery services were calculated by taking into account the actual costs incurred by the Mustard farmers. In the study area almost all the sample farmers used power tiller and other machineries for land preparation and threshing. They mainly used hired power tiller. A power tiller owner supplied fuel as well as driver for land preparation and threshing. Service charge was included into the machinery cost.
3.7.5 Seed cost
For growing mustard, farmers used both home supplied and purchased seeds. The costs of home supplied seeds were determined at the ongoing market rate in the study area and costs of purchased seeds were calculated on the basis of actual prices paid by the farmers.
3.7.6 Cost of fertilizers
In general, farmers used a higher level of fertilizers. The farmers used four kinds of fertilizer namely, Urea, Triple Super Phosphate (TSP), Muriate of Potash (MP) and gypsum in these areas. Costs of these fertilizers were estimated at prevailing market prices during the period of study.
3.7.7 Interest on operating capital
Including cash expenses on purchased inputs the operating capital, such as, human labor, land preparation, seeds, manure, fertilizers, and insecticides, irrigation, etc. At the rate of 9 % per annum, interest on operating capital was computed. It was considered that if farmers would take loans from a bank, they would have to pay interest rate of 9%.
3.7.8 Land use cost
According to the location, topography and fertility of the soil, the cost of land use was different for different plots. The cost of the land use may be estimated by using one of the following alterative concepts:
1. Interest on value of land 2. Rental value of land
3. Forgoing income from alternative use
At present the second method was used. In this research cost of land was considered by taking into account the rental value of land. Some of the selected farmers rented in cultivable land for a season and they had to pay a certain amount of money (per acre basis) as rental value of land. Other farmers produced crops on their own land. If the owners cultivated their own land by themselves, they could also get rental charge by renting out that land. The money which they could receive (per acre) was considered as rental value of land. In computing land use cost, the average rental value of land per acre for a season considered based on the information provided by the farmer in the study area.
3.7.9 Total variable cost
Total variable cost was estimated adding all the variable costs such as seed cost, hired labor cost, cost of urea, TSP, MP, gypsum and cost of pesticide.
3 5 6 8
Total variable cost = seed cost + labor cost + fertilizer cost + pesticides cost
3.7.10 Total fixed cost
Total fixed cost was estimated adding all the fixed costs such as land use cost and interest on operating capital. Total fixed cost= land use cost + interest on operating capital.
3.7.11 Total cost
Total cost was summation of total variable cost and total fixed cost.
Total cost (full cost) = Total variable cost + Total fixed cost.
Enterprise costing was followed in calculating cost and revenue. Economic performances as well as relative profitability of mustard were calculated on the basis of gross margin and net return analysis.
3.7.12 Margins of farmer
Gross margin of farmer is difference between total revenue and total variable cost (Hasan et al. 2016) used this method.
Gross margin = Total revenue - Total variable cost.
3.7.13 Net farm income
Per acre net farm income was defined by subtracting the total cost (variable cost+fixed cost) from the total revenue obtained from mustard production.
Net farm income = Total revenue - Total cost.
3.7.14 Cobb-Douglas production function
To determine the contribution of the most important variables in the production process, the following type of Cobb-Douglas production function was used in the study.
Y= aX1b1 aX2b2 aX b3 aX4b4 aX b5 aX b6 aX7b7aX b8eui
By taking log in both sides the Cobb-Douglas production function will be transformed into the following double logarithmic form so that it can be solved as a linear relationship;
lnY=lna+b1lnX1+b2lnX2+b3lnX3+b4lnX4+b5lnX5+b6lnX6+...+bnlnXn+ ui Where,
Y = Yield of mustard (Tk. /ha),
a = Constant or Intercept of the function, X1 = Human labor (Tk. /ha),
X2 = Seed (Tk. /ha), X3 = Urea (Tk. /ha), X4 =TSP (Tk. /ha), X5 = MP (Tk. /ha), X6 = Pesticides (Tk. /ha),
bi = Coefficient of respective variables, ln = Natural logarithm,
ui = Error term and i = l, 2 ...n
3.7.15 Undiscounted Benefit Cost Ratio (BCR)
Benefit cost ratio (BCR) of mustard was estimated as the following way
Benefit cost ratio (on total cost) =
MVP MFC
3.7.16 Problems faced in data collection
The researcher had to face following problems in the field during the collection of data.
The farmers did not keep records of their farming activities. Therefore, the researcher had to depend upon their memory. It was difficult to get information from memory.
Most of the farmers in the study area thought that the investigator was a government officer. So, they initially hesitated to answer the questions relating to their income and expenditure. Some were afraid of imposition of new taxes.
Sometimes, the farmers were not available at their home because they remained busy with outside work. That is why sometimes more than two visits were required to get information from them.
3.8 Measurement of Resource Use Efficiency
In order to test the efficiency, the ratio of Marginal Value Product (MVP) to the Marginal Factor Cost (MFC) for each input were computed and tested for its equality to 1. i.e., MVP/MFC = 1.
The marginal productivity of a particular resource represents the additional to gross returns in value term caused by an additional one unit of that resource, while other inputs are held constant. When the marginal physical product (MPP) was multiplied by the product mustard per unit, the MVP was obtained. The most reliable, perhaps the most useful estimate of MVP was obtained by taking resources (Xi) as well as gross return (Y) at their geometric means.
That is, =r
Where, r = Efficiency ratio MVP = value of change in output resulting from a unit change in variable input (BDT) MFC = mustard paid for the unit of variable input (BDT)
Under this method, the decision rules are that, when: r >1, the level of resource use is below the optimum level, implying under-utilization of resources. Increasing the rate of use of that resource will help increase productivity. r <1, the level of resources use is above the optimum level, implying over utilization of resources. Reducing the rate of use of that resource will help improve productivity. r= 1, the level of resource use is at optimum implying efficient resource utilization.
The most reliable, perhaps the most useful estimate of MVP is obtained by taking all input resources (Xi) and gross return(Y) at their geometric means (Dhawan and Bansal, 1977). All the variables of the fitted model were calculated in monetary value. As a result the slope co-efficient of those independent variables in the model represent the MVPs, which were estimated by multiplying the production co-efficient of given resources with the ratio of geometric mean(GM) of gross return to the geometric mean (GM) of the given resources, that is,
MVP (Xi) = βi
Where, Ȳ (GM) = Geometric mean of gross return (BDT)
Ẍi(GM) = Geometric mean of different independent variables (BDT) βi = Co-efficient of parameter i =1,2,… ... n
Ȳ(GM) Ẍi(GM)
CHAPTER IV
DEMOGRAPHIC PROFILE OF GROWERS
In this chapter, the findings of the study and their logical interpretations have been systemically presented in different sections according to the objectives of the study.
Results have been discussed in relation to other similar studies wherever applied. The first section of the study deals with selected demographic characteristics of the sample farmers. Demographic characteristics of the farmers often influence their production decision. Decision making behavior of individual is determined to a large extent by his demographic characteristics. However, it was not possible to collect detailed information regarding the demographic characteristics of the sample farmers. Some important characteristics were considered in this study such as age, education, family size, farm size, occupation, annual family income and experience in mustard cultivation etc. A brief description on these aspects is presented under the following sections.
4.1 Age
Age of the farmers ranged from 20 to 70 years. On the basis of age, the farmers were classified into three categories: 20-35 years, 36-50 years and above 50 years. The
distribution of the farmers according to their age is shown in Table 4.1.
Table 4.1 Distribution of the farmers according to their age
Age group (Years) Farmers
Small Medium Large All farmers
Number (%) Number (%) Number (%) Number (%)
20-35 years 7 (35) 3 (15) 2 (10) 12 (20)
36-50 years 9 (45) 11 (55) 15 (75) 35 (58.33)
Above 50 years 4 (20) 6 (30) 3 (15) 13 (21.67)
All age group 20 (100) 20 (100) 20 (100) 60 (100) Source: Field Survey, 2020
Age of the farmers are presented in Table 4.1 the farmers were classified into
three age groups:20-35 years, 36-50 years and above 50 years. Out of 60
sample farmers of all categories, 58.33 percent belonged to the age group of 36-
50years, 20 percent 20-35 years and 21.67 percent was above 50 years age
group. On the other hand, out of 20 farmers of small farm categories, 45 percent
belonged to the age group of 36-50 years, 35 percent 20-35 years and 20 percent were in the Age group of above 50
years (Table4.1).On the other hand out of 20 farmers of medium farm categories, 55 percent belonged to the age group of 36-50 years, 15 percent 20-35 years and 30 percent was in the age group of above 50 years (Table 4.1). On the other hand, out of 20 farmers of large farm categories, 75 percent belonged to the age group of 36-50 years,10 percent 20-35 years and 15 percent was in the age group of above 50 years (Table 4.1). This findings imply that the majority of the sample farmers were in the most active age group of 36- 50 years indicating that they provided more physical efforts for farming and this age group are supposed to have enormous vigor and risk bearing ability.4.2 Education
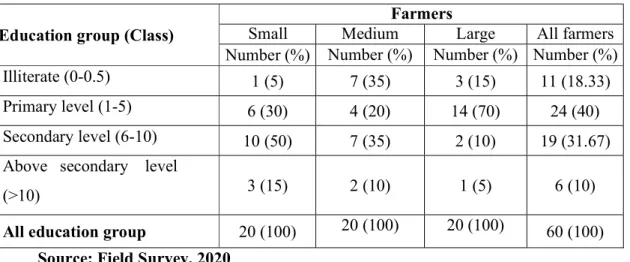
The education scores of the farmers ranged from 0 to 18. On the basis of their educational scores, the farmers were classified into five categories, namely illiterate (0- 0.5), primary (1-5), secondary level (6-10) and above secondary level (>10). The distribution of the farmers according to their education is shown in Table 4.2.
Table 4.2 Distribution of the farmers according to their education
Education group (Class) Farmers
Small Medium Large All farmers
Number (%) Number (%) Number (%) Number (%)
Illiterate (0-0.5) 1 (5) 7 (35) 3 (15) 11 (18.33)
Primary level (1-5) 6 (30) 4 (20) 14 (70) 24 (40)
Secondary level (6-10) 10 (50) 7 (35) 2 (10) 19 (31.67) Above secondary level
(>10) 3 (15) 2 (10) 1 (5) 6 (10)
All education group 20 (100) 20 (100) 20 (100) 60 (100) Source: Field Survey, 2020
Literacy plays an important role in accelerating agricultural development of a country in the sense that the literate farmers tend to apply modem technology. Table 4.2 shows the literacy levels of different categories of farmers. In the case of small farms, 50 percent farmers had secondary level of education, 15 percent had above secondary school level ,30 percent primary level and 5 percent had illiterate level of education. In the case of medium farms, 20 percent farmers had primary level, 35 percent illiterate,
10 percent above secondary level and 35 percent secondary level of education. On the other hand in the case of large farms,70 percent farmers had primary level, 15 percent had illiterate, 10 percent had secondary level of education and 5 percent had above secondary level of education.
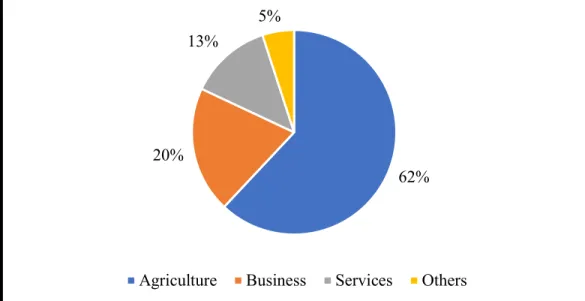
4.3 Occupation
On the basis of their occupation, the respondents were classified into four categories namely, agriculture, business, service and others. The scale used for computing the occupation score of a respondent is given Figure 4.1.
Source: Field Survey, 2020
Figure 4.1 Distribution of the farmers according to their occupation
Data contained in the Figure 4.1 indicated that the highest proportion (62%) of the respondents had agriculture and (20%) had business, (13%) had service holder and 5%
had others occupation, respectively.
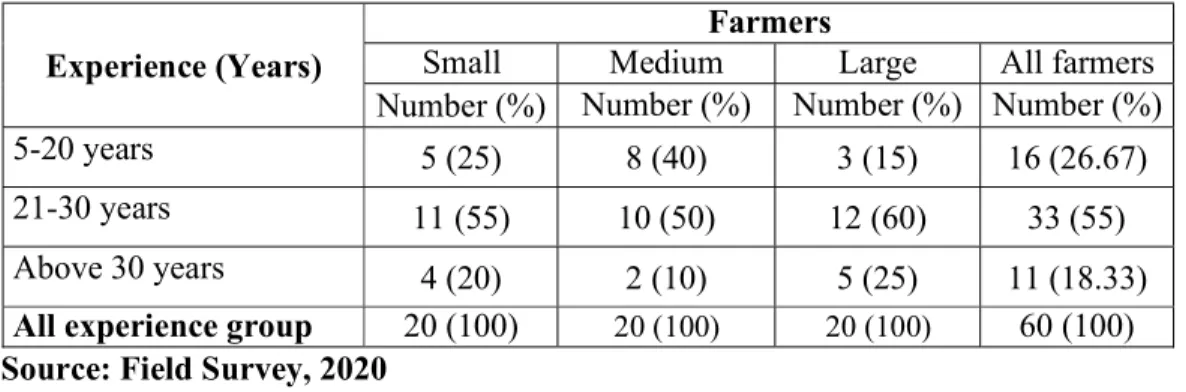
4.4 Experience in mustard cultivation
Experience in mustard cultivation of the farmers ranged from 5 to 35 years. On the basis of experience, the farmers were classified into three categories:5-20years, 21-30 years and above 30 years. The distribution of the farmers according to their experience is shown in Table4.3.
20% 62%
13% 5%
Agriculture Business Services Others
Table 4.3 Distribution of the farmers according to their experience in mustard cultivation
Experience (Years) Farmers
Small Medium Large All farmers
Number (%) Number (%) Number (%) Number (%)
5-20 years 5 (25) 8 (40) 3 (15) 16 (26.67)
21-30 years 11 (55) 10 (50) 12 (60) 33 (55)
Above 30 years 4 (20) 2 (10) 5 (25) 11 (18.33)
All experience group 20 (100) 20 (100) 20 (100) 60 (100) Source: Field Survey, 2020
The Table 4.3 shows, out of 20 small farmers, 25 percent had 5-20 years’ experience, 55 percent 21-30 years’ experience and 20 percent had above 30 years’ experience (Table 4.3).
On the other hand, out of 20 medium farmers, 50 percent had 21-30 years’ experience, 40 percent had 5-20 years experience and 10 percent and above 30 years experience (Table4.3).
On the other hand, out of 20 large farmers, 60 percent had 21-30 years’ experience, 15 percent 5-20 years’ experience and 25 percent had above 30 years’ experience (Table4.3).
4.5 Family size
The family size of the farmers ranged from 2 to 11 members. On the basis of their family size the farmers were classified into the following three categories: small family (2-4), medium family (5-6) and large family (above 6). Table 4.4 contains the distribution of the farmers according to their family size.
4.4 Distribution of the farmers according to their family size
Family size (Numbers) Farmers
Small Medium Large All farmers
Number (%) Number (%) Number (%) Number (%) Small family (2-4) 5 (25) 7 (35) 4 (20) 16 (26.67) Medium family (5-6) 12 (60) 11 (55) 13 (65) 36 (60) Large family (above 6) 3 (15) 2 (10) 3 (15) 8 (13.33) All family size group 20 (100) 20 (100) 20 (100) 60 (100) Source: Field Survey, 2020
The family size and its composition are related to both occupation and income. In this study a family has been defined as a group of persons living together and taking their meals from the same kitchen under the administration of the head of the family. It included husband, wife, son, daughter, brother, sister, parents and permanent hired labour. The Table 4.4 shows the average family size of the selected farmers under different farming systems. Out of 20 small farmers, 60 percent had medium family of 5-6 members, 25 percent had small family of 2-4 persons and 15 percent had large family size of above 6 persons (Table 4.4). On the other hand, out of 20 medium farmers, 35 percent had small family size of 2-4 persons, 55 percent had medium family of 5-6 persons and 10 percent had large family size of above 6 persons (Table4.4). On the other hand, out of 20 farmers of large farmers, 20 percent had small family size of 2-4 persons, 65 percent had medium family of 5-6 persons and 15 percent had large family size of above 6 persons (Table4.4).
4.6 Farm size
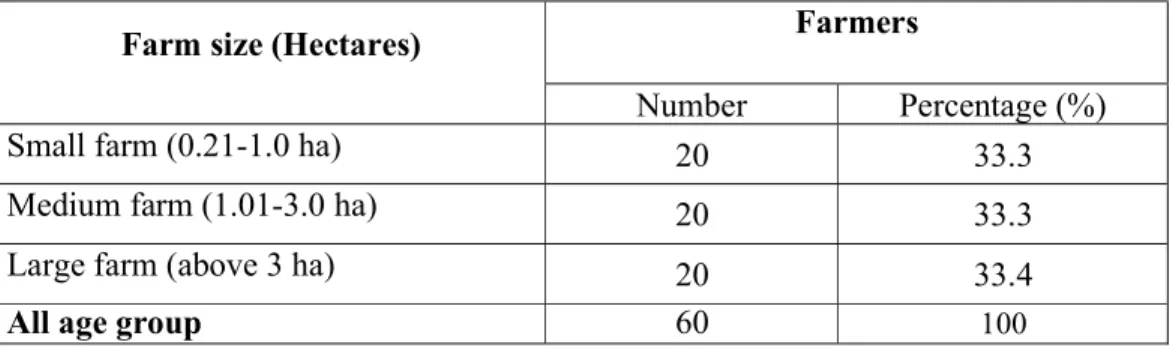
The farm size of the respondents varied from 0.20 to 3.75 hectares. The respondents were classified into three categories based on their farm size as followed by DAE (DAE, 1999): small farm (0.21 – 1.0 ha) and medium farm (1.0 -3.0 ha) and large farm (above 3 ha). The distribution of the farmers according to their farm size is shown in Table4.5.
Table 4.5 Distribution of the farmers according to their farm size
Farm size (Hectares) Farmers
Number Percentage (%)
Small farm (0.21-1.0 ha) 20 33.3
Medium farm (1.01-3.0 ha) 20 33.3
Large farm (above 3 ha) 20 33.4
All age group 60 100
Source: Field Survey, 2020
Table 4.5 indicated that 33.3 percent of the farmers possessed small farms, 33.3 and 33.4 percent of them having medium farms and large farm size.
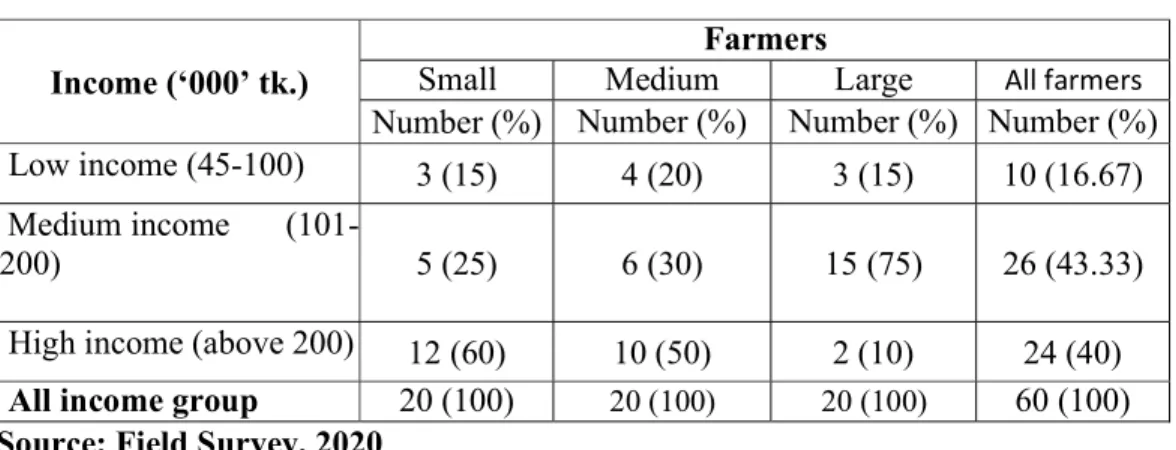
4.7 Annual family income
Annual income score of the respondents ranged from 20 to 562 (in thousands). On the basis of the observed scores, the respondents were classified into three categories as
Table 4.6 Distribution of the farmers according to their annual income
Income (‘000’ tk.) Farmers
Small Medium Large All farmers
Number (%) Number (%) Number (%) Number (%) Low income (45-100) 3 (15) 4 (20) 3 (15) 10 (16.67) Medium income (101-
200) 5 (25) 6 (30) 15 (75) 26 (43.33)
High income (above 200) 12 (60) 10 (50) 2 (10) 24 (40) All income group 20 (100) 20 (100) 20 (100) 60 (100) Source: Field Survey, 2020
Table 4.6 indicated that majority 15 percent of the small farmers had 45-100 thousand annual family income followed by 25 percent of the small farmers had 101-200 thousand annual family income and 60 percent of the small farmers had above 200 thousand annual family income. About 20 of the medium farmers had 45-100 thousand annual family income, while 30 percent of them having above 101-200 thousand annual family income and 50 percent of the medium farmers had above 200 thousand annual family income. Data presented in the Table 4.6 revealed that the highest 75 percent of the large farmer’s had 101-200 thousand income compared to 15 percent of the large farmers having 45-100 thousand annual family income and only 10 percent of the large farmers had above 200 thousand annual family income.
CHAPTER V
PROFITABILITY OF MUSTARDCULTIVATION
5.1 Introduction
This chapter mainly deals with the estimation and analysis of costs of mustard production. The costs were classified into variable costs and fixed costs. Most of the inputs were valued at the current market price and sometimes governments’ price in the study area during the survey period and also the prices at which farmers bought the inputs. But, for some unpaid inputs such as family labor, non-cash price was actually paid and pricing was very difficult in such cases. In these cases, the rule of opportunity cost was followed.
5.2 Pattern of input use
5.3. Pattern of input use for mustard cultivation
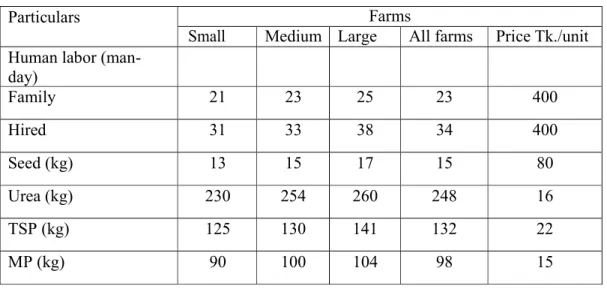
Farmers in the study areas used various inputs for mustard cultivation (Table-5.1).
Farmers used family labor per hectare was 23 man-days and hired labor per hectare was 34 man-days. On an average, they sowed 15 kg seed per hectare of farms. They applied at the rate of urea 248 kg/ha, TSP 132 kg/ha and MP 98 kg/ha. It was observed that among the chemical fertilizer, farmers used highest amount urea for the farms.
Table 5.1 Level of input use per hectare of mustard cultivation
Particulars Farms
Small Medium Large All farms Price Tk./unit Human labor (man-
day)
Family 21 23 25 23 400
Hired 31 33 38 34 400
Seed (kg) 13 15 17 15 80
Urea (kg) 230 254 260 248 16
TSP (kg) 125 130 141 132 22
MP (kg) 90 100 104 98 15
The recommended fertilizer dose as given below:
i. N : 115 kg ha-1 ii. P2O5 : 86.4 kg ha-1 iii. K2O : 60 kg ha-1 iv. ZnO2 : 5 kg ha-1 v. . S : 27 kg ha-1
vi. Boric Acid : 10 kg ha-1 5.4 Human labor cost
In this study area hired labor cost were Tk. 12400, 13200 and 15200 per ha of mustard production for small, medium and large farm respectively (Table 5.2).
5.5 Cost of land preparation
Average land preparation cost of the study area were Tk. 2134, Tk. 2537 and Tk. 2813 per ha for small medium and large mustard farm respectively (Table 5.1).
5.6 Seed cost
In case of mustard cultivation local variety were used. The costs of seed were determined at the ongoing market rate in the study area and costs of purchased seed were calculated on the basis of actual price paid by the farmers. Seed cost per ha in the study area wereTk.1040, 1200 and 1360 per ha for small, medium and large farm respectively (Table5.2).
5.7 Cost of fertilizers
In general, farmer used higher level of chemical fertilizer. Farmer used three kinds of fertilizer namely urea, triple super phosphate (TSP) and muriate of potash (MP) in the study area. Costs of these fertilizers were estimated on the basis of market price.The unit price of urea were Tk.16 per kg and On an average, total cost of urea fertilizer were Tk. 3680, 4064 and 4160 per ha for small, medium and large farm respectively (Table 5.2). The unit price of TSP were Tk. 22 per kg and On an average, total cost of TSP fertilizer were Tk. 2750, 2860 and 3102 per ha for small, medium and large farm respectively (Table5.2). The unit price of MP were Tk. 15 per kg and On an average, total cost of MP fertilizer wereTk.1350,1500 and 1560 per ha for small, medium and large farm respectively (Table5.2).
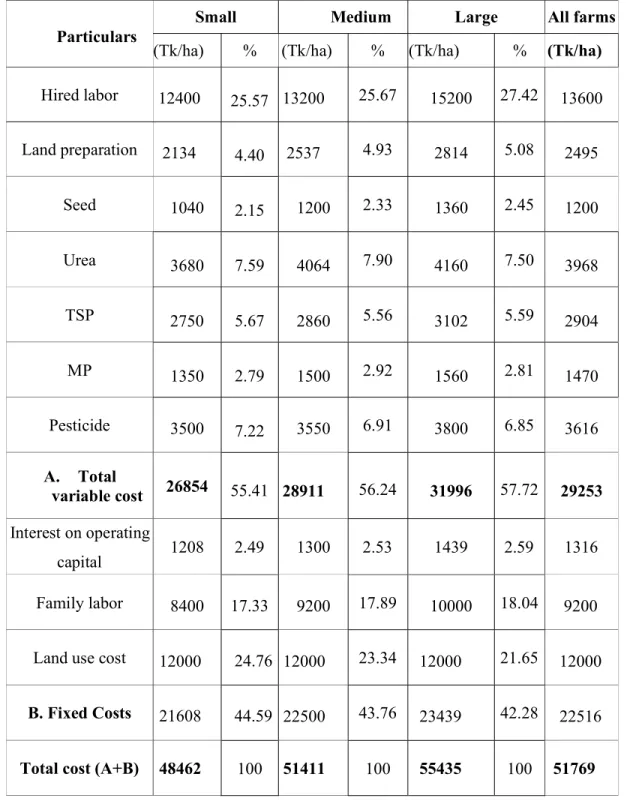
Table 5.2 Per hectare cost of mustard cultivation in the study area
Particulars Small Medium Large All farms
(Tk/ha) % (Tk/ha) % (Tk/ha) % (Tk/ha) Hired labor 12400 25.57 13200 25.67 15200 27.42 13600
Land preparation 2134 4.40 2537 4.93 2814 5.08 2495
Seed 1040 2.15 1200 2.33 1360 2.45 1200
Urea 3680 7.59 4064 7.90 4160 7.50 3968
TSP 2750 5.67 2860 5.56 3102 5.59 2904
MP 1350 2.79 1500 2.92 1560 2.81 1470
Pesticide 3500 7.22 3550 6.91 3800 6.85 3616
A. Total
variable cost 26854 55.41 28911 56.24 31996 57.72 29253 Interest on operating
capital 1208 2.49 1300 2.53 1439 2.59 1316
Family labor 8400 17.33 9200 17.89 10000 18.04 9200
Land use cost 12000 24.76 12000 23.34 12000 21.65 12000 B. Fixed Costs 21608 44.59 22500 43.76 23439 42.28 22516
Total cost (A+B) 48462 100 51411 100 55435 100 51769 Source: Field survey, 2020
5.8 Cost of pesticides
Mustard growers used insecticides to protect their crop from the attack of pest and diseases. They used insecticides like Diazinon, Furadon, Bashudin, Dimecron,Ronster etc. Costs of these pesticides were estimated on the basis of market price. On an average total cost price of pesticides in the study area were Tk. 3500, 3550 and 3800 per ha for small, medium and large farm respectively (Table5.2).
5.9 Total variable cost
In the study area, total variable cost wereTk.26854, 28911 and 31996 per ha for small, medium and large farm respectively (Table5.2).
5.10 Total Production Cost
To get the average total production cost of all the resources used by farmer of the study area of mustard per ha were Tk. 48462, 51411 and Tk. 55435 for small, medium and large farm respectively (Table 5.2). Total cost is the sum of total fixed cost and total variable cost.
Per ha costs were calculated for all inputs both home supplied and purchased for producing mustard. In calculating the cost of mustard, the following components of production cost were considered.
5.11 Interest on operating capital
Average interest of farmers pay on operating capital in the study area were Tk. 1208, 1300 and 1439 in a season per ha for small, medium and large farm respectively (Table 5.2).
5.12 Land use cost
In the study area, it was found that most of the farmers had land of their own for producing mustard. Land use cost was calculated on the basis of cash rental value per acre land for the cropping period of four month. It was estimated according to farmers' statement. In the study area, average land use cost in a season were Tk. 12000 per ha of land ha for small, medium and large farm respectively (Table5.2).
5.13 Total fixed cost
In the study area, total fixed cost was Tk. 21608, 22500 and 23439 per ha for small, medium and large farm respectively (Table 5.2).
5.14 Profitability of mustard cultivation
Profitability of mustard cultivation in the study areas are described below:
5.15 Production of mustard in the study area
Farmers in the study areas are produce different types of mustard. Average production of mustard in the study area were 1309, 1294 and 1279 kg per ha for small, medium and large farm respectively in a cropping season (Table 5.3).
5.16 Total revenue
Average Price of mustard was Tk.50 per kg in the study area. So, revenue from selling mustard in the study area wereTk.65450, 64700 and 63950 per ha in the study area for small, medium and large farm. (Table 5.3).
Table 5.3 Profitability of mustard cultivation per hectare Particulars Small
farm Medium
farm Large farm All farms Total Production
(kg/ha) 1309 1294 1279 1294
Price of mustard
(Tk./kg) 50 50 50 50
Total Revenues (Tk./ha) 65450 64700 63950 64700
Total variable cost
(Tk./ha) 26854 28911 31996 29253
Gross farm incomes
(Tk./ha) 38596 35789 31954 35447
Total cost (Tk./ha) 48462 51411 55435 51769
Net farm income
(Tk./ha) 16988 13289 8515 12931
BCR (Total cost basis) 1.35 1.26 1.15 1.25
BCR (Variable cost
basis) 2.43 2.23 1.99 2.21
Source: Field survey, 2020