LIVELIHOOD ASSETS AND FOOD CONSUMPTION LEVEL OF SLUM DWELLERS IN SOME SELECTED
AREAS OF DHAKA CITY
SOUMEN DAS JOY
DEPARTMENT OF MANAGEMENT AND FINANCE SHER-E-BANGLA AGRICULTURAL UNIVERSITY
DHAKA - 1207
JUNE, 2021
LIVELIHOOD ASSETS AND FOOD CONSUMPTION LEVEL OF SLUM DWELLERS IN SOME SELECTED AREAS OF DHAKA CITY
BY
SOUMEN DAS JOY Registration No: 19-10156
A thesis submitted to
The Department of Management and Finance, Sher-e-Bangla Agricultural University, Dhaka-1207 In partial fulfillment of the requirements for the degree of
MASTER OF SCIENCE IN
MANAGEMENT AND FINANCE SEMESTER: JANUARY-JUNE, 2021
APPROVED BY:
Mosammod Mahamuda Parvin Associate Professor
Department of Management and Finance Sher-e-Bangla Agricultural University
Supervisor
Shah Johir Rayhan Associate Professor
Department of Management and Finance Sher-e-Bangla Agricultural University
Co-Supervisor
Mosammod Mahamuda Parvin Associate Professor
Department of Management and Finance Sher-e-Bangla Agricultural University, Dhaka-1207
Chairman of the Examination Committee
DEPARTMENT OF MANAGEMENT AND FINANCE
Sher-e-Bangla Agricultural University Sher-e-Bangla Nagar
Dhaka-1207
CERTIFICATE
This is to certify that the thesis " LIVELIHOOD ASSETS AND FOOD CONSUMPTION LEVEL OF SLUM DWELLERS IN SOME SELECTED AREAS OF DHAKA CITY" submitted to the faculty of Agribusiness Management, Sher-e- Bangla Agricultural University, Dhaka in partial fulfilment of the requirements for the degree of Master of Science (MS) in Management and Finance, embodies the result of a piece of bona-fide research work conducted by SOUMEN DAS JOY Registration Number: 19-10156. There has been no section of the thesis submitted for any other degree or diploma.
I also confirm that any assistance or information obtained throughout the course of this investigation has been properly recognized.
Date:
Mosammod Mahamuda Parvin Associate Professor Department of Management and Finance Sher-e-Bangla Agricultural University, Dhaka-1207 Supervisor
TO THE BRIGHTEST LIGHTS OF
MY LIFE
MY PARENTS
i
ACKNOWLEDGEMENT
All glory be to God, the Almighty, who graciously permitted the author to complete his research and compose this thesis. For their insightful suggestions, constructive criticism, and technical dictation throughout the research process and thesis preparation, I express my deepest respect, heartfelt gratitude, and sincere indebtedness to my respected supervisor Mosammod Mahamuda Parvin, Associate professor, Department of Management and Finance, Sher-e-Bangla Agricultural University, Dhaka, and co-supervisor Shah Johir Rayhan, Associate Professor, Department of Management and Finance, Sher-e-Bangla Agricultural University, Dhaka. Several persons, particularly several slum dwellers who gave up important time to participate in the survey, provided assistance, and collaboration during the study, the author respectfully respects each and every one of them. The author wishes to express his sincere gratitude to all of his friends for their warm cooperation, consistent inspiration, and unwavering support.
Finally, I owe a huge debt of gratitude to my loving parents, who have sacrificed their happiness not only during my education, but throughout my life.
The Author June, 2021
ii
ABSTRACT
The present study was carried out to identify the livelihood assets, to determine the food consumption level and to identify the problems and constraints faced by the slum dwellers. For this study, a sample of 60 households was selected randomly from Korail slum under Gulshan & Banani Thana and Noyapara slum at Meradia under Khilgaon thana of Dhaka district. Primary data were collected through field survey using an interview schedule. Tabular analysis along with a DFID livelihood asset was used for data analysis. The major findings of the study were that about 55% of the respondents were middle aged between 31 to 45 years, 46.67% received primary education. Average of family size of the respondents was 4.92. Among the respondents, 35% were involved in maid servant. The families of two earning members constituted 66.67%.
Average income and expenditure of the respondents were BDT 177333.67 and BDT 179244.04, respectively. The condition of health status and nutrition was low. About 93.33% of the respondents had cash in hand. Per person per day food consumption level in terms of rice, potato, pulses, oil, milk and fish were 258.96 kcal, 74.23 kcal, 17.6 kcal, 112.89 kcal, 33.56 kcal, 57.25 kcal respectively lower than the national average of those food items and 40% 0f the total households have food security while 60% of them are food insecured.
About 75%, 73.33%, 71.67%, 71.67% and 26.67% respondents faced problems on income, housing, sanitation, drinking water and waste management, respectively. To improve the livelihood and food security of slum dwellers, government and other organizations need to come forward.
iii
CONTENTS
CHAPTER TITLE PAGE NO
ACKNOWLEDGEMENT i
ABSTRACT ii
LIST OF CONTENTS iii-v
LIST OF TABLES vi
LIST OF FIGURES vii
LIST OF APPENDICES vii
01 INTRODUCTION 1-9
1.1 General statement 1-2
1.2 Concept of slum 2
1.3 Classification of slum 3
1.4 Characteristics of slum 3
1.5 Global view of slum condition 3-4
1.6 Slum of Bangladesh: An overview 4-6
1.7 Livelihood 6-8
1.8 Food security 8
1.9 Justification of the study 8-9
1.10 Objectives of the study 9
1.11 Assumptions of the study 9
iv
1.12 Limitations of the study 9
02 REVIEW OF LITERATURE 10-15
03 METHODOLOGY 16-21
3.1 Selection of the study area 16
3.2 Description of the study area 16-17
3.3 Preparation of interview schedule 18
3.4 Period of data collection 18
3.5 Methods of data collection 18
3.6 Sampling procedure 18
3.7 Data analysis 19
3.8 Analytical framework 19-20
3.9 Construction of household food security index 20-21
3.10 Problems faced in data collection 21
04 SOCIOECONOMIC CHARACTERISTICS OF SAMPLE HOUSEHOLDS
22-26
4.1 Age distribution of the respondents 22
4.2 Education level of the respondents 23
4.3 Family size of the respondents 24
4.4 Occupational status of the respondents 24-25 4.5 Distribution of the earning persons to the
respondent households
25
v
CONTENTS (Continued)
CHAPTER TITLE PAGE NO
4.6 Distribution of the respondents based on their income and expenditure
26
05 LIVELIHOOD ASSETS OF THE SAMPLE HOUSEHOLDS
27-31
5.1 Livelihood assets 27
5.1.1 Human assets 28
5.1.2 Social assets 29
5.1.3 Natural assets 30
5.1.4 Physical assets 30-31
5.1.5 Financial assets 31
06 FOOD CONSUMPTION STATUS OF THE HOUSEHOLDS
32-34
6.1 Status of food consumption 32-34
07 PROBLEMS AND CONSTRAINTS FACED BY THE RESPONDENTS
35-37
08 SUMMARY, CONCLUSION AND RECOMMENDATION
38-40
8.1 Summary 38-40
8.2 Conclusion 40
8.3 Recommendations 40
REFERENCES 40-43
APPENDICES 44-51
vi
LIST OF TABLES
Table TITLE PAGE
NO
Table 1.1 Distribution of slums by locality 4
Table 4.1 Age distribution of the respondents 22
Table 4.2 Categories of educational level 23
Table 4.3 Education level of the respondents 23
Table 4.4 Family size of the respondents 24
Table 4.5 Occupational status of the respondents 25
Table 4.6 Distribution of the earning persons to the respondent households
25
Table 4.7 Annual income and expenditure of the respondents 26 Table 5.1 Distribution of household according to human assets 28 Table 5.2 Distribution of respondents according to social assets 29 Table 5.3 Distribution of respondents according to household furniture 30-31 Table 5.4 Distribution of respondents according to financial assets 31 Table 6.1 Food consumption per household per month and person per
day
32 Table 6.2 Difference between per person per day food intake and
national average per person per day food intake
33
Table 6.3 Estimation of the household food security index of the respondents
34
Table 7.1 Problems and constraints faced by the respondents 35
vii
LIST OF FIGURES
FIGURE TITLE PAGE
NO
01 Share of urban population living in slums in Bangladesh from 2005 to 2018
5
02 Map of Korail slum 17
03 DFID approaches of livelihood assets pentagon 19
LIST OF APPENDICES
APPENDICES TITLE PAGE NO
01 Appendices-A 44-51
1
CHAPTER 1 INTRODUCTION 1.1 General Statement
Bangladesh is the 8th most populous country in the world, with a population exceeding 163 million people in an area of 148,460 square kilometers (BBS, 2020). Bangladesh is trapped in the vicious circle of poverty which is characterized by large scale unemployment and underemployment, low level of income, low productivity, weak technological base, market imperfections and lack of skill (Hossain, 2006).
In 2007 the population of Dhaka city was 13.5 million and a report expected that this population will increase in 22 million by the year 2025 (UN, 2008). This influx of people in capital city has forced many low-income groups to live in slums. About 60% of the populations in Dhaka city are migrants where more than 65 per cent of the people live in slum areas. The physical condition of slums is characterized by high density living, improper utilization of public goods, lack of basic amenities, unhygienic and polluted environment, poor literacy rate, unemployment, crime, social, moral and psychological degradation and poor health. Slums mainly provide informal labor market, characterized by low wage, insecurity and uncertainty of working hour. Almost all the newcomers to the city join the informal sectors. The main sectors are garment industry, rickshaw pulling, street vending, construction works and small business. They are living in such houses where ventilation, drinking water, electricity and sewerage facilities are absent and they create new problems like unemployment, underemployment, high incidence of crime, sub- standard housing, transportation and pollution problems (Alamgir et al. 2009).
In both the developed and developing countries, the relation between socio-economic status and health exhibits a common pattern: the lower the socio-economic status the poorer the health (Singh et al. 1996, Papa et al. 2009). In this case most of the slums of Dhaka city are facing various problems and these problems are becoming acute day by day such as intolerable housing conditions, lack of basic services especially drinking water, sanitation and medical treatment, lack of educational facilities, lack of security, lack of utility services like, electricity connection, piped water supply, lack of proper solid waste disposal. Most
2
of the slum dwellers are affected by various kinds of both seasonal and waterborne diseases (Latif et al. 2016).
In this research we want to know the socio-economic conditions of slum dwellers and expected output of their calorie intake level, problems and other difficulties regarding their life and livelihood.
1.2 Concept of slum
A slum is a highly populated urban residential area consisting of densely packed housing units of weak build quality. A slum is a compact settlements of 5 or more households which generally grow very unsystematically and haphazardly in an unhealthy condition and atmosphere on government and private vacant land (Hossain, 2020).
Slums are defined as settlements with a minimum of 10 households or a mess unit with a minimum of 25 members and predominantly very poor housing; very high population density and room crowding; very poor environmental services, especially water and sanitation; very low socio-economic status; lack of security of tenure (Hossain, 2020).
Although slums are usually located in urban areas, in other countries they can be located in suburban areas where housing quality is low and living conditions are poor. While slums differ in size and other characteristics, most lack reliable sanitation services, supply of clean water, reliable electricity, law enforcement, and other basic services (Wikipedia).
The World Bank, in a survey report define slum as a residential area where more than three hundred people live in one acre of land. An average of more than three adults lives in a room, 46 percent of the houses are one roomed and average size is 120 square feet, ventilation, drinking water, electricity and sewerage facilities are absent in this houses (Democracy Watch, 2002).
1.3 Classification of slum
Slums cab be divided into three groups (Bhuiyan, 2017):
1. Unauthorized occupation of government and semi-government lands
2. Living in thatched houses made of papers, polythene, tin etc., built on unauthorized vacant land near railway lines or on the footpath or by side of the main roads
3. Living in unauthorized private lands.
3
1.4 Characteristics of slum
The main characteristics of slums are given below (Bhuiyan, 2017):
1. High rate of poverty
2. High incidence of unemployment 3. Huge extent of urban decay
4. Breeding grounds for social problems like crime, drug addiction, alcoholism etc.
5. High rates of mental illness and suicide etc.
6. Low level of economic status of its residents 7. Inadequate infrastructural facilities
8. Acute problem of malnutrition 9. Lack of drinking water
10. Lack of basic healthcare
11. Unsanitary and unary environment
12. Low standard of living or poor quality of life.
1.5 Global view of slum condition
In 19th and 20th centuriesslums were common in the United States and Europe. New York City is believed to have created the world’s first slum, named the Five Points in 1825, as it evolved into a large urban settlement (Wikipedia). More recently slums have been predominantly found in urban regions of developing and undeveloped parts of the world, but are also found in developed economics. Slum creates many obstacles in the development of a country (Rahman et al. 2015).
After the independence of Bangladesh, the urban areas have experienced massive population growth due to urban opportunities and rural calamities resulting rapid growth of urban squatter settlements across the country. While still predominantly rural with about 34% of its population living in urban areas, Bangladesh is urbanizing rapidly and is expected to have more than 50% urban population by 2050 (UN, 2014). About 55% of urban population lives in urban slums: there are intra- and intercity variations in population size, density, the percent of the urban population living in slums, and sanitation conditions (Angeles et al. 2009; UN-Habitat, 2016).
4
1.6 Slum of Bangladesh: An overview
The population of Bangladesh in 2020 was 164,689,383, a 1.01% increase from 2019. The population of Bangladesh in 2019 was 163,046,161, a 1.03% increase from 2018 (UN, 2019). About 156 million people live in this country including 47 million poor and 7.8 million slum people (UNDP, 2013). In addition, it is a “Low human development country”
and ranked 147 with Human development index (HDI) score 0.512 (Hossain, 2014).
Basically, slum population increases for eight reasons such as river erosion, uprooted, driven out, abandoned, insufficient income, insecurity, for job and others (Slum census, 2014).
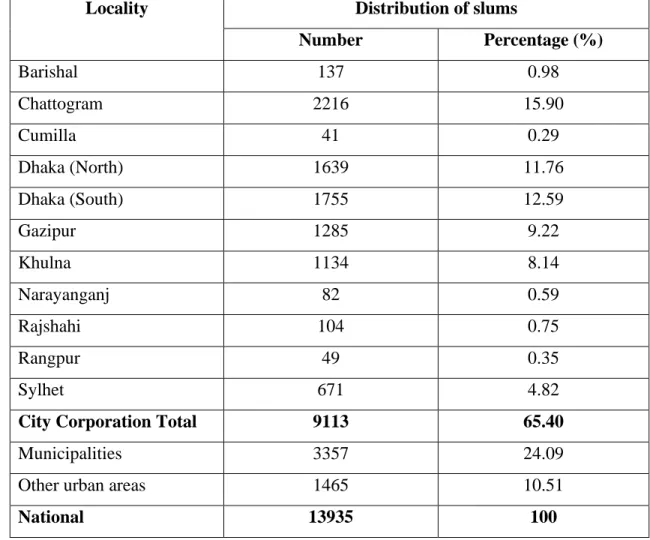
Table No. 1.1: Distribution of slums by locality (City Corporation, Municipalities &
Other Urban Areas)
Locality Distribution of slums
Number Percentage (%)
Barishal 137 0.98
Chattogram 2216 15.90
Cumilla 41 0.29
Dhaka (North) 1639 11.76
Dhaka (South) 1755 12.59
Gazipur 1285 9.22
Khulna 1134 8.14
Narayanganj 82 0.59
Rajshahi 104 0.75
Rangpur 49 0.35
Sylhet 671 4.82
City Corporation Total 9113 65.40
Municipalities 3357 24.09
Other urban areas 1465 10.51
National 13935 100
Source:Census of Slum Areas and Floating Population, 2014
5
The number of slums in Chattogram City Corporation was 2216 (15.90%), Dhaka (North) City Corporation was 1639 (11.76%) whereas in Dhaka (South) City Corporation it was 1755 (12.59%). The Khulna City Corporation has 1134 (8.14%), Rajshahi City Corporation has 104 (0.75%). In the city corporation areas (all) number of slums were 9113 (65.40%), in municipal areas 3357 (24.09%) and in other urban areas 1465 (10.51%) (Slum census, 2014). It has been placed in Table 1.1
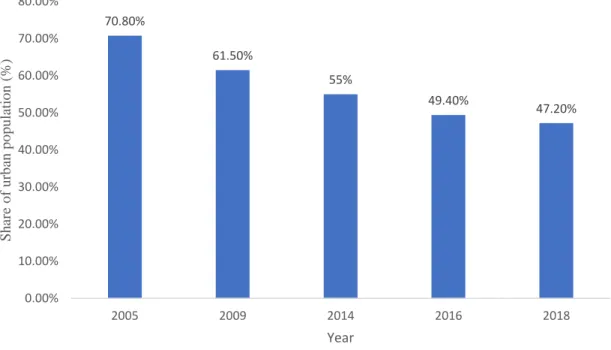
Share of urban population living in slums in Bangladesh from 2005 to 2018
From the figure, in 2018, the share of the urban population living in slums in Bangladesh amounted to 47.20%. This was a decrease from 2005, in which just under 70.80% of Bangladesh's urban population were living in slums.
Figure 1.1: Share of urban population living in slums in Bangladesh from 2005 to 2018 (Statista, 2021).
1.7 Livelihood
A livelihood comprises the capabilities, assets (stores, resources, claims and access) and activities required for a means of living: a livelihood is sustainable when it can cope with and recover from stress and shocks, maintain or enhance its capabilities and assets, and
70.80%
61.50%
55%
49.40%
47.20%
0.00%
10.00%
20.00%
30.00%
40.00%
50.00%
60.00%
70.00%
80.00%
2005 2009 2014 2016 2018
Share of urban population (%)
Year
6
provide sustainable livelihood opportunities for the next generation; and which contributes net benefits to other livelihoods at the local and global levels and in the short and long term (Conway and Chambers, 1992).
A person's livelihood refers to their ‘means of securing the basic necessities (food, water, shelter and clothing) of life’. Livelihood is defined as a set of activities essential to everyday life that are conducted over one's life span. Such activities could include securing water, food, fodder, medicine, shelter and clothing. An individual's livelihood involves the capacity to acquire aforementioned necessities in order to satisfy the basic needs of themselves and their household (Wikipedia).
Sustainable livelihood (SL) thinking gained ground in the Department for International Development (DFID) poverty reduction efforts in 2002. The guiding assumption of the DFID approach is that people pursue a range of livelihood outcomes by which they hope to improve or increase their livelihood assets and to reduce their vulnerability. The five types of assets that form the core of livelihood resources in the DFID SL framework range.
The model breaks access into the five assets: (1) Natural asset (2) Physical asset (3) Human asset (4) Financial asset and (5) Social asset.
Human asset is an intangible asset or quality not listed on company’s balance sheet. It can be classified as the economic value of a worker’s experience and skills. This includes assets like education, training, intelligence, skills, health etc. Physical assets are tangible assets and can be seen and touched, with a very identifiable physical presence. Physical assets include things like property, plant, and equipment as well as inventories. Physical asset consists of physical infrastructure, household elements, tools, equipment etc. Natural assets can be defined as the world’s stocks of natural assets which include geology, soil, air, water and all living things. Natural assets are the assets of natural environment. This consists of biological assets (produced or wild), land and water areas with their ecosystems, subsoil assets and air. A financial asset is a non-physical asset whose value is derived from a contractual claim, such as bank deposits, bonds, and participations in companies' share capital. Social asset is an attribute that has value only because of the social institutions governing society. Financial assets are usually more liquid than other tangible assets, such as commodities or real estate.
7
In conventional economics such assets are usually known as factors of production and are typically subdivided into land (natural asset), labor (human asset) and capital (physical and financial asset). Conventional economics does not have a social capital category. Social capital may refer to the ability to access and use the socially constructed rules, organizations or relationships (Ellis, 2000).
Livelihood assets are something from which people acquire a flow of income or consumption. They are also something people invest in so as to increase future flows of income or consumption. Livelihood strategies may focus on increasing the range of assets to which a person or household has access, or on increasing access to particular types of capital. The main objective of these investment strategies is to improve long-term livelihood security and the quality of life (Ellis, 2000).
1.8 Food security
Food security is the measure of the availability of food and individuals' ability to access it.
According to World Food Summit (WFS) in November 1996, “Food security exists when all people, at all times, have physical, social and economic access to sufficient, safe and nutritious food which meets their dietary needs and food preferences for an active and healthy life.”
The definition of food security took in the economic as well as the physical aspects of availability of food and to alleviate poverty and enhance the role of women in the development process attention was drawn.
A household is food secure if it can reliably gain access to food in sufficient quantity and quality for all household members to enjoy a healthy and active life. A critical feature of the definition is that food availability does not equal food security (Maxwell &
Frankenberger, 1992).
1.9 Justification of the study
Dhaka is a metropolitan city with high density population. The major percentages of this population are migrant urban poor from rural areas for better economic opportunities due to various reasons (Sinthia, 2020). The rate of urban poor is increasing inevitably in every sphere of urban cities in Bangladesh and Dhaka is the most affected one. For any
8
development of the slum dwellers, it is necessary to collect data, information and conduct in-depth research related to slum dwellers.
The main focus of this research is to understand and analyze the socioeconomic conditions, livelihood assets, calorie intake level and identify the problems and constraints faced by the slum dwellers. In this study the researcher would know the overall socioeconomic conditions of slum dwellers such as age, education level, family size, occupational status, annual income etc. and also know the livelihood assets, food consumption level of slum dwellers. It could be important research to explore the different aspects of slum dwellers and took initiatives accordingly.
1.10 Objectives of the study
The main objectives of this research are as follows:
1. To analyze the socioeconomic characteristics of the sample households;
2. To identify the livelihood assets of the sample households;
3. To determine the food consumption level of the sample household; and 4. To identify the problems and constraints faced by the slum dwellers.
1.11 Assumptions of the study
The present study was carried out on the basis of the following assumptions:
• The collected data were free of biasness. The respondents included in the sample were representative of the population in the selected slums and data were collected as objectively as possible.
• The target respondents were capable of answering the questions correctly and accurately.
• Information provided by the respondents were considered reliable.
• The findings would give a clear indication of livelihood assets, calorie intake level, problems and constraints faced by the slum dwellers etc.
9
1.12 Limitations of the study
The study was subjected to a number of following limitations:
➢ The sample size consisted of only 60 respondents so the findings may not represent all the aspects of slum dwellers.
➢ Most of the respondents were not well educated, it is very difficult to get accurate information because they do not keep any written records with respect to their activities, production or income and
➢ In response to investigator’s questions the respondents used local units of measurement, which is converted to standard units to place in the thesis.
10
CHAPTER 2
REVIEW OF LITERATURE
Themain purpose of this chapter is to provide a selected review of the recent past research works related to the present study. The review of previous studies may give the proper ways and ideas to conduct present research. The review of literature rationalizes the significance of the problem, understands the structure of the subject and distinguishes what has been done and what needs to be done. So, the review of previous research articles and papers is also crucial for conducting any research.
Akter (2010) examined Climate change threatens peoples’ access to food as they become socioeconomically susceptible. Displaced people living in urban slums are in search of better and secure life. But urban slums located mostly in low lying environmentally hazardous area coupled with inadequate facilities like food, shelter, sanitation, health care make their life even worse. This paper depicts socioeconomic condition of slum dwellers and their consumption pattern, while it has been found that majority of them can’t afford nutritious food which is expensive to them. Planned migration and secured socioeconomic factors are suggested through this paper to lessen exposure to further poverty and food insecurity of urban poor.
Bhuiyan (2017) studied to find the relation between life style of slum people and diseases, they usually suffer. Smoking habits, sanitation type, water treatment systems, food habits are largely related to asthma, diarrhea and skin diseases. Most of the slum dwellers use tube well water for all purposes of their work, thus density of population, unhealthy life condition, unhealthy sanitary systems, lack of physical activity leads them to suffer by different diseases like Diarrhea, Hypertension, Skin Disease are the common diseases in the slum dwellers. Slum dwellers are not even properly aware about vaccination.
Goswami and Manna (2013) examined the living conditions in slums have a direct impact on people’s health. Their low socio-economic status, low level of education and high fertility and mortality- all indicate that they need special attention in terms of public health,
11
family planning and reproductive health programs. Rapid slummification has caused wide spread of environmental degradation in the urban city.
Hossain (2014) investigated in his article that, there is high rate of unemployment among the slum dwellers. The employment pattern of the slum dwellers shows that most of the male slum dwellers in notified and non-notified slums were engaged as daily wage earners.
They worked as rickshaw pullers, Tonga pullers, industry workers and construction workers. The major businesses run by these slum dwellers are street vending, hawking, petty shop keeping and selling handicrafts. A few were engaged in services. The higher ratio of domestic women workers in both the notified and non-notified slums is attributed to the greater opportunity of women-oriented work in nearby localities.
Howlader (2009) found in his study that many slum-dwellers end up with lower healthcare than they had in rural areas before they migrated from there. But in the question of how much healthcare to provide to the slum-dwellers, this study warns about the ruralization effect of providing too much healthcare services the slum-dwellers.
Islam et al. (2015) examined the living condition in the slum area is very low. Generally slums are lacking from access to safe water, drainage and sanitation facilities and basic health care facilities. The study has been carried out to assess the present conditions of the water supply and sanitation of the Karail slum of Dhaka city. The level of hygiene knowledge and practice has been found to be significantly low among the Karail slum dwellers. It has found that the sanitary and water supply conditions are improving very slowly.
Jones (2020) that study contributed to a deeper understanding of the complex and inequitable socio-technical infrastructures underlying access to energy for households in particularly challenging environments, the slums of Dhaka, Bangladesh. The nascent energy justice debate is far from comprehensive at this stage of its development, with a deficiency in studies in the global South and for household scale analyses.
12
Lahiry and Shimul (2010) sheds some light about factors that work in determining the determinants of healthcare among slum-dwellers. Demand for healthcare among slum- dwellers depend not only their income, but also on other constrains that they face.
Latif et al. (2016) analyzed that slum dwellers were deprived of basic needs. The study helps to identify the slum problems such as food and housing problems, poor sanitation condition, poor quality or no sewerage and drainage, inadequate educational facilities, lack of utility services like gas facility, electricity connection, piped water supply etc. From this study it is observed that every family live in a slum in unhygienic environment in poor condition. It was also seen that most of the slum dwellers were affected by various kinds of seasonal and waterborne diseases like fever, asthma, skin diseases, diarrhea, jaundice etc. The study finds that poor socio-economic status and inadequacy of urban services has had an immediate effect on urban health specially the slum poor in metropolitan cities in the country.
Madhiwalla (2007) studied the growth of cities has always been accompanied by the growth of slums. Ill health conditions due to overcrowding, poor housing and unsanitary environment, coupled with poverty are found in slum dwellers. The relative difference in income and wealth is much starker in urban areas. The higher purchasing power of the rich people drives up the prices of food and healthcare goods, making them unaffordable to the poor. The rich also consume more than their fair share of public goods, for example, water, infrastructure, electricity, which are often subsidized by the state. Poverty and other forms of social disadvantage translate into poorer health status and outcomes for the urban poor.
Nargis and Rahman (2016) investigated whether consumption of the urban poor of Dhaka city can be improved through micro-credit offered by the Non-Government Organizations (NGO) of Bangladesh. The study revealed that consumption pattern of the poor of Dhaka city did not improve significantly with the use of microcredit. If microcredit could be given in large amount then it might be more effective to the poor of Dhaka city. The study suggested that lenders must scrutinize and consult with the borrowers before delivering the microcredit so that more suitable use of micro-credit can be ensured.
13
Rahman et al. (2009)found on their study about the factors affecting the livelihood of the socioeconomic improvement of migrants and to analyze the causes of rural urban migration in slum areas. Slum areas have no available formal education facilities and slum people were found to be engaged in rickshaw pulling, day laborer, petty business, small job services etc. Analysis showed that migration and taking in micro credit were beneficial for the slum dwellers. Receiving and utilizing micro credit income level, consumption, expenditure and socio-economic status of the slum dwellers improved to some extent. Due to participation of slum dwellers in NGOs, their economic, social and decision making improved substantially. Credit disbursement through NGOs with integrated approach could bring positive changes in the life of poor slum women as well as their community. Findings showed that fifty-six per cent people migrated to Dhaka city for economic reason. Factors of migration had a significant contribution of rural urban migration and also significant livelihood improvement has taken place due to micro credit.
Rokanuzzaman et al. (2013) studied to determine the livelihood status of slum dwellers in some selected areas of North Dhaka City Corporation and to explore the relationship between livelihood statuses of slum dwellers with the selected characteristics. Majority of the slum people were found in the low annual income category, low media contact, low training exposure and medium environmental knowledge. Overall livelihood status of the slum people was found low and majorities (65.37%) of the respondents were found having high problems (such as lack of proper waste management system, lack of proper sanitation and drainage system, water crisis than necessary and lack of proper health facilities).
Roy et al. (2019) conducted a study to assess the present situation of food security in Bangladesh. They also discussed that Bangladesh has made remarkable improvements in food availability, access, and utilization in the last few decades, but it is not the case regarding the food stability. The country experiences numerous challenges regarding food insecurity. Bangladesh has made significant improvement in cereals (rice) production.
Despite the increase in the income of people, the food quality is not good. Unequal land ownership and income distribution have made the food access below par. Food utilization has improved but balanced food intake is still far below the standard.
14
Sen (2015) examined the overall socio-economic conditions of slum dwellers in Basirhat Municipal area, West Bengal are not good at all. Socio-economic characteristics such as age, education level, male-female ratio, family size, occupational status, annual income etc. were considered in his paper. Education is considered as an important factor of the socio-economic characteristics of the household. In slum areas there are no available formal education facilities for slum dwellers. Maximum slum dwellers have no education but some NGOs and organization try to provide them informal education.
Singh (2016) studied the socioeconomic condition of the slum dwellers is generally poor because of the lack of basic social amenities; functional skills, proper education, source of the income, hygiene and health resources. This paper attempts to demonstrate the theoretical ideas relating to socio-economic conditions of slum dwellers and its reasons and to extend appropriate measures for the improvement in the conditions of slum dwellers.
Slum dwellers are the stock of the potential human resource, it can be developed through skill enhancement programs initiated by the government and through appropriate public action relating to social provisions and redistribution social amenities.
Sinthia (2013) examined the reason behind this poverty is low economic growth, inequitable distribution of income, unequal distribution of productive assets, unemployment and underemployment, high rate of population growth, low level of human resource development, natural disasters, and limited access to public services. Along with poverty, creating pressure on urban land, shelter, plots, open spaces this creates environmental and ecological degradation.
Sinthia (2020) revealed that the rate of urban poor is increasing inevitably in every sphere of urban cities in Bangladesh and Dhaka is the most affected one. Government has no or limited control over these due to poor government policy and management, political pressure and lack of resource management. The study focuses on socio demographic analysis, morphological pattern and role of different actors responsible for the
15
improvements of the area and recommended some possible steps for determining the potential outcomes.
Sufaira (2013) discussed about the socioeconomic conditions of urban slum dwellers in Kannur municipality. Slums are the product of socio-economic and cultural conditions of a particular social system inhibiting the physical, mental, moral and social development of the individuals. Socio economic profile of slum dwellers presents a vivid picture of factors such as caste, religion, education, health status and living environment of the family, type of the house, occupation and annual income of the family etc. The employment status is a basic indicator of economic soundness of households. The quality of life is measured directly with the help of the family income.
Uddin et al. (2009) found in their study on the healthcare seeking behavior of street- dwellers in Dhaka city that, not only most squatters have little to no knowledge about the location where to seek out healthcare service, but they didn’t even visit any doctor or provider when they were ill in the year prior to the study.
16
CHAPTER 3 METHODOLOGY
Methodology is an important and essential part for any research. It requires a very careful attention and sincere consideration. Methodology helps the researcher to collect valid and reliable data and to enlarge the information properly to acquire correct conclusion. The researcher had carefully followed a planned methodology in conducting the research which has been discussed in this chapter.
3.1 Selection of the study area
Keeping in view the objectives of the study, data were collected from slums through field survey. Out of many slums in Dhaka city, two slums named Korail and Noyapara slum were purposively selected to collect required data.
The reasons for selecting these areas for the present study were noted below:
• The selection is based on its prime location as it is located besides Gulshan and Banani posh residential area of the Dhaka city.
• These are very old and large slum settlements of city.
• In view of time limit and resources available, this area was thought to be suitable for the study and
• It was expected that the respondents would provide the necessary information.
3.2 Description of the study area
Korail slum is situated in some parts of Banani and Gulshan encircling 19 and 20 wards of Dhaka City Corporation and standing on 99 acres of land. The area of the slum is highly tentative among its residents as they claim it to be roughly between 180 to 220 acres. The slum can be accessed by several roads from Gulshan, Banani and Mohakhali or by water across Gulshan Lake. There are main two units of Korail which is known as Jamaibazar (unit-1) and Boubazar (unit-2). There are four sub-sections within Boubazar known as Ka, Kha, Ga and Gha. In addition, Beltoli Bosti (Slum), T&T Bosti, Baidar Bosti, Ershadnagar
17
and Godown Bosti are also part of greater Korail slum. The slums are gradually expanding across the lake by land reclamation and through the dumping of waste and soil.
Figure 3.1: The map of Gulshan Thana and location of Korail
In Dhaka city, majority of the urban poor are occupied in informal sectors. Slum dwellers were engaged in various kind of occupation such as maid/ home servant, shopkeeper, day labor, rickshaw puller, garments worker and others. Housing condition of the slum is very poor. Most of the people live in temporary home especially tin-shed housing and very small portion of them live in semi pucca/ pucca housing with permanent walls.
Very few houses have roof which is made of brick and cement whereas the roof of maximum houses is made of tin. The remaining houses are made of bamboo, straw and polythene which are known as Jhupri.
18
3.3 Preparation of interview schedule
A interview schedule was prepared on the basis of objectives of the study and it was prepared to collect data by face-to-face interview method. The questions were arranged systematically so that the respondents could answer in a consistent and systematic manner.
3.4 Period of data collection
For this study, data were collected by the researcher himself through personal interview with 60 respondents. Data were collected during the month of February to March, 2021.
3.5 Methods of data collection
Reliable and accurate data is very important for the study. Dillon and Hardaker (1993) have suggested three main techniques by which survey data can be gathered: (i) direct observation, (ii) interviewing respondents and (iii) reviewing records kept by respondents.
For this survey both the primary and secondary data was necessary. The researcher of the study himself visited the study area to collect primary data from slum dwellers. Before collecting the data, the researcher stated the objectives of the research to the respondents.
Interview schedule was re-checked to ensure that all information obtained perfectly after completion of data collection. Secondary data also obtained from secondary sources such as websites, publications, BBS, research reports etc.
3.6 Sampling procedure
It is necessary to select appropriate sample size that will help to achieve the objectives of the study. A sample of 60 households were randomly selected from Korail slum under Gulshan & Banani Thana and Noyapara slum at Meradia under Khilgaon thana of Dhaka district.
Name of the slums No. of sample households
location
Korail slum 50 Gulshan & Banani thana
Noyapara slum 10 Meradia, Khilgaon thana
19
3.7 Data analysis
After completion of data collection, data were checked, scrutinized and carefully edited to get the appropriate and related information, thendata entry was made in computer at MS Excel. Collected data were classified, tabulated and analyzed according to the objectives of the study. The data on age distribution, education, family size, annual income, annual expenditure, annual savings, and food consumption were analyzed through tabular analysis. Data were presented mostly in tabular form, because it is easy to understand.
Tabular analysis was mainly based on some statistical measure like averages, percentages etc.
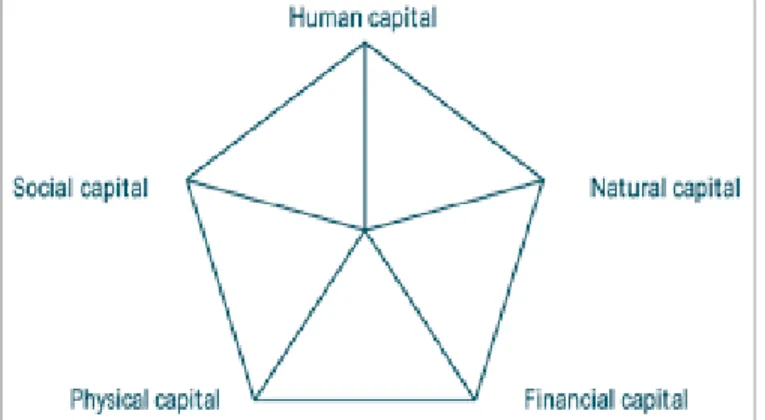
3.8 Analytical framework
According to DFID’s sustainable livelihoods glossary, Livelihood strategies include: how people combine their income generating activities; the way in which they use their assets;
which assets they choose to invest in; and how they manage to preserve existing assets and income. The DFID model breaks access into five assets:
1) Human asset (e. g. education, health);
2) Natural asset (e. g. land);
3) Financial asset (e. g. cash in hand, savings);
4) Social asset (e. g. community networks); and 5) Physical asset (e. g. furniture, electric device)
Figure 3.2: Livelihood Assets pentagon (Source: DFID, 2002)
20
These assets are interlinked and can provide a useful starting point for household livelihood analysis, as it encourages investigators to take into account all the different kinds of assets and resources that are likely to play a role in household livelihood.
To assess the calorie intake level of the sample households' members, the consumption data of sample households of 7 days was measured by standard value of 100 gm each food item.
For the calculation, family members are defined as one adult male and one adult female is 1:1, the child whose age is below 5 years considered as zero and 5 – 10 years considered as half of an adult member.
3.9 Construction of household food security index
Food security is a social sustainability indicator. The commonly used indicators in the assessment of food security conditions are food production, availability, calorie consumption, and nutritional status (Riely et al., 1999). Household food security is the application of this concept at the family level, considering individuals within the households. A household is food-secured if it can meet, either from its production or through purchases, adequate food for meeting the dietary needs of all its members (Maziya- Dixon et al., 2004).
In this study, a household food security index (K) was constructed following the method adopted by Omotesho et al. (2006) as given in Equation (1). This involved two steps:
identification and aggregation. Identification is the process of defining a minimum level of nutrition necessary to maintain a healthy living, that is, food security line. Any household with a food security index score above this line (K ≥ 1) was classified as food secured. The food security line was defined using an average recommended level of the calorie intake of 2400 kcal (FAO, 2002). A household is food-secure if the calorie intake is (K) ≥ 1, 0 = otherwise. Aggregation, on the other hand, derived the daily per capita calorie requirement for households. The calorie content of purchased food items was used to estimate the dietary energy availability in the household. The food security index was calculated using the following formula:
21 𝐾𝑖 =𝑋𝑖
𝑍𝑖
where, Ki is the food security index of the ith household, X is the household's daily per capita calorie, and Z = Household daily per capita calorie required.
3.10 Problems faced in data collection
At the time of data collection researcher had to face some problems that are stated below:
➢ Most of the respondents hesitated to answer the questions since the researcher was unknown to them.
➢ It was difficult to convince the slum dwellers about the importance of the study.
➢ In some cases, the respondents were not available at home, which needed even more than two or three time visits to conduct a single interview.
➢ Another problem to the researcher was that the respondents did not keep any written record of their household income, expenditure, activities and their credit utilization.
➢ Due to little education, respondents were initially unable to understand the questions asked by the researcher.
22
CHAPTER 4
SOCIOECONOMIC CHARACTERISTICS OF SAMPLE HOUSEHOLDS
It is necessary to know the socioeconomic characteristics of the respondents because the socioeconomic characteristics of the respondents influence their daily life. Social status and economic condition are different from one to other. Livelihood pattern, consumption pattern, employment pattern etc. are greatly affected by the socioeconomic characteristics of slum dwellers. This section looks at the socioeconomic characteristics of the sample households. In socioeconomic characteristics, age, education, family size, occupation, annual income etc. are discussed in the following section.
4.1 Age distribution of the respondents
Age of the respondents were classified into three categories, i.e., young (up to 30 years), middle aged (31-60 years) and old aged (>60years)(Source: Rokanuzzaman et al. 2013).
According to that source, major proportions 43.08% of the respondents were young, 20.76% were middle aged and 36.16% were old aged.
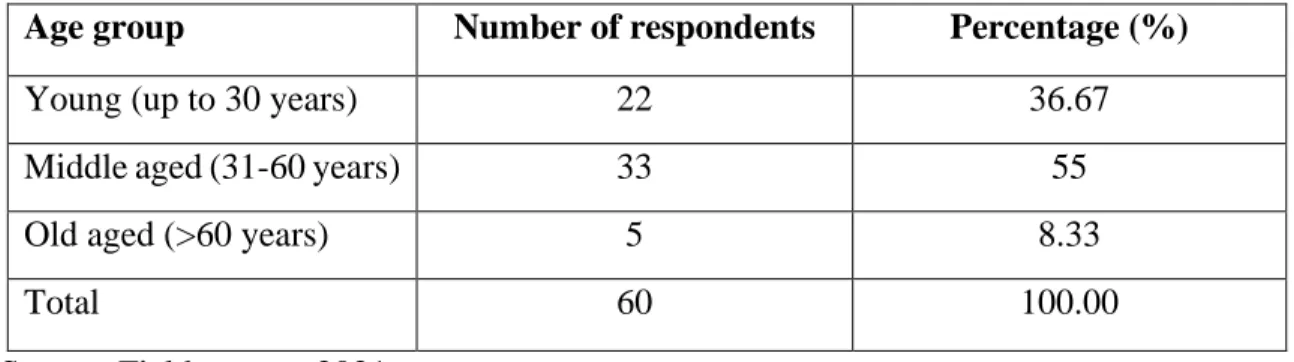
Table 4.1 reveals that the respondents aged between 31 to 60 years accounted for 55% of the total respondents while 36.67% wereyoung. There were only 8.33% respondents who belonged to old aged. It can be concluded that middle aged group were the maximum portion of the respondents.
Table 4.1 Age distribution of the respondents
Age group Number of respondents Percentage (%)
Young (up to 30 years) 22 36.67
Middle aged (31-60 years) 33 55
Old aged (>60 years) 5 8.33
Total 60 100.00
Source: Field survey, 2021
23
4.2 Education level of the respondents
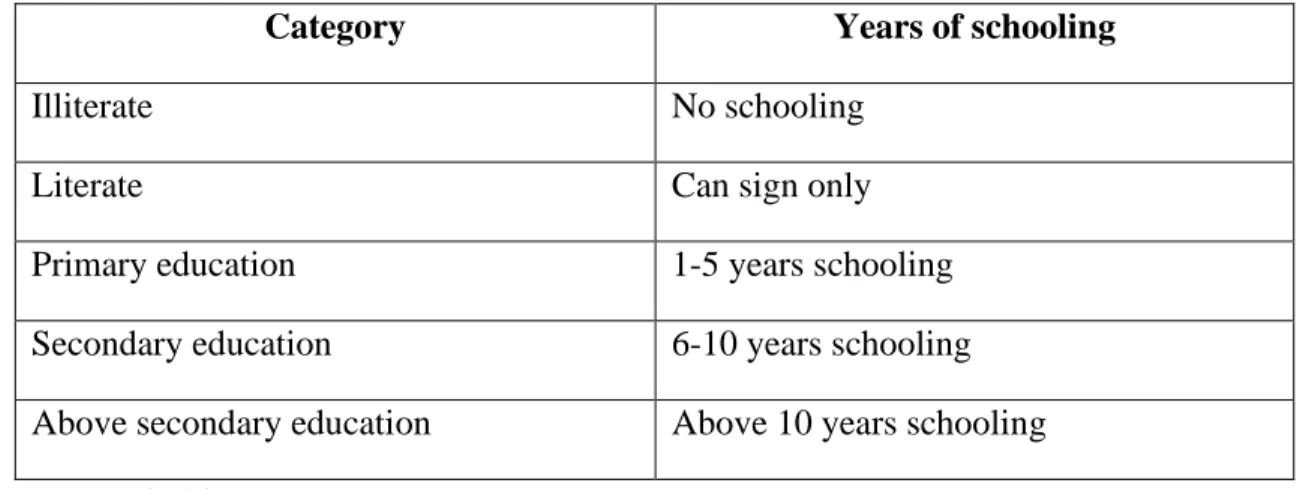
Education is one of the major socioeconomic factors that influence a person’s behavior and attitudes. The respondents were classified into five categories.
Table 4.2 Categories of educational level
Category Years of schooling
Illiterate No schooling
Literate Can sign only
Primary education 1-5 years schooling
Secondary education 6-10 years schooling
Above secondary education Above 10 years schooling Source: Sinthia, 2020
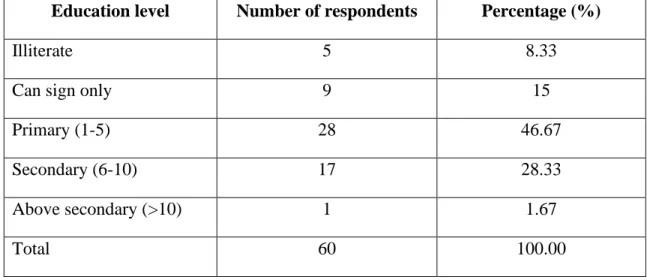
Table 4.3 Education level of the respondents
Education level Number of respondents Percentage (%)
Illiterate 5 8.33
Can sign only 9 15
Primary (1-5) 28 46.67
Secondary (6-10) 17 28.33
Above secondary (>10) 1 1.67
Total 60 100.00
Source: Field survey, 2021
According to that source,Majority of the urban poor approximately 26.9% were illiterate, 23.7% could sign their name, 31.3% and 11.9% population received primary and secondary level of education. Only 6.2% received above secondary education. Table 4.3 reveals that 8.33% respondents were illiterate, 15% respondents could sign only, 46.67% received primary education, 28.33% received secondary education and only 1.67% respondent
24
received above secondary education. So, the level of education was satisfactory though the respondents lived in the study area.
4.3 Family size of the respondents
Family size of the respondents were categorized into three groups: small family (consists of up to 3 members), medium family (consists of 4 to 6 members) and large family (consists of 7 and above members) (Source: Rokanuzzaman et al. 2013).
According to that source, 28.46% belonged to small family, 42.31% were medium family and 29.23% belonged to large family. So, majority of the respondents (42.31%) belonged to medium family.
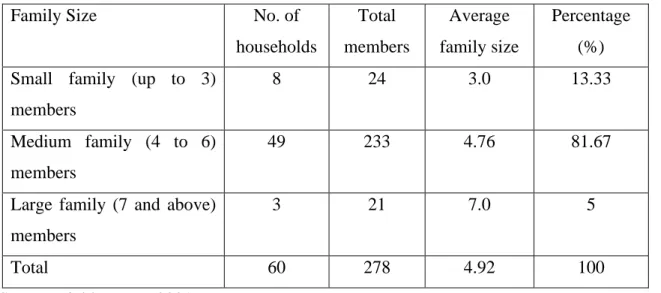
From Table 4.4, it was found that, the average of family size of the respondents was 4.92.
Average small, medium and large family size were 3.0 (13.33%), 4.76 (81.67%) and 7.0 (5%) respectively. So, medium size families (4 to 6) were dominant than the other families.
Table 4.4: Family size of the respondents
Family Size No. of
households
Total members
Average family size
Percentage (%) Small family (up to 3)
members
8 24 3.0 13.33
Medium family (4 to 6) members
49 233 4.76 81.67
Large family (7 and above) members
3 21 7.0 5
Total 60 278 4.92 100
Source: Field survey, 2021
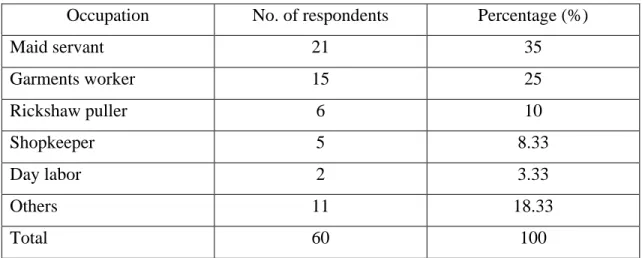
4.4 Occupational status of the respondents
Occupation is one of the most important attributes of socioeconomic characteristics. The distribution of occupation varies greatly depending on how much respondents involved and what level of income they earned from their present occupation. It was observed that
25
respondents involved in various kind of occupation such as housemaid, day labour, garment worker, rickshaw puller, shopkeeper etc. From Table 4.5, it was found that, 35%
respondents were involved in maid servant. About 25% of the respondents were engaged in garment industry, 10% in rickshaw pulling, 8.33% in shopkeeper, only 3.33% in day laborer and about 18.33% respondents were involved in other occupation.
Table 4.5: Occupational status of the respondents
Occupation No. of respondents Percentage (%)
Maid servant 21 35
Garments worker 15 25
Rickshaw puller 6 10
Shopkeeper 5 8.33
Day labor 2 3.33
Others 11 18.33
Total 60 100
Source: Field survey, 2021
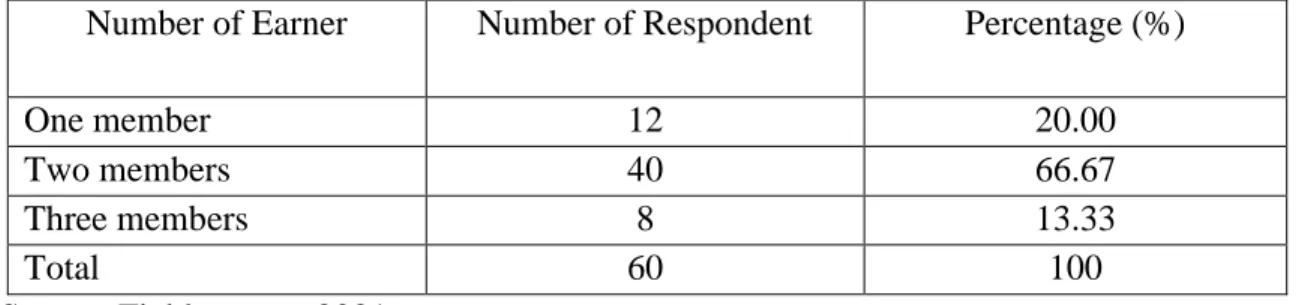
4.5 Distribution of the earning persons to the respondents’ households
Table 4.6 reveals that the families of two earning members had constituted 66.67% of the respondent in the study area. Respondents of one earner had constituted 20% and 13.33%
families had three earning members.
Table 4.6 Distribution of the earning persons to the respondent households Number of Earner Number of Respondent Percentage (%)
One member 12 20.00
Two members 40 66.67
Three members 8 13.33
Total 60 100
Source: Field survey, 2021
26
4.6 Distribution of the respondents based on their income and expenditure
The source of household’s income was garment workers, housemaid, shopkeeper, van dealer etc., selling labor such as day labor, rickshaw puller, brick-layer etc., helps from husband/ wife, helps from children, helps from parents etc. Table 4.7 shows that the average income and expenditure of the respondents were BDT 177333.67 and BDT 179244.04 respectively and for small family group the average annual income was BDT 131250 and expenditure was BDT 136938.5. At the same time, the average annual income and expenditure were BDT 160751.02 and BDT 160458.94 for medium family and BDT 240000 and BDT 240334.67 for large family, respectively. It was observed that the average annual expenditure was higher than the average annual income. For this reason, they borrowed money from their neighbors, relatives or friends to manage their income and to fulfill their requirements.
Table 4.7: Annual income and expenditure of the respondents
Family Size No. of
households
Percentage (%)
Average Annual Income (BDT)
Average Annual Expenditure
(BDT)
Small family (up to 3) 8 13.33 131250 136938.5
Medium family (4 to 6) 49 81.67 160751.02 160458.94 Large family (7 and
above)
3 5.00 240000 240334.67
Total 60 100 177333.67 179244.04
Source: Field survey, 2021
27
CHAPTER 5
LIVELIHOOD ASSETS OF THE SAMPLE HOUSEHOLDS
Livelihood means the way someone earns the money, people need to pay for food, a place to live, clothing, etc. Livelihood is known as the comparison between the capabilities, assets activities and activities for a means of living. A sustainable livelihood is referred as the maintaining of its capabilities and assets both now and in future. People need assets and productive activities for their well-being.
"Livelihood" does not just mean the activities that people carry out to earn a living. It means all the different elements that contribute to or affect their ability to ensure a living for themselves and their household. This includes (Hasan, 2014):
➢ the assets that the household owns or is able to gain access to human, natural, social, financial and physical capital.
➢ the activities that allow the household to use those assets to satisfy basic needs.
➢ the different factors that the household itself may not be able to control directly, like the seasons, natural disasters or economic trends, that affect its vulnerability and
➢ policies, institutions and processes that may help them or make it more difficult for them, to achieve an adequate livelihood.
5.1 Livelihood Assets
The five types of assets that form the core of livelihood resources in the DFID sustainable livelihood framework range. The model breaks access into the five assets:
1) Human asset 2) Social asset 3) Natural asset 4) Physical asset and 5) Financial asset.
28
5.1.1 Human assets
In Table 5.1, the respondents expressed their condition or satisfaction level by ranking 1 to 5 used bySaha, 2020. Rank 1 means low condition, rank 2-3 means moderate condition and rank 4-5 means good condition. The health status and nutrition condition were low 41.67% and 45% of the respondents, education, and life expectancy were moderate condition of 56.67%, 71.67% and skill and knowledge, capacity to work and capacity to adaptability were good condition of 45%, 76.67% and 63.33% respectively.
Table 5.1: Distribution of household according to human assets (Rank 1-5; 1= Low, 2-3=Moderate and 4-5= Good)
Items Low Moderate Good
No. of respondent s
Percentag e (%)
No. of respondent s
Percentag e (%)
No. of respondent s
Percent age (%)
Education 12 20 34 56.67 14 23.33
Health status
25 41.67 22 36.67 13 21.67
Nutrition 27 45 22 36.67 11 18.33
Skill and knowledge
12 20 21 35 27 45
Capacity to work
5 8.33 9 15 46 76.67
Capacity to
adaptabilit y
6 10 16 26.67 38 63.33
Life
expectancy
13 21.67 43 71.67 4 6.67
Source: Field Survey, 2021
29
5.1.2 Social assets
Social asset is an attribute that has value only because of the social institutions governing society. Social asset involves with network and communication (kinship and patronage), formal and informal social relationship, common rules and sanction, women empowerment, leadership etc. Social assets help people to work together and help each other to improve their community.
In Table 5.2, the respondents expressed their condition or satisfaction level by ranking 1 to 5 used by (Saha, 2020). Rank 1 means low condition, rank 2-3 means moderate condition and rank 4-5 means good condition. About 16.67%, 75% and 8.33% of the respondents had formal and informal social relationship that were low, moderate and good, 36.67%, 48.33% and 15% of the respondents said network and communication was low, moderate and good, respectively.
Table 5.2: Distribution of respondents according to social assets
(Rank 1-5; 1= Low, 2-3=Moderate and 4-5= Good). (Source: Saha, 2020).
Items Low Moderate Good
No. of respondent s
Percentag e
(%)
No. of respondent s
Percentag e
(%)
No. of respond ents
Percent age (%)
Formal and informal social relationship
10 16.67 45 75 5 8.33
Network and communicati on
9 15 29 48.33 22 36.67
Source: Field survey, 2021
30
5.1.3 Natural assets
The respondents had no access to urban land in slum area. They generally live on vacant private or government land. There is no sufficient and affordable housing for them. They live in rented houses and the accumulated monthly house rent was BDT 3000 per room in Korail slum and BDT 2500 per room in Noyapara slum.
5.1.4 Physical assets
Physical assets also known as tangible assets, are items of value that have a real material presence. Physical asset refers to the physical infrastructure, household goods, tools, equipment etc.Household furniture’s or modern amenities are the part of physical asset.
Household furniture includes wooden stool, bed, chair, table, almirah, showcase, rack, wardrobe, television, van, fridge, sewing machine, clock, mobile phone etc.
Table 5.3: Distribution of respondents according to household furniture
Items No. of respondents Percentage (%) Average value (BDT )
Wooden stool 32 53.33 2375
Chair 47 78.33 585.11
Table 21 35 714.29
Almirah 9 15 5111.11
Rack 21 35 957.14
Television 48 80 9906.25
Wardrobe 9 15 3388.89
Showcase 24 40 2979.17
Water filter 4 6.67 1500
Van 2 3.33 40000
Bed 31 51.67 5854.84
Fridge 36 60 21888.89
Mirchip 33 55 1154.55
31 Source: Field survey, 2021
Table 5.3 shows that 53.33% of the respondents had Wooden stool, 78.33% had chair, 35%
had table,15% had Almirah,35% had rack,80% had television,15% had wardrobe, 40%
had showcase,6.67% had water filter, 3.33% had van, 51.67% had bed, 60% had fridge, 55% had Mirchip,100% had fan, 16.67% had clock, 100% had mobile phone, 15% had sewing machine and 1.67% had CNG auto rickshaw. Their average value were about BDT 2375, BDT 585.11, BDT 714.29, BDT 5111.11, BDT 957.14, BDT 9906.25, BDT 3388.89, BDT 2979.17, BDT 1500, BDT 40000, BDT 5854.84, BDT 21888.89, BDT 1154.55,BDT 1678.33, BDT 245, BDT 2795, BDT 6333.33 and BDT 130000, respectively.
5.1.5 Financial assets
Table 5.4 shows that, among 60 respondents’ 56 respondents had cash in hand, from 60 respondents’ 11 respondents took loan. About 93.33% of the respondents had cash in hand and about 18.33% of the respondents took loans and their average value was BDT 383.93 and BDT 74090.91, respectively.
Table 5.4: Distribution of respondents according to financial assets
Items No. of respondents Percentage (%) Average Value (BDT)
Cash in hand 49 81.67 383.93
Loan 11 18.33 74090.91
Source: Field survey, 2021
Fan 60 100 1678.33
Clock 10 16.67 245
Mobile phone 60 100 2795
Sewing machine 9 15 6333.33
CNG auto
rickshaw
1 1.67 130000
32
CHAPTER 6
FOOD CONSUMPTION STATUS OF THE HOUSEHOLDS 6.1 Status of food consumption by household
Per person per day food intake has been shown in Table 6.1. Per person per day rice, potato, wheat, pulses, oil, meat, milk, fish, vegetables consumption level are 2574.34 kcal (42.49%), 425.77 kcal (7.03%), 484.19 kcal (7.99%), 102.77 kcal (1.70%), 281.48 kcal (4.65%), 238.19 kcal (3.93%), 175.00 kcal (2.89%), 225.62 kcal (3.72%), 1551.95 kcal (25.61%) respectively.
Table 6.1: Food consumption per household per day Major food items Per person per day food intake
(kcal/Person/day)
Percentage (%)
Rice 2574.34 42.49
Potato 425.77 7.03
Wheat 484.19 7.99
Pulses 102.77 1.70
Oil 281.48 4.65
Meat 238.19 3.93
Milk 175.00 2.89
Fish 225.62 3.72
Vegetables 1551.95 25.61
Total 6069.31 100
Source: Field survey, 2021
33
Table 6.2: Difference between per person per day food intake and national average per person per day food intake
Major food items
Per person per day food intake (kcal/person/day)
National Average per person per day
food intake (kcal/person/day)
(HIES, 2016)
Difference between national average (kcal/person/day)
Rice 2574.34 2833.30 -258.96
Potato 425.77 500.00 -74.23
Wheat 484.19 153.01 331.18
Pulses 102.77 120.37 -17.6
Oil 281.48 394.37 -112.89
Meat 238.19 152.78 85.41
Milk 175.00 208.56 -33.56
Fish 225.62 482.87 -57.25
Vegetables 1551.95 1288.60 263.35
Total 6059.31 6133.86 -74.55
Source: Field survey, 2021
Per person per day food intake has been shown in Table 6.2. Per person per day rice consumption level was 2574.34 kcal, potato consumption level was 425.77 kcal, pulses consumption level was 102.77 kcal, oil consumption level was 281.48 kcal, milk consumption level is 175.00 kcal, fish consumption level was 225.62 kcal at household level which were 258.96 kcal, 74.23 kcal, 17.6 kcal, 112.89 kcal, 33.56 kcal, 57.25 kcal respectively lower than the national average of those food items.
34
Table 6.3 Estimation of the household food security index of the respondents
Item No. of household Percentage of household
Food secured 24 40
Food insecured 36 60
Total 60 100
Source: Field survey, 2021
A household is food-secured if it can meet, either from its production or through purchases, adequate food for meeting the dietary needs of all its members (Maziya-Dixon et al., 2004).
Table 6.3 showed that the estimation of the household food security index of the respondents. The study showed that about 60% household remains food insecured in the study area whereas 40% ensured food security.
35
CHAPTER 7
PROBLEMS AND CONSTRAINTS FACED BY THE RESPONDENTS
In study area most of the respondents faced many problems such as health problems, lack of proper sanitation, water crisis than necessary, unhealthy food, lack of housing space, electricity, lack of proper education system, inadequate income etc. In this chapter, the major problems have been presented in Table 7.1.
Table 7.1 Problems and constraints faced by the respondents
Source: Field Survey, 2021
From the Table 7.1, it has been found that there are eight kinds of major problems, which were opined by the respondents in the study area during the time of data collection. Here,
Problems and Constraint
Number of times problem was ranked
Rank according to
severity First Second Third Fourth Total Percen
tage (%)
Health problem 3 4 1 11 19 31.67 6
Lack of proper sanitation
9 15 13 6 43 71.67 3
Water crisis 8 12 15 8 43 71.67 4
Inadequate income 8 10 14 13 45 75 1
Unhealthy food 6 6 2 7 21 35 5
Lack of housing space
24 10 8 2 44 73.33 2
Lack of proper waste
management system
- 3 7 6 16 26.67 7
Lack of proper education system
2 - - 7 9 15 8
36
the respondents expressed their problems in four degrees like first, second, third and fourth as problem used by Rokanuzzaman et al. 2013. The answers given by the respondents against problems were carefully handled and presented in percentage to be meaningful.
About 75% of the respondents faced inadequate income problem, which was higher than the other problems. The second major problem was housing problem which was 73.33%.
The third and fourth problems were sanitation and water problem both were about 71.67%.
About 35%, 31.67%, 26.67% and 15% of the respondents faced food problem, health problem, lack of proper waste management system and education problem respectively.
From the table it has been found that inadequate income is the most severe problem and lack of proper waste management system is the less severe problem in the study area.
Health problem: Most of the slum dwellers drink the unsafe and germ-infested water without boiling or filtering and they mostly suffered by water borne diseases. In Korail slum, the most occurring diseases are diarrhea, dysentery and cholera.
Sanitation: In slum area, sanitation system was inadequate and unhygienic environmental conditions was found. They shared latrines and one latrine was used by many households.
Households had sanitary latrine flash to elsewhere. Also, pit latrine without slab and hanging/open latrine were found in Korail.
Water: Some respondents claimed that they used pipe water but did not came all time. It came in a certain period of time in a day. Most of the people of the slums used DWASA water for their drinking purposes. Also, few tube well we