ii
©2017
Megan Marie Eubanks
ALL RIGHTS RESERVED
iii
DEDICATION
This thesis is dedicated to my loving and supportive future husband Zachary Wade Toomey- whose belief in me never waivers and whose faith in me has allowed me to excel these last four years. I truly cannot thank you enough.
This thesis is dedicated to my parents: Mr. and Mrs. William and Millie Eubanks, Miss Audrey Kirkland, and in memory of Mr. Davis Kirkland- without your constant support, love, and encouragement, I would not be the person I am today. Thank you for always believing in me.
This thesis is dedicated to my four siblings: William and Millie Eubanks, and Maci and Molly Kirkland- thank you for always knowing exactly what to say, for constantly keeping me laughing, and for keeping a smile on my face. Thank you for being my best friends.
This thesis is dedicated to my grandparents: Mr. and Mrs. George and Margaret Eubanks, and in memory of Miss Hazel Pack- you have helped make me a better person because of your steadfast guidance, advice, and love.
iv
ACKNOWLEDGEMENTS
I would like to thank Dr. Kathy Knight for not only guiding me through this thesis, but also guiding me through the last three years of university. Her patience, time, and support have altered my life in more ways than she may realize- because of her I found my future profession.
I would like to thank Dr. Scott Knight for his guidance through the statistics portion of this research project.
I would like to thank Dr. David Holben and Dr. Teresa Carithers- my second and third readers, respectively- for their guidance, feedback, and suggestions.
I would like to thank the faculty, staff, and students who helped make this study possible by participating in my research.
I would like to thank the Department of Nutrition and Hospitality Management for my evidence-based education, providing me a strong platform to stand on as I enter my future career, and providing me with supportive, caring faculty and fellow peers.
I am forever grateful for the opportunities that the Sally McDonnell Barksdale Honors College has provided me with. Thank you SMBHC for challenging me to be the best scholar and citizen I can be.
Finally, I would like to thank my friends and family for encouraging me throughout not only my research but also my university career.
v ABSTRACT
The purpose of this research was to determine the prevalence of food insecurity within the University of Mississippi community. The project also investigated whether the University of Mississippi (UM) community supports and/ or knows about the UM Food Bank.
A survey to determine perceived levels of food insecurity and knowledge of and opinions about the UM Food Bank was dispersed through Qualtrics Survey Software via University email to one-third of the UM faculty, staff, graduate students (including Pharmacy and Law), and undergraduate students. The final survey response count was 356 (response rate: 6.48%).
Data collected for questions pertaining to food insecurity were analyzed using the guidelines found under “Coding Responses for Assessing Households’ Food Security Status”, derived from the “U.S. Household Food Security Survey Module: Six-Item Short Form Economic Research Service, USDA”. Summary statistics were calculated using Excel spreadsheets and pivot tables to determine knowledge of and opinions about the UM Food Bank and demographic characteristics of survey respondents in addition to various percentages and figures. Chi Square analysis was conducted to test for differences in relative frequencies of categories between independent groups of classification and gender (Conover, 1999 and Seigel, 1956).
Results indicated that 30% of respondents were coded as having low food security and 11.5% of respondents were coded as having very low food security. Also, 40.8% of the UM community does not know that the UM Food Bank exists, 84.2% do not believe that they would qualify for its services, while only 2.5% support it. Chi Square tests
vi
indicated significant differences between the different classifications of respondents for the question concerning awareness of the food bank (=0.05). All classifications except graduate students predominately answered that they were aware of the food bank
(=0.05). Graduate students were about equally divided in their awareness of the food bank (=0.05). All classifications answered the “Do you think you would qualify?” and
“Have you received items from the food bank?” questions statistically the same (=0.05).
All classifications answered that they did not believe that they would qualify for assistance from the food bank and had not received items from the food bank (=0.05).
vii
TABLE OF CONTENTS
DEDICATION………,,,,………iii
ACKNOWLEDGMENTS………..iv
ABSTRACT……….…v
LIST OF TABLES………..………..……...viii
INTRODUCTION………...1
LITERATURE REVIEW………....…3
METHODS………..…..13
RESULTS………..…...….17
DISCUSSION………....32
CONCLUSIONS……….…………..37
APPENDICES………...38
SOURCES……….43
viii
LIST OF TABLES Table 1: Food Security Measurement Guide (Six Item)
Table 2: Demographic Characteristics of Survey Respondents Table 3: Student Data Based on Survey Responses
Table 4: Coded Responses to USDA Household Security Survey Module: Six-Item Short Form
Table 5a: Coded Responses for Food Security Based on Program Type: Numerical Value Table 5b: Coded Responses for Food Security Based on Program Type: Percentage Value Table 6: Level of Financial Aid Received Versus Coded Survey Responses for Food Insecurity
Table 7a: Knowledge of and Opinions about the University of Mississippi Food Bank:
Classification and Gender
Table 7b: Knowledge of and Opinions about the University of Mississippi Food Bank:
Ethnicity
1 INTRODUCTION
Although the terms “hunger” and “food insecurity” are often used
interchangeably, they have different meanings. Hunger is the physiological absence of food with the associated physical symptoms (Merriam-Webster, 2017). Food insecurity is the limited or uncertain availability of nutritionally adequate and safe foods or limited or uncertain ability to acquire acceptable foods in socially acceptable ways (USDA Food Security in the U.S.: Measurement, 2016). The state of food security that currently exists in post-secondary educational environments, along with the resulting effects is a national and global concern. Research suggests that food insecurity is a significant public health dilemma and remains a contributor to many nutritional, health and developmental problems (Micevski, Thornoton, & Brockington, 2014). Food insecurity among university students, likely has both short and long term consequences, as correlations have been drawn between chronic disease, academic achievement and food insecurity (Gallegos, Ramsey, & Ong, 2014).
Although food insecurity is a daunting problem on several college campuses (Patton-Lopez, Lopez-Cevallos, Cancel-Tirado, & Vazquez, 2013), it has not been studied in the University of Mississippi (UM) community. As the flagship university of the state with the highest rate of food insecurity (Key Statistics and Graphics , 2016), the campus may reflect the state’s level of food insecurity so it is important to monitor this demographic. The UM enrollment has grown 38% over the last decade and by 14% in the past five years (About UM: Facts & Statistics , 2016). As the enrollment rates
2 continue to rise, food insecurity will become more prevalent. The need for immediate food is currently being met through the UM Food Bank which serves students, faculty, and staff.
The purpose of this study was to evaluate the following two questions:
1. What is the prevalence of food insecurity within the University of Mississippi community?
2. Does the University of Mississippi community support and/or know about the University of Mississippi Food Bank?
These topics were measured via an anonymous survey through the UM Office of Institutional Research and Effective Planning.
3 LITERATURE REVIEW
Food Insecurity within Universities: a National and Global Concern
Much research has been conducted in an effort to quantify the amount of hunger and food insecurity among the population of post-secondary educational institutions in order to better understand its prevalence amongst this population. After surveying a convenience sample of fifty-eight food bank student-clients at the University of Alberta in Edmonton, Alberta, Canada, researchers proposed that food insecurity may have a high prevalence amidst college and university students because of limited earning potential while in school, high tuition rates, and lack of financial support from family
(Farahbakhsh, et al., 2015). A study conducted in Victoria, Australia at Deakin University (within three townships) proposed that the reason for food insecurity at the university level may come from students living independently for their first time. The cost of living and utility expenses may appropriate money that would be used to purchase nutritious food (Micevski, Thornoton, & Brockington, 2014). Another Australian study conducted at Queensland University of Technology, reported that the major food insecurity determinant is poverty and that specific population sub-groups are at risk:
those with lower income, single parent households, minorities, and the unemployed (Gallegos, Ramsey, & Ong, 2014).
Therefore, food insecurity among post-secondary students seems to originate from lack of monetary means and/or financial guidance, due to the cost of living, educational expenses, and deprivation of income while enrolled at a university. In the study “How do
4 Student Clients of a University-based Food Bank Cope with Food Insecurity?”- ninety percent of the food bank student clients were rated as food insecure, and this included both moderately and severely food insecure groups per the “Adult Food Security Survey Module” (Farahbakhsh, et al., 2015). In the study, “Food insecurity among university students in Victoria: A pilot study”, food insecurity without hunger was reported by eighteen percent of Deakin University students, and an additional thirty percent reported experiencing food insecurity with hunger per the “Adult Food Security Survey Module”
(Micevski, Thornoton, & Brockington, 2014). In the study “Food insecurity: is it an issue among tertiary students?” the prevalence of food insecurity at a household level was roughly one in four. Of these, nearly six percent (5.6) experienced very low food security per dichotomized categories and data correlation. These students also sought food relief from the university-sponsored food bank and other welfare agencies, although these were not the preferred option (Gallegos, Ramsey, & Ong, 2014). One can deduce that food insecurity among university students globally is not a trivial matter, and is a threat to both their minds and bodies.
Food insecure individuals are at risk for poor academic behavior and/or performance, as well as at risk of developing chronic diseases (Gallegos, Ramsey, &
Ong, 2014) such as overweight or obesity, which can be attributed to their dependence on cheap, non-nutritionally dense foods (Micevski, Thornoton, & Brockington, 2014).
Globally, food insecure individuals have also been reported to be thirty-five percent less likely to ingest more than two servings of fruit per day, as well as being fifty-five percent less likely to ingest four or more serving of vegetables per day (Gallegos, Ramsey, &
Ong, 2014). This indicates that, globally, a high percentage of food insecure students are
5 not consuming their daily amount of fruits and vegetables per the United States
Department of Agriculture recommendations for these food groups (MyPlate). This is indicative of a not only a shortage of food in quantity but also a shortage of food quality in the calorie dense foods that are most frequently available to post-secondary students.
In the “Position of the American Dietetic Association: Food Insecurity in the United States”, Holben stated that the negative outcomes of food insecurity were “physical impairments, psychological suffering, and sociofamilial disturbances” and suggested that
“systematic and sustained action is needed to achieve food and nutrition security for all in the United States” and that “interventions are needed, including adequate funding for and increased utilization of food and nutrition assistance programs, inclusion of food and nutrition education in such programs, and innovative programs to promote and support individual and household economic self-sufficiency” (Holben D. , 2010).
The prevalence of food insecurity found within universities in the United States of America (U.S.) is a cause for concern. While national data reveals that nearly thirteen percent of households (15.8 million) in the U.S. were determined to be food insecure, at some time during the year of 2015 (Coleman-Jensen, Gregory, & Rabbitt, 2016), research also indicates that among college students, incidences of food insecurity (Calvez, Miller, Thomas, Vazquez, & Walenta, 2016) are more times than not, double the national rate (USDA Economic Research Service , 2016). As in global university studies, national university studies suggest that food insecurity within households evolve from monetary issues associated with the rising costs of higher education rising, housing, and medical care (Patton-Lopez, Lopez-Cevallos, Cancel-Tirado, & Vazquez, 2013). Food insecurity within universities has also been attributed to lack of a “foodscape”- defined as the
6 incorporation of any opportunity to obtain food, including physical, socio-cultural, economic, and policy influences at both micro- and macro-levels. Therefore, environmental factors serve as a link to food access on campuses and in some cases, result in food insecurity. For example, dining facilities that offer healthy, affordable food options could decrease the percentage of students suffering from food insecurity (Calvez, Miller, Thomas, Vazquez, & Walenta, 2016).
From food insecurity, springs the concern for health and academic performance amongst university students. In a study of food insecurity among University of Arkansas students, seventeen percent of students experienced body weakness or other health symptoms in a year’s period due to limited food intake, with eighty-one percent of those students having symptoms some months but not every month. Ten percent reported having symptoms every week, while nine percent reported having symptoms every month (Lisnic, 2016). Research suggests that food insecurity can make low-income students more susceptible to not completing higher education and in some cases may endanger their future academic success and therefore prospective earnings. One study found that students who report to experience food insecurity are less likely to report a grade point average of ≥ 3.1 (Patton-Lopez, Lopez-Cevallos, Cancel-Tirado, & Vazquez, 2013).
The study “The University as a Site of Food Insecurity: evaluating the foodscape of Texas A&M University’s main campus” reported that forty-eight percent of the two hundred and sixty-three students surveyed to determine food insecurity, were either low food-secure at twenty percent or very low food-secure at twenty-eight percent.
Compared to the national level of household food insecurity, Texas A&M University undergraduates are two and one half times more food-insecure. The researchers for this
7 study used the short form of the United States Department of Agriculture (USDA)
Household Survey Module where respondents are identified as “food-insecure” if they answer affirmatively to a minimum of three of the six questions (Calvez, Miller, Thomas, Vazquez, & Walenta, 2016). Also utilizing the US Household Food Security Survey Module: 6-Item Short Form to measure food insecurity status, the study “Prevalence and Correlates of Food Insecurity Among Student Attending a Midsize Rural University in Oregon”, found food insecurity to affect fifty-nine percent of their three hundred and fifty-four students who completed the survey- that is a seven percent response rate (Patton-Lopez, Lopez-Cevallos, Cancel-Tirado, & Vazquez, 2013). The study “Student Food Insecurity at University of Arkansas” determined thirty-eight percent of their students to be food insecure via the USDA’s 10 item US Adult Food Security Survey Module. The response rate was thirteen percent, with four hundred and eighteen respondents completing the survey (Lisnic, 2016).
Based on the most recent data for the United States, approximately 6.42% of the nation’s population, approximately 20,663,464 students, are enrolled in degree-granting and non-degree-granting postsecondary institutions within the United States of America (Education, Digest of Education Statistics, 2014). As of July 1, 2015, the United States Census Bureau estimates the national population to be 321,418,820 (Commerce, 2015).
Based on an average of forty-eight percent of students reporting food insecure,
approximately 9,918,426 students in the nation are at risk of food insecurity. This is an appalling number that must be addressed. One study speculates that because food
insecurity rates among undergraduate students have been proven higher than the national food insecurity rates, responsibility to address this issue falls upon the shoulders of
8 private dining service companies (Calvez, Miller, Thomas, Vazquez, & Walenta, 2016).
Regardless of who should assume the responsibility of offering solutions to university food insecurity within the United States, according to sheer numbers- a large portion of the country is affected by this and it ultimately puts the education system under duress due to food insecurity being linked to low academic performance (Patton-Lopez, Lopez- Cevallos, Cancel-Tirado, & Vazquez, 2013).
Food Insecurity: Mississippi
While no documented research on food insecurity within universities in Mississippi could be found, studies have been conducted to analyze the prevalence of food insecurity within the state of Mississippi. The average prevalence of household- level food insecurity from 2013-15 for Mississippi was 20.8%, with 7.9% being very low food secure (Coleman-Jensen, Gregory, & Rabbitt, 2016). Most research conducted on food insecurity within Mississippi focuses on the Delta region of the state. Due to the lack of research within the rest of Mississippi pertaining to food insecurity, the Delta studies compared their data with national data in order to determine the prevalence of household food insecurity, and in some cases identify high-risk subgroups. One 2004 study, “High Prevalence of Food Insecurity and Hunger in Households in the Rural Lower Mississippi Delta” found that twenty-one percent of the households analyzed were food insecure, when using a 2-stage stratified cluster sample representative of the
population in thirty-six counties in the lower delta. The study conducted a cross-sectional telephone survey of one-thousand six hundred and sixty-two households in eighteen counties, adapting the United States Food Security Survey Module (Stuff, et al., 2004).
9 As stated in the previous section of this literature review, the most common attribute for food insecure households, is lack of monetary means. According to Stuff et al. (2004), that variable holds true for food insecure Mississippi households as well and providing other variables- a household with multiple individuals to feed and households with particular race demographics. The research indicated that high rates of food insecurity were present in households with incomes lower than $15,000, African American households, and households with children. Furthermore, links between food insecurity and its effects on children and adults were discussed. The conclusions reached were similar to those made by researchers who conducted studies at universities globally and nationally. Children from food-insecure households are more likely to display
behavioral, emotional, and scholastic issues than their food secure counterparts. For food insecure adults, their risk of obesity increases, complications arise more frequently with the control of diabetes, and a significant decrease in food and nutrient intake is present (Stuff, et al., 2004).
Other studies have been conducted to determine if there is a difference in diet quality between food insecure and food secure adults within high-risk populations in the Lower Mississippi Delta. A 2007 study, “Poverty and Food Intake in Rural America:
Diet Quality Is Lower in Food Insecure Adults in the Mississippi Delta”, used a random digit dialing telephone survey to collect data on food intake and therefore food security status of one-thousand six hundred and seven adults in the Lower Mississippi Delta.
Employing the Healthy Eating Index and Dietary Reference Intakes for one day intake, food security status and diet quality were analyzed. As hypothesized, food secure individuals scored higher on both the Healthy Eating Index and the Dietary Reference
10 Intakes than their food insecure counterparts. Conclusively, food insecurity is associated with lower quality diets in this particular Lower Mississippi Delta population. It was suggested that nutrition interventions should be provided to at-risk impoverished individuals in order to improve dietary intake (Champagne, et al., 2007). With
improvements made to delivering nutrition knowledge counseling and interventions to at- risk populations, such as those living in food desserts or impoverished areas,
optimistically some issues supplementary to food insecurity could be absolved. This in turn would dilute the amount of individuals who could easily receive nutrition diagnoses such as food-and nutrition-related knowledge deficit, limited adherence to nutrition- related recommendations, undesirable food choices, and self-monitoring deficit. (Nelms, Sucher, & Lacey, 2016).
Based on research conducted from 2013 through 2015 by the United States Department of Agriculture, Mississippi is currently the state with the highest level of food insecurity present in the nation. With a food insecurity prevalence that is higher than the United States average, Mississippi is found to have a prevalence of food insecurity of nearly twenty-one percent. There is also a very low food security status found to affect approximately eight percent of Mississippi homes. This is a devastating number considering there are approximately 1,138,000 households in Mississippi (Key Statistics and Graphics , 2016).
Food Insecurity: Oxford, Mississippi
In an effort to combat Mississippi’s food insecurity prevalence, Oxford, Mississippi has a food bank: the Oxford Community Pantry. Known locally as “The
11 Pantry” this food bank is a non-profit organization that provides food for needy families in the Oxford-Lafayette community. Recent data states that The Pantry feeds more than 400 people every month, including the homebound elderly residents that The Pantry services (Barrett, 2016).
Another food bank combatting food insecurity in Oxford is the University of Mississippi Food Bank. Their mission is to “foster a healthy college community by providing nourishing food to students in an effort to alleviate hunger on the UM
Campus”. The UM Food Bank strives to serve the University of Mississippi population in particular- this includes students, faculty, and staff (The Ole Miss Food Bank, 2016).
The UM Food Bank officially opened its doors to the UM community November 8, 2012 as a response to the overwhelming concern of hunger faced by students during the 2010 and 2011 economic recession. As of fall 2015, the food bank serves approximately seven to ten people per week. The UM Food Bank does not have any statistics about the Food Bank’s success (Thomas, 2015).
Food Insecurity: The University of Mississippi
Despite the absence of research conducted on food insecurity within Mississippi universities, as discussed above food insecurity is prevalent within the state, and therefore it can be hypothesized that food insecurity is present within the University of Mississippi population. Based on current research, this study is the first study conducted to
determine food insecurity within a university in Mississippi. This study is also the first study conducted to determine demographics and other information necessary to measure knowledge of, attitudes about, and therefore success of the University of Mississippi Food Bank. The purpose of this study was to evaluate the following two questions:
12 1. What is the prevalence of food insecurity within the University of Mississippi
community?
2. Does the University of Mississippi community support and/or know about the University of Mississippi Food Bank?
13 METHODS
Participants
This study was approved by the Institutional Review Board of the University of Mississippi. Subjects of this study are students, faculty, and/or staff at the University of Mississippi, with a minimum age of eighteen years. Data was collected anonymously via a survey through the UM Office of Institutional Research and Effective Planning (UM IREP) and using the private research software Qualtrics. The survey was sent to one- third of the faculty, staff, and students per UM IREP policy (Campus Survey and Panel Policy, 2016). The sample group was generated by Qualtrics and they then received a notification email which contained the consent form (Found in Appendix A), informing them of the purpose of the research and it requested that they anonymously complete the survey.
Survey Development
The survey (Found in Appendix B) contained four different sections and was partly composed of questions regarding knowledge about the University of Mississippi Food Bank and general demographic questions (questions 1-8 and 15-19). The survey is also composed partly (questions 9-14) of a previously validated survey: “U.S. Household Food Security Survey Module: Six-Item Short Form Economic Research Service,
USDA” (U.S. Household Food Security Survey Module: Six-Item Short Form Economic Research Service, USDA, 2012).
14 For questions three through six, the subjects were asked questions pertaining to their knowledge and attitudes associated with the University of Mississippi Food Bank.
For questions two and seven through eight, the subjects were asked questions related to their food consumption (meal plan, budget, and food culture beliefs). For questions nine through fourteen, the subjects were asked questions derived from the previously validated survey “U.S. Household Food Security Survey Module: Six-Item Short Form Economic Research Service, USDA” from September 2012 in order to determine the prevalence of food insecurity within the University of Mississippi community. For questions one and fifteen through nineteen, the subjects were asked demographic questions.
Procedure
On August 31, 2016, the University of Mississippi’s Institutional Review Board approved the survey conducted to accumulate research data. All survey recipients’
emails and other identifiers remained anonymous. Confidentiality stayed intact due to the Office of Institutional Research Survey Panel Group launching all emails by randomly selecting 5,500 individuals of the University of Mississippi population:
students, faculty, and/or staff. The survey was dispersed via email through Qualtrics on September 30, 2016 at 12:38PM, and was relaunched on October 30, 2016 and November 30, 2016. The survey officially closed on December 30, 2016. The final survey count was 356, with a 6.48% response rate.
15 Data Analysis
Data collected for questions nine through fourteen were analyzed using the guidelines found under “Coding Responses for Assessing Households’ Food Security Status”, derived from the “U.S. Household Food Security Survey Module: Six-Item Short Form Economic Research Service, USDA” from September 2012. Responses of “often”
or “sometimes” on questions nine and ten, and “yes” on questions eleven, thirteen, and fourteen were coded as affirmative (yes). Responses of “almost every month” and “some months but not every month” on question twelve were coded as affirmative (yes). The sum of affirmative responses to the six questions in the module is the household’s raw score on the scale (U.S. Household Food Security Survey Module: Six-Item Short Form Economic Research Service, USDA, 2012). Food security status was assigned as follows:
Table 1. Food Security Measurement Guide (Six Item) ([Bickel, Nord, Price, Hamilton, & Cook, 2000]; [Holben, 2017])
Number of Positive Questions/
Responses
Scale Score USDA Food Security Category
(Label)
USDA Food Security Category (Dichotomous)
Fully Food Secure versus Not Fully Food
Secure
0 0.0 High Food Security
Food Secure
Fully Food Secure
1 2.86 Marginal Food
Security
Not Fully Food Secure
2 4.19
Low Food Security
Food Insecure
3 5.27
4 6.30
5 7.54 Very Low Food
Security
6 8.48
Once food security status was assigned per respondent, the summation of each category was reported as a percentage. Summary statistics were calculated using Excel
16 spreadsheets and pivot tables to determine knowledge of and opinions about the
University of Mississippi Food Bank and demographic characteristics of survey respondents in addition to various percentages and figures. Chi Square analysis was conducted to test for differences in relative frequencies of categories between
independent groups of classification and gender. Then individual Chi Squares were used to determine which category responded differently from an expected frequency of 0.5 (Conover, 1999 and Seigel, 1956).
17 RESULTS
Demographics
The sample size was 356 survey respondents (response rate: 6.48%) including undergraduate and graduate students, faculty, and staff. The demographic characteristics of these survey respondents are listed in Table 2. Overall, there was a higher percentage rate of female survey participants (70.5%) than males (29.5%). One respondent was 18 years of age.
As expected, the majority of survey participants were classified 19-24 and 25-30 years of age (62.5% and 12.1%, respectively). Other survey participants were classified into 4 age groups: 51-60 (7.9 %), 31-40 (7.3%), 41-50 (5.1%), and 61 and older (4.8%).
The majority of survey participants were Caucasian and African American (81.2 % and 12.1%, respectively). The remaining participants were represented by a small percentage in the following order: Asian (1.7%), non-US citizen (1.7%), Hispanic (1.1%),
multiracial (1.1%), Native American (0.8%), and Unknown (0.3%). Survey participants’
residential statuses were as follows: Mississippi residency at 62.9%, out-of-state United States residency at 35.4%, and finally international residency at 1.7%.
18 Table 2. Demographic Characteristics of Survey Respondents
Variable Total Respondents
(n = 356)
Characteristic n %
Age
≤ 18 1 0.3
19-24 223 62.5
25-30 43 12.1
31-40 26 7.3
41-50 18 5.1
51-60 28 7.9
≥ 61 17 4.8
Gender
Males 105 29.5
Females 251 70.5
Ethnicity
Asian 6 1.7
African American 43 12.1
Caucasian 289 81.2
Hispanic 4 1.1
Multiracial 4 1.1
Native American 3 0.8
Non-US Citizen 6 1.7
Unknown 1 0.3
Residence Status
Mississippi Resident 224 62.9
Out-of-State US Resident 126 35.4
International 6 1.7
19 Student Data
Pertinent student descriptive data is found in Table 3. Seniors and doctoral students were the two largest represented categories with 125 and 66 responses (37.5%
and 19.8%, respectively). As seen in Table 3, the next highest categories of university affiliation respondents were juniors with 39 (11.7%) responses, masters students with 36 (10.8%) responses, sophomores with 9 (2.7%) responses, and freshman with 2 (0.6%) responses. The majority of respondents declared that they were full-time with 264 responses and the remaining respondents declared that they were part-time with 39 responses (87.1% and 12.9%, respectively).
In response to the survey, question “What percentage of your school cost is
funded through financial aid means?”- 120 (49.2%) participants responded “75%-100%”.
Fifty-nine (24.2%) participants responded “less than 25%”, 28 (11.5%) participants responded “25%-49%”, 37 (15.2%) participants responded “50%-74%”, 90 (36.9%) participants responded “not applicable”. Participants were asked to declare “not applicable” if they received zero financial aid assistance and/or were a non-student faculty/ staff member.
The majority of respondents declared that they did not have a meal plan with 313 responses. The remaining respondents declared that they did have a meal plan with 40 respondents (88.7% and 11.3%, respectively).
20 Table 3. Student Data Based on Survey Responses
Characteristic n %
Current Classification
Graduate- Doctorate 66 19.8
Graduate- Masters 36 10.8
Undergraduate- Freshman 2 0.6
Undergraduate- Junior 39 11.7
Undergraduate- Senior 125 37.5
Undergraduate- Sophomore 9 2.7
Total Respondents (n= 277) Current Enrollment Status
Full-Time 264 87.1
Part-Time 39 12.9
Total Respondents (n= 303) Financial Aid
Less than 25% 59 24.2
25%- 49% 28 11.5
50%- 74% 37 15.2
75%- 100% 120 49.2
Not Applicable 90 36.9
Total Respondents (n= 334) Meal Plan
No 313 88.7
Yes 40 11.3
Total Respondents (n= 353)
21 Food Insecurity Prevalence
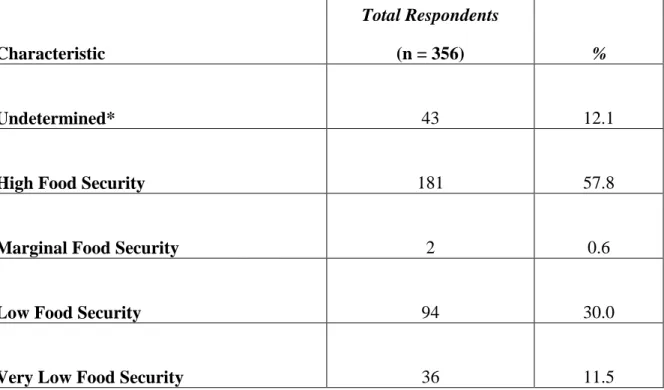
As seen in Table 4, and Figure 1, the majority of respondents were coded as having “high food security” with 181 (57.8%) responses. The next highest groups of respondents were coded as having “low food security” with 94 (30.0%) responses, “very low food security” with 36 (11.5%) responses, and “marginal food security” with 2 (0.6%) responses. It is important to note that nearly half of the survey respondents were coded as not having food security with 130 (41.5%) responses. Figure 1 serves as a visual representation of Table 3.
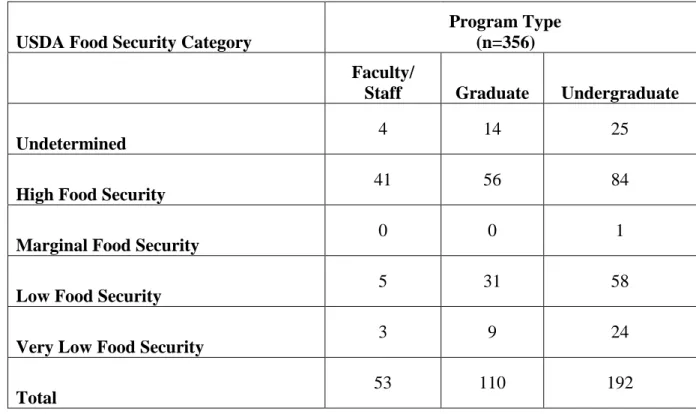
As seen in Table 5a, the majority of survey respondents were classified as
“undergraduate”, according to program type. There were 192 “undergraduate” classified respondents, with 25 of those responses being coded as “undetermined”. If a survey had incomplete responses, those respondents were coded as “undetermined”. The next highest program type classification to respond was “graduate”. There were 110
“graduate” classified respondents, with 14 of those responses being coded as
“undetermined.” The lowest number of respondents by program type classification was
“faculty/staff” with 53 respondents, and 4 of those responses being coded as
“undetermined.” In total, there were 356 responses, with 43 responses being coded as
“undetermined”.
As seen in Table 5b, the program type with the highest number of respondents coded as having “high food security” was the “faculty/staff” classification with 77.4%.
The groups with the next highest numbers of respondents coded as having “high food security” were the “graduate” and “undergraduate” classifications (50.9% and 43.8%, respectively). The program type with the highest numbers of respondents coded as
22 having “low food security” was the “undergraduate” classification with 30.2%. The groups with the next highest numbers of respondents coded as having “low food security”
were the “graduate” and “faculty/staff” classifications (28.2% and 9.4%, respectively).
The program type with the highest number of respondents coded as having “marginal food security” was the “undergraduate” classification with 0.5%. Zero responses were coded for “marginal food security” for both the “graduate” and “faculty/staff”
classifications. The program type with the highest number of respondents coded as having “very low food security” was the “undergraduate” classification with 12.5%. The groups with the next highest numbers of respondents coded as having “very low food security” were the “graduate” and “faculty/staff” classifications (8.2% and 5.7%,
respectively). For the “faculty/staff” classification, 7.5% of the responses were coded as
“undetermined”. For the “graduate” classification, 12.7% of the responses were coded as
“undetermined”. For the “undergraduate” classification, 13.0% of the responses were coded as “undetermined.”
The numbers per level of food insecurity per levels of financial aid status is found in Table 6. The individuals who responded “75%-100%” when asked “What percentage of your school cost is funded through financial aid means?” were coded as the most food insecure group when compared to the other groups. The individuals who responded
“50%-74%” when asked “What percentage of your school cost is funded through financial aid means?” were coded as the second most food insecure group when
compared to other groups. The individuals who responded “less than 25%” when asked
“What percentage of your school cost is funded through financial aid means?” were coded as the third most food insecure group when compared to the other groups. The
23 individuals who responded “25%-49%” when asked “What percentage of your school cost is funded through financial aid means?” were coded as the fourth most food insecure group when compared to the other groups. Figure 2 serves as a visual representation for Table 6. The participants coded as having “low food security” and “very low food security” were grouped together in the same category for this analysis (“food insecure”).
The participants coded as having “marginal food security” and “high food security” were grouped together in the same category for this analysis (“food secure”).
24 Table 4. Coded Responses to USDA Household Security Survey Module: Six-Item
Short Form
*Incomplete survey responses were coded as undetermined.
Figure 1. Coded Responses to USDA Household Security Survey Module: Six-Item Short Form: Percentages
58%
30%
1% 11%
High Food Security Low Food Security Marginal Food Security Very Low Food Security
Characteristic
Total Respondents
(n = 356) %
Undetermined* 43 12.1
High Food Security 181 57.8
Marginal Food Security 2 0.6
Low Food Security 94 30.0
Very Low Food Security 36 11.5
25 Table 5a. Coded Responses for Food Security Based on Program Type: Numerical
Value
USDA Food Security Category
Program Type (n=356)
Faculty/
Staff Graduate Undergraduate
Undetermined 4 14 25
High Food Security 41 56 84
Marginal Food Security 0 0 1
Low Food Security 5 31 58
Very Low Food Security 3 9 24
Total 53 110 192
Table 5b. Coded Responses for Food Security Based on Program Type: Percentage Value
USDA Food Security Category
Program Type (n= 100%)
Faculty/
Staff Graduate Undergraduate Undetermined
7.5 12.7 13.0
High Food Security
77.4 50.9 43.8
Marginal Food Security 0.0 0.0 0.5
Low Food Security
9.4 28.2 30.2
Very Low Food Security 5.7 8.2 12.5
26 Table 6. Level of Financial Aid Received Versus Coded Survey Responses for Food
Insecurity
Level of Financial
Aid Food Insecure Food Secure Grand Total
75%- 100% 51 62 120
50%- 74% 21 13 37
25%- 49% 18 8 28
Less than 25% 23 35 59
Figure 2. Bar Graph Visual: Level of Financial Aid Received Versus Coded Survey Responses for Food Insecurity
27 University of Mississippi Food Bank: Knowledge and Opinions
The survey included questions pertaining to the respondents’ knowledge of and opinions about the University of Mississippi Food Bank. Answers to the survey
questions were separated based on the corresponding survey participants’ classification and gender (Table 7a) and ethnic background (Table 7b). In Table 7a there were differences in the distribution of answers over the four classifications for the first three questions asked about the food bank.
The greatest number of respondents were in the “Junior/Senior” classification, with 164 of the 330 responses. Of those, 67 respondents responded “no” when asked
“Are you aware of the UM Food Bank?”, while the remaining 97 respondents responded
“yes”. One hundred thirty-two respondents responded “no” when asked “Do you think you would qualify?”, while the remaining 32 participants responded “yes”. In response to the survey questions, “Have you received items from the food bank?”, 160 participants responded “no”, while the remaining 4 participants responded “yes”. When asked
“Which is the best way to advertise [for the UM Food Bank]?” the “Junior/Senior” group responded: “Email” (n=74), “Facebook” (n=43), “Posters/Flyers” (n=30), “Instagram”
(n=14), and “Twitter” (n=3).
The most represented gender for the food bank questions was the “Female” group, with 251 of the 355 responses. Of those 251 participants, 94 participants responded “no”
when asked “Are you aware of the UM Food Bank?”, while the remaining 157
participants responded “yes”. In response to the survey 211 participants responded “no”
when asked “Do you think you would qualify?”, while the remaining 40 participants responded “yes”. In response to the survey 243 participants responded “no” when asked
28
“Have you received items from the food bank?”, while the remaining 8 participants responded “yes”. When asked “Which is the best way to advertise [for the UM Food Bank]?” the “Female” group responded: “Email” (n=116), “Facebook” (n=54),
“Posters/Flyers” (n=45), “Instagram” (n=26), and “Twitter” (n=10).
The most represented ethnicity for the food bank questions was the “White”
group, with 288 of the 355 responses. Of those 288 participants, 121 participants responded “no” when asked “Are you aware of the UM Food Bank?”, while the
remaining 167 participants responded “yes”. In response to the survey 254 participants responded “no” when asked “Do you think you would qualify?”, while the remaining 34 participants responded “yes”. In response to the survey 284 participants responded “no”
when asked “Have you received items from the food bank?”, while the remaining 3 participants responded “yes”. When asked “Which is the best way to advertise [for the UM Food Bank]?” the “White” group responded: “Email” (n=121), “Facebook” (n=62),
“Posters/Flyers” (n=65), “Instagram” (n=25), and “Twitter” (n=13).
In response to the survey, 200 participants responded “yes” when asked “Are you aware of the UM Food Bank?” In response to the survey, 53 participants responded
“yes” when asked, “Do you think you would qualify?” In response to the survey, 6 participants responded “yes” when asked “Have you received items from the food bank?”
In response to the survey, 141 participants responded “Email” when asked “Which is the best way to advertise?”
Chi Square tests (Table 7a) indicated there were significant differences between the different classifications of respondents for the question concerning awareness of the food bank (=0.05). All classifications except graduate students predominately answered
29 that they were aware of the food bank (=0.05). Graduate students were about equally divided in knowing or not knowing about the food bank (=0.05). All classifications answered the “Do you think you would qualify?” and “Have you received items from the food bank?” statistically the same (=0.05). All classifications answered that they did not believe that they would qualify for assistance from the food bank and had not received items from the food bank (=0.05).
30 Table 7a. Knowledge of and Opinions about the University of Mississippi Food
Bank: Classification and Gender
* Indicates frequency distribution Classification were different between yes and no responses.
† Indicates difference in the way frequencies of male and female responses.
Red indicates differences between yes and no answers within a classification.
Survey Questions
Survey Responses
Faculty/
Staff
Freshmen/
Sophomore Graduate
Junior/
Senior Female Male
*†Are you aware of the UM Food
Bank?
No 14 7 42 67 94 51
Yes 38 4 61 97 157 53
*Do you think you would qualify?
No 50 8 87 132 211 88
Yes 2 3 16 32 40 16
*Have you received items
from the food bank?
No 51 11 101 160 243 102
Yes 0 0 2 4 8 1
Which is the best way to advertise?
Email 23 5 39 74 116 37
Facebook 6 2 23 43 54 25
Instagram 4 1 11 14 26 4
Posters/Flyers 16 2 22 30 45 32
Twitter 3 1 6 3 10 4
31 Table 7b. Knowledge of and Opinions about the University of Mississippi Food
Bank: Ethnicity
Survey Questions
Survey
Responses Asian
African
American Hispanic
Multi- racial
Native American
Non-US
Citizen Unknown White
Are you aware of the UM Food Bank?
No 3 15 2 1 1 1 1 121
Yes 3 28 2 3 2 5 0 167
Do you think you would
qualify?
No 3 29 3 3 2 5 0 254
Yes 3 14 1 1 1 1 1 34
Have you received items
from the food bank?
No 4 40 4 4 2 6 1 284
Yes 2 3 0 0 1 0 0 3
Which is the best way to
advertise?
Email 1 21 3 2 1 3 1 121
Facebook 3 9 1 2 0 2 0 62
Instagram 1 3 0 0 0 1 0 25
Posters/
Flyers 1 9 0 0 2 0 0 65
Twitter 0 1 0 0 0 0 0 13
32 DISCUSSION
Demographics
There were more female than male respondents. This is consistent with the current gender distribution found within the current University of Mississippi population.
The recorded ethnicities of survey participants also followed current University of
Mississippi population demographics, which are, in descending order: Caucasian, African American, non-US citizen, Asian, Hispanic, multiracial, unknown. The higher
percentage of in-state student responses (62.9%) also correlates with the higher reported (55.8%) percentage of students classified as in-state by the University of Mississippi (The University of Mississippi: Institutional Research, 2016).
Student Data
The largest represented categories were seniors and doctoral students. According to the fall 2016-2017 University of Mississippi undergraduate headcount statistics there were 5,068 seniors, which is the most represented category at the university. This is consistent with the data found in Table 3, with seniors being the largest represented category with 37.5% of responses. However, the subsequent represented categories of doctoral, juniors, masters, sophomores and freshman do not correspond with the fall 2016-2017 University of Mississippi undergraduate headcount statistics. The higher percentage of full-time student responses (87.1%) correlates with the higher reported
33 percentage (91.8%) of students classified as full-time by the University of Mississippi (The University of Mississippi: Institutional Research, 2016). It is important to note that nearly half of the survey (49.2%) participants have 75%-100% of their school costs funded through financial aid means. Nearly 37% of participants (36.9%) have 50%-74%
of their school costs funded through financial aid means. Therefore, 86.1% of
participants have half or more than half of their school costs funded through financial aid.
This is consistent with the 2013-2014 national average of 85% (Education, The Condition of Financial Aid 2016, 2016).
Food Insecurity Prevalence
After coding responses, 26.4% of faculty/staff, graduate and undergraduate participants were coded as having very low food security. Additionally, 67.8% of faculty/ staff, graduate, and undergraduate participants were coded as having low food security. Of all participating individuals, the group classified as most food secure were the “faculty/staff”. Faculty/staff respondents had 77.4% high food security, 9.4% low food security, and 5.7% very low food security. The graduate students were the next high food secure group with 50.9% having high food security, 28.2% having low food
security, and 8.2% having very low food security. Although a greater percentage of graduate students are financially independent, many of them receive a graduate stipend, which includes tuition remission. This may lead to them having more disposable income to spend on food, when compared to undergraduates. The University of Mississippi graduate students are more food secure than those at the University of Arkansas who had 47% of their graduate students code as food insecure. However, the University of
34 Mississippi undergraduates are more food insecure than those at the University of
Arkansas who had 37% of their undergraduate students code as food insecure (Lisnic, 2016). Our graduate students are more food insecure than the University of Hawaii at Mānoa who had 18% of their graduate students code as food insecure (Chaparro, Zaghloul, Holck, & Dobbs, 2009).
The survey responses for “What percentage of your school costs are funded through financial aid means?” were analyzed against the coded survey responses for food insecurity. The individuals who responded “75%-100%” and “50%-74%” when asked
“What percentage of your school cost is funded through financial aid means?” were the first and second most food insecure group, respectively. Gallegos et at. (2014) suggested that “students from food insecure households were three times as likely to have deferred their studies due to financial difficulties.” While the student respondents in this study were still in school, the results from both studies indicate that individuals who are in need of financial assistance are generally the individuals who are most susceptible to food scarcity and therefore, food insecurity.
University of Mississippi Food Bank: Knowledge and Opinions
Of the 355 responses to “Are you aware of the UM Food Bank?” 210 (59.2%) of the participants responded “Yes” and 145 (40.8%) of the participants responded “No”.
Additionally, when asked “Do you think you would qualify?” 56 (15.8%) of the
participants responded “Yes” and 299 (84.2%) of the participants responded “No.” These results are startling because one of the University of Mississippi Food Bank policies is that all members of the UM community- faculty, staff, and students- automatically
35 qualify for free use of the UM Food Bank (The Ole Miss Food Bank, 2016). Of 354 responses to “Have you received items from the food bank?” only 9 (2.5%) of the participants responded “Yes” and 345 (97.5%) of the participants responded “No”. It is important to note that 56 (15.8%) respondents believe that they qualify for the UM Food Bank, but only 9 (2.5%) respondents have actually utilized the UM Food Bank. Of 353 responses to, “Which is the best way to advertise?” participants chose the following outlets: email (n=153), Facebook (n=79), posters/flyers (n=77), Instagram (n=30), and twitter (n=14). It is important to note that 153 (43.3%) participants believe that email is the best way for the UM Food Bank to advertise. Every University of Mississippi affiliated individual- faculty, staff, and student- receives a UM affiliated email account, which could be an effective outlet for the UM Food Bank. In light of 299 (84.2%)
individuals believing that they do not qualify for the UM Food Bank and 130 respondents being coded as having either low food security (n=94, 30%) or very low food security (n=36, 11.5%), it is imperative that the UM Food Bank make themselves more known because they could be a vital tool in helping alleviate hunger within the University of Mississippi community.
Limitations
A limitation within this research project was the inability to differentiate between faculty and staff responses- both faculty and staff participants were automatically
categorized together when submitting their responses due to embedded data. Another limitation within this study was the inability to differentiate between specific ages- participants instead had to choose an age group which effects being able to identify a
36 particular age that suffers of food insecurity and/or knows that they qualify for the UM Food Bank. Additionally, the food bank on campus was the only food bank asked about, excluding the Oxford community food bank.
Further Research
For future research, surveys should include a greater sample size to provide a more accurate depiction of food insecurity prevalence within the University of Mississippi community, in order to most appropriately guide decision making about University food aid programs. It is also imperative for future research to be conducted on the relationship between financial aid status and food insecurity status in order to have a clearer breakdown of the distribution of aid versus level of food security within the University of Mississippi community. It would be essential to determine correlations between food security status and general food bank knowledge. For this study, the only food bank in question was the University of Mississippi Food Bank. However, some students may be cliental of the Oxford community food bank. Therefore, for future studies, the relationship between food banks in a general area and food security status should be investigated.
37 CONCLUSIONS
The purpose of this research was to determine the prevalence of food insecurity within the University of Mississippi community. This research project also sought to determine if the University of Mississippi community supports and/ or knows about the University of Mississippi Food Bank.
The results indicated that members of the University of Mississippi community do suffer from food insecurity. Thirty percent of respondents were coded as having low food security and 11.5% of respondents were coded as having very low food security.
These results can serve as a guide for the University of Mississippi in making effective decisions about food availability to help alleviate the hunger found within its community.
More research should be conducted to determine why food insecurity is so prevalent within the UM community.
The results also showed that 40.8% of the University of Mississippi community does not know that the University of Mississippi Food Bank exists, 84.2%% do not believe that they would qualify for its services, while only 2.5% support it. Due to the lack of awareness and therefore utilization of the UM Food Bank among University of Mississippi faculty, staff, and students, it would be advantageous for the UM Food Bank to implement creative ways to serve its community. These results can guide the
University of Mississippi Food Bank through their future efforts to raise awareness of their important services for the University of Mississippi community.
38 APPENDICES
39 APPENDIX A
Informed Consent Sheet
Title: “Knowledge and Attitudes about the University of Mississippi Food Bank and the Prevalence of Food Insecurity within the University of Mississippi Community”
Investigator Megan M. Eubanks Department of Nutrition Lenoir Hall
The University of Mississippi (662) 614-5882
Advisor
Kathy B. Knight Ph.D.
Department of Nutrition Lenoir Hall
The University of Mississippi (662) 915-5172
Description
This survey is being conducted as part of an honors thesis project. The purpose of this research is to determine the knowledge and attitudes held by University of Mississippi students, faculty, and/or staff, regarding the UM Food Bank. This research project will also seek to determine the prevalence of food insecurity within the University of Mississippi community. You will not be asked for your name or any other identifying information. Questions 9-14 are derived from the previously validated survey “U.S.
Household Food Security Survey Module: Six-Item Short Form Economic Research Service, USDA” (September 2012).
Associated Time
It will take you approximately ten minutes to complete this survey.
Risks and Benefits
There are no known risks associated with this study beyond those associated with a person’s everyday use of the Internet. No identifying information about you will be made public and any views you express will be kept completely anonymous.
Confidentiality
No identifiable information will be recorded, therefore we do not think you can be identified from this study.
Right to Withdraw
You do not have to take part in this study and you may stop participation at any time.
You may skip any questions you prefer not to answer.
IRB Approval
This study has been reviewed by The University of Mississippi’s Institutional Review Board (IRB). If you have any questions, concerns, or reports regarding your rights as a participant of research, please contact the IRB at (662) 915-7482 or [email protected].
Statement of Consent
I have read and understand the above information. By completing the survey I consent to participate in the study, and verify that I am 18 years of age or older.
40 APPENDIX B
Survey: “Knowledge and Attitudes about the University of Mississippi Food Bank and the Prevalence of Food Insecurity within the University of Mississippi
Community”
1. Please select your current age group:
o ≤ 18 o 19-24 o 25-30 o 31-40 o 41-50 o 51-60 o ≥ 61
2. Do you currently have a meal plan through the University of Mississippi?
o
Noo
Yes: 5-Day Plus 1o
Yes: Plus 1o
Yes: RC Unlimited Plus 1o
Yes: Rebel 100 Plus 1o
Yes: Rebel 50o
Yes: Rebel 50 Plus 1o
Yes: Rebel Unlimited Plus 1o
Yes: Spring Greek 50o
Yes: Spring Greek Plus 13. Are you aware that the University of Mississippi has a food bank?
o
Yeso
No4. Do you think that you would qualify to be served by the University of Mississippi Food Bank?
o
Yeso
No5. Have you ever received food, hygiene products, or other items from the University of Mississippi Food Bank?
o
Yeso
No6. Which of the following do you believe would be the most effective way to advertise the University of Mississippi Food Bank?
o
Emailo
Facebooko
Instagramo
Twittero
Posters/Flyers41 7. Please estimate your weekly food budget and/or the average amount of money
spent on food weekly: ________________________
8. Does your religion, culture, or personal beliefs prohibit your intake of any specific food or food group?
o No
o Yes. Please specify what food or food group is prohibited in the space below:
____________________________________________________________
9. “The food that (I/we) bought just didn’t last, and (I/we) didn’t have money to get more.” Was that often, sometimes, or never true for (you/your household) in the last 12 months?
o Often true o Sometimes true o Never true o Do not know
10. “(I/we) couldn’t afford to eat balanced meals.” Was that often, sometimes, or never true for (you/your household) in the last 12 months?
o Often true o Sometimes true o Never true o Do not know
11. In the last 12 months, since last (name of current month), did (you/you or other adults in your household) ever cut the size of your meals or skip meals because there wasn't enough money for food?
o Yes
o No (Skip 11)
o Do not know (Skip 11)
12. If yes above, how often did this happen—almost every month, some months but not every month, or in only 1 or 2 months?
o Almost every month
o Some months but not every month o Only 1 or 2 months
o Do not know
13. In the last 12 months, did you ever eat less than you felt you should because there wasn't enough money for food?
o Yes o No
o Do not know
42 14. In the last 12 months, were you ever hungry but didn't eat because there wasn't
enough money for food?
o Yes o No
o Do not know
15. Please select your current residency status:
o
MS Residento
Non-MS Resident, US Citizeno
International Studento
International Faculty/Staffo
Other- Please Specify: _____________________________16. Please select all that apply to you from the list below:
o
African Americano
Asian/ Pacific Islandero
Caucasiano
Hispanic/ Latinoo
Native Americano
Other- Please Specify: ____________________________17. What is your current classification?
o
Undergraduate- Freshmano
Undergraduate- Sophomoreo
Undergraduate- Junioro
Undergraduate- Senioro
Graduate- Masterso
Graduate- Doctorateo
Other- Please Specify: ____________________________o
Not Applicable (Non-student faculty/staff member) 18. Please select your current enrollment status:o
Full-time Studento
Part-time Studento
Other- Please Specify: _____________________________o
Not Applicable19. What percentage of your school cost is funded through financial aid means?
o
Less than 25%o
25%-49%o
50%-74%o
75%-100%o
Not Applicable (To be checked if you receive zero financial aid assistance and/or are a non-student faculty/staff member)43 SOURCES
(2012, September). U.S. Household Food Security Survey Module: Six-Item Short Form Economic Research Service, USDA. United States of America : United States Department of Agriculture.
About UM: Facts & Statistics . (2016). Retrieved from The University of Mississippi : http://olemiss.edu/aboutum/facts.html
Barrett, L. (2016, April 24). About The Pantry. Retrieved from EatingOxford.com:
https://eatingoxford.wordpress.com/tag/the-pantry-oxford/
Bickel, G., Nord, M., Price, C., Hamilton, W., & Cook, J. (2000, March). Measuring Food Security in the United States. Guide to Measuring Household Food Security. Alexandria, Virginia, United States of America: United States Department of Agriculture.
Calvez, K., Miller, C., Thomas, L., Vazquez, D., & Walenta, J. (2016). The University as a Site of Food Insecurity: Evaluating the Foodscape of Texas A&M University's Main Campus. The Southwesten Geographer, 1-14.
Campus Survey and Panel Policy. (2016). Retrieved from Office of Institutional Reseach, Effectiveness, and Planning: http://irep.olemiss.edu/effectiveness/assessment- method-resources/campus-survey-and-panel-policy/
Champagne, C. M., Casey, P. H., Connell, C. L., Stuff, J. E., Gossett, J. M., Harsha, D.
W., Bogle, M. L. (2007). Poverty and Food Intake in Rural America: Diet Quality
![Table 1. Food Security Measurement Guide (Six Item) ([Bickel, Nord, Price, Hamilton, & Cook, 2000]; [Holben, 2017])](https://thumb-ap.123doks.com/thumbv2/123dok/10462807.0/23.918.151.854.675.984/table-security-measurement-guide-bickel-price-hamilton-holben.webp)