“Annexure B”
BUFFALO CITY METROPOLITAN MUNICIPALITY
DRAFT 2013/2014 MEDIUM TERM REVENUE AND EXPENDITURE FRAMEWORK (MTREF) BUDGET
2 APRIL 2013
PART
1.1 1.2 1.3 1.4 1.5 1.6 1.7
PART
2.1 2.2 2.3 2.4 2.5 2.6 2.7 2.8 2.9 2.10 2.11 2.12 2.13 2.14
T 1: AN
EXECUT COUNCI EXECUT OPERAT OPERAT CAPITAL ANNUAL
T 2: SU
OVERVIE OVERVIE MEASUR OVERVIE OVERVIE OVERVIE EXPEND COUNCI MONTHL CONTRA CAPITAL LEGISLA OTHER S CITY MA
TA
NNUAL B
TIVE MAYO L RESOLU TIVE SUMM TING REVE TING EXPE L EXPEND L BUDGET
UPPORT
EW OF TH EW OF AL RABLE PE EW OF BU EW OF BU EW OF BU DITURE ON LLOR AND LY TARGE ACTS HAV L EXPEND ATION CO
SUPPORT ANAGER’S
ABLE O
BUDGE
OR’S REPO UTIONS MARY
ENUE FRA ENDITURE DITURE FR T TABLES
TING DO
HE ANNUA LIGNMENT ERFORMA UDGET-RE UDGET AS UDGET FU N GRANTS
D EMPLOY ETS FOR R VING FUTU DITURE DE MPLIANC TING DOCU S QUALITY
OF CO
T
ORT
AMEWORK E FRAMEW RAMEWOR
OCUMEN
AL BUDGE T OF ANNU
NCE OBJE ELATED PO SSUMPTIO UNDING
S AND REC YEE BENE REVENUE, URE BUDG ETAILS
E STATUS UMENTS Y CERTIFIC
ONTEN
K WORK
RK
NTATIO
ET PROCE UAL BUDG
ECTIVES A OLICIES ONS
CONCILIA EFITS
, EXPEND GETARY IM
S
CATE
NTS
ON
SS
GET WITH AND INDIC
ATIONS OF
ITURE AN MPLICATIO
IDP CTORS
F UNSPEN
ND CASH F ONS
NT FUNDS
FLOW
LIST OF TABLES
TABLE 1 Consolidated Overview of the 2013/14 MTREF
TABLE 2 Average Tariff Increase for 2012/13, 2013/14 & 2014/15 TABLE 3 List of Key Projects
TABLE 4 Percentage growth in revenue by main revenue source TABLE 5 Operating Transfers and Grant Receipts
TABLE 6 Comparison of proposed rates to levied for the 2013/14 financial year TABLE 7 Proposed Water Tariffs
TABLE 8 Comparison between current water charges and increases (Domestic) TABLE 9 Comparison between current electricity charges and increases (Domestic) TABLE 10 Comparison between current sanitation charges and increases, single
dwelling-residence
TABLE 11 Comparison between current waste removal fees and increases TABLE 12 Table SA14 – Household bills
TABLE 13 Summary of operating expenditure by standard classification item TABLE 14 Repairs and Maintenance
TABLE 15 Basic Social Services Package per Household TABLE 16 2013/2014 Medium-term capital budget per vote TABLE 17 List of Key Projects
TABLE 18 Table A1 – Budget Summary
TABLE 19 Table A2 - Budgeted Financial Performance (revenue and expenditure by standard classification)
TABLE 20 Table A3 - Budgeted Financial Performance (revenue and expenditure by municipal vote)
TABLE 21 Table A4 - Budgeted Financial Performance (revenue and expenditure)
TABLE 22 Table A5 - Budgeted Capital Expenditure by vote, standard classification and funding source
TABLE 23 Table A6 - Budgeted Financial Position TABLE 24 Table A7 - Budgeted Cash Flow Statement
TABLE 25 Table A8 - Cash Backed Reserves/Accumulated Surplus Reconciliation
TABLE 26 Table A9 - Asset Management
TABLE 27 Table A10 - Basic Service Delivery Measurement TABLE 28 Proposed Schedule of IDP/Budget Road Shows
TABLE 29 Alignment of BCMM Objectives with National and Provincial Plans
TABLE 30 Table SA4 – Reconciliation between the IDP strategic objectives and budgeted revenue
TABLE 31 Table SA5 – Reconciliation between the IDP strategic objectives and budgeted operating expenditure
TABLE 32 Table SA6 – Reconciliation between the IDP strategic objectives and budgeted capital expenditure
TABLE 33 Table SA7 – Measurable Performance Objectives
TABLE 34 Table 28 Table SA8 – Performance indicators and benchmarks
TABLE 35 Funding required to address issue of bulk water conveyance and treatment TABLE 36 Funding required to address bulk sanitation and backlogs
TABLE 37 2012/2013 to 2015/2016 Budget Assumptions TABLE 38 Credit rating outlook
TABLE 39 Proposed Tariff Increases over the Medium Term TABLE 40 SA15 – Detail Investment Information
TABLE 41 SA16 – Investment particulars by maturity TABLE 42 Sources of capital revenue over the MTREF TABLE 43 Table SA 17 - Detail of borrowings
TABLE 44 Table SA 18 - Capital transfers and grant receipts TABLE 45 Table A7 – Budgeted Cash Flow Statement
TABLE 46 Table A8 – Cash-backed Reserves/Accumulated Surplus Reconciliation TABLE 47 SA10 – Funding compliance measurement
TABLE 48 SA19 - Expenditure on transfers and grant programmes
TABLE 49 SA 20 - Reconciliation between of transfers, grant receipts and unspent funds TABLE 50 SA22 - Summary of councillor and staff benefits
TABLE 51 SA23 - Salaries, allowances and benefits (political office bearers/
councillors/snr managers)
TABLE 52 SA24 – Summary of personnel numbers
TABLE 53 SA25 - Budgeted monthly revenue and expenditure
TABLE 54 SA26 - Budgeted monthly revenue and expenditure (municipal vote)
TABLE 55 SA27 - Budgeted monthly revenue and expenditure (standard classification) TABLE 56 SA28 - Budgeted monthly capital expenditure (municipal vote)
TABLE 57 SA29 - Budgeted monthly capital expenditure (standard classification) TABLE 58 SA30 - Budgeted monthly cash flow
TABLE 59 SA 34a - Capital expenditure on new assets by asset class
TABLE 60 SA34b - Capital expenditure on the renewal of existing assets by asset class TABLE 61 SA34c - Repairs and maintenance expenditure by asset class
TABLE 62 SA35 - Future financial implications of the capital budget TABLE 63 SA36 - Detailed capital budget per municipal vote
TABLE 64 SA37 – Projects Delayed from the Previous Financial Year
TABLE 65 Table SA1 - Supporting detail to budgeted financial performance
TABLE 66 Table SA2 – Matrix financial performance budget (revenue source/expenditure type and department)
TABLE 67 Table SA3 – Supporting detail to Statement of Financial Position
TABLE 68 Table SA9 – Social, economic and demographic statistics and assumptions TABLE 69 SA32 – List of external mechanisms
LIST OF FIGURES
FIGURE 1 Figure 1 Main operating revenue categories for the 2013/14 financial year FIGURE 2 Main operational expenditure categories for the 2013/14 financial year
AMR ASGISA BCMM BPC CBD CFO CM CPI CRRF DBSA DoRA DWA EE EEDSM EM EPWP FBS FMG GAMAP GDP GDS GFS GRAP HR HSDG HSRC IDP IDZ INEP IT kℓ km KPA KPI
Automate Accelerate
Initiative Buffalo Ci Budget Pl Central Bu Chief Fina City Mana Consume Capital Re Developm Division o Departme Employme Energy Ef Managem Executive Expanded Free basic Finance M Generally Accountin Gross dom Gauteng G Strategy Governme General R Practice Human Re Human Se Human Sc Integrated Industrial Integrated Programm Informatio kilolitre kilometre Key Perfo Key Perfo
ABBR
d Meter Re ed and Sha ty Metropo anning Com usiness Dis ancial Office ager
r Price Inde eplacement ment Bank o of Revenue ent of Water ent Equity fficiency De ment
e Mayor d Public Wo
c services Managemen
Accepted ng Practice mestic prod Growth and ent Financi Recognised
esources ettlement D cience Res d Developm Developme d National E me
on Technolo
ormance Ar ormance Ind
EVIATIO
eading ared Growth
litan Munic mmittee strict
er ex
t Reserve F of South Afr
Act r Affairs emand Side
orks Progra nt Grant
Municipal duct
d Developm al Statistics d Accountin
Developmen search Cou ment Plan
ent Zone Electrificatio ogy
ea dicator
ONS AN
h cipality
Fund rica
e
amme
ment s
g
nt Grant ncil
on
kW ℓ LE M M M M M M M M M N N N O O PB PH PM PP PP PT R R SA SA SD SM U W W
ND ACR
Wh kilow litre ED Loc MBRR Mu Reg MEC Mem MFMA Mun
Pro MIG Mun MMC Mem MPRA Mun MSA Mun MTEF Med MTREF Med Fram ERSA Nat
Afric GO Non KPIs Nat HS Occ P Ope BO Pub HC Prov MS Perf PE Pro PP Pub TIS Pub G Res SC Reg ALGA Sou Ass APS Sou DBIP Serv
Plan MME Sma SDG Urb WSA Wat WSDP Wa
ONYMS
watt cal Econom
nicipal Bud gulations mber of the nicipal Fina
gramme nicipal Infra mber of Ma nicipal Prop nicipal Syst dium-term E dium-term R
mework ional Electr ca
n-Governme ional Key P cupational H erational Pl blic Benefit vincial Hea formance M perty Plant blic Private blic Transpo structuring G gional Serv uth African sociation uth African
vice Delive n
all Micro an ban Settlem ter Service ater Service
S
ic Developm dgeting and e Executive ancial Mana astructure G ayoral Comm
perties Rate tems Act Expenditure Revenue an ricity Regul ental organ Performanc Health and
an
Organisatio alth Care
Managemen and Equip Partnership ort Infrastru Grant ices Counc Local Gove Police Serv ery Budget I nd Medium ment Develo s Authority es Developm
ment Reporting
Committee agement Ac Grant
mittee es Act e Framewo nd Expend
ator South nisations ce Indicators
Safety ons nt System pment
p
ucture Syste cil
ernment vice
Implementa Enterprise opment Gra ment Plan
e ct
ork iture
s
em
ation s ant
PA ART 1 – A ANNUA AL BUDGET
1.1 EXECUTIVE MAYOR’S REPORT
Since the advent of the new dispensation in 1994, our government has emphasised the political and developmental necessity for all spheres of government to work with all sectors of society to address the challenges of under-development we inherited in 1994.
At every opportunity, our leaders have never diverted from the script that we need “all hands on deck!” This remains the mantra of our government to this day.
In 2009, the ANC government led by President Zuma, followed on this tradition by adopting the slogan, “Together We Can Do More.”
It is in our interest to make our city competitive and attractive to domestic and foreign investment and most importantly, as a learning organisation.
Extreme poverty causes enormous human suffering and still afflicts over one in every five people on earth, according to World Bank statistics.
The biggest lesson learned from success stories around the world, is that real progress on reducing poverty levels can be achieved in a very cost-effective manner, if programmes pursued are well targeted.
The National Development Plan
The National Development Plan which was adopted at the ANC’s 53rd National Conference in Mangaung identifies 5 pillars for the economy to grow to a level to which we can create sustainable jobs, these are;
• Creating an environment for sustainable employment and economic growth;
• Promotion of employment in labour-absorbing industries;
• Promoting exports and competitiveness; strengthening the capacity of government to implement its economic policy, and
• Demonstrating strategic leadership among the stakeholders to mobilise around the national vision.
I am sure many of you will agree with my assertion that Cities that invest in infrastructure have a higher propensity to succeed that those that do not.
In the context of the National Development Plan, as Buffalo City Metropolitan Municipality, we see our primary task as developing and maintaining our infrastructure in order to ensure that our private sectors partners see the potential to keep increasing their investment in our City, while creating more jobs for our people.
Infrastructure Development
We are busy upgrading our electricity grid by building a new Queenspark Zoo Sub- station at a cost of R160 million to improve the energy capacity to the CBD and surrounding areas of East London central. In addition to this, we are planning a bulk electricity infrastructure upgrade amounting to R650 million, for the entire BCMM area to improve reliability of supply of the BCMM network for both domestic and commercial consumers. This project will be implemented over a period of 20 years.
Again a massive multi-year upgrading project of the Mzonyana Treatment Works to the value of approximately R100 million is underway to provide capacity to produce treated water for the supply zone that include East London CBD and West Bank which may cover the proposed Rocklyff development. This project will be completed in 2015/16.
Zwelitsha Waste Water Treatment Works Upgrade, estimated to cost us R216 million will provide a centralized regional treatment facility for the Inland Region which will service the domestic and business community from Bisho, Breidbach, Zwelistha, Pakamisa, Schornville, Ginsberg, etc. This project is expected to be completed in 2015/16
This infrastructure investment augers for the construction of the R2 billion Provincial Government Office precinct in Bhisho and will ensure integration King Williams Town and Bhisho.
These projects are an important investment in ensuring that our inner city does not degenerate into a slum but remains the vibrant centre of economic activity that it is.
Upgrading of Quenera Waste Water Treatment Works for R49 million will provide more capacity for sewer treatment for future development on the Gonubie area which also include the eastern parts of Beacon Bay and Bufferstrip Bulk Sewer Upgrade for R35 million will provide more sewer conveyance capacity for future growth within and around the Mdantsane area which includes areas such as the Mount Ruth Nodal Development.
Both these projects will be completed in 2013/14.
One of the biggest challenges we still face as the city is the ever increasing cost of maintaining our existing infrastructure. This is due to a number of contributing factors, including urban migration which results in people seeking work opportunities in the city.
Our road infrastructure is under immense pressure from heavy duty trucks that go through the city en route to either Port Elizabeth, Cape Town, Mthatha or Durban.
The Fleet Street upgrade totalling approximately R100 million will improve the condition of the major by-pass road used by freight and public transport passing through the city.
This project will be completed in 2014/15.
In terms of the long-term with regards to our road infrastructure, we have commissioned a feasibility study to look at diverting traffic away to the N2 via R72. We will soon be engaging the provincial government and national department of transport to explore different options we think could assist all of us.
The Quenera Road Construction Phase 2 will provide additional access to Gonubie over the Quenera River and open up the mixed residential investment zone for along the Quenera River.
At the Mayoral Lekgotla held from 28 February to 2 March 2013, it was resolved that development needed to be facilitated and prioritised in the Metro to assist and ensure that the private sector continued investing in the city. We have now resolved to ensure that our turnaround times are shortened for processing and approval of development and building plans.
Local Economic Development
The East London IDZ’s key mandate is to ensure that we create jobs by attracting foreign direct investment. As a shareholder, we are doing our part to ensure that we create an enabling environment for the IDZ to operate in conditions that allow them to realize their strategic goals by making available 870 hectares of land in the Berlin area for projects that will create job opportunities for our people
As a metro we are working hard to ensure that we support our auto sector by developing and maintaining our infrastructure in order for this sector to operate efficiently. We are very keen to maintain our niche in the auto sector by leveraging on the opportunities presented by expansion of MBSA. We trust that this opportunity will lead to creation of new SMMEs on the supply side.
As a rural Metro we also have to exploit our agricultural potential and in doing so we have identified pockets of land within our city that is suitable for maize, pineapple and oranges. In the same vein we need to develop the agro-processing infrastructure to ensure that we produce value-added products.
Tourism
As a city we have to ensure that we utilize the potential this city has on tourism. We now have an International Convention Centre which has capacity to host international conferences and sporting events.
The city is also planning to develop the Orient Theatre precinct into a sports complex that will host major indoor events such as Boxing, as well as upgrading the stadium in order to make it possible to host major soccer and rugby games.
We have two universities and two FET colleges in our Metro. The biggest challenge facing these institutions among others is accommodation for students and lecturing staff. The Metro and business need to work together with these institutions to provide the necessary infrastructure to accommodate the universities needs.
Public Safety
Due to the installation & monitoring of CCTV cameras at Mdantsane Highway, which was a major crime spot in the past, criminal behaviour has migrated from Mdantsane to
the CBD. The installation of these cameras have proven to be an effective deterrent for crime related incidents. The City has embarked on a programme of identifying major hot spots for crime and the next phase for the installation of CCTV cameras will be rolled out on the Beachfront and the CBD.
This measure should prove effective for ensuring the continuous safety of residents, visitors and businesses in the City. The City will undertake a needs analysis to formulate a Master Plan for the implementation of CCTV cameras in BCMM.
Clean City Campaign
The problematic waste management issues are currently being attended to. We are working around the clock to ensure that our landfill sites are being rehabilitated to render them effective. We recently acquired ten new refuse trucks lessen the burden on our fleet and to improve refuse collection particularly in areas such as Mdantsane.
We are continuously investigating the logistics around refuse removal so that the most effective and efficient service can be rendered.
Sports & Recreation
We are working tirelessly to improve our social infrastructure. Swimming Pools in Mdantsane and Waterworld are being re-designed in order to render them safe for our communities to utilize them. We are also upgrading Victoria Grounds in King William’s Town.
Stakeholder Engagement
We know that the success of our municipality depends on the extent to which we involve all our stakeholders in our programmes. We have 50 active ward committees throughout the Metro. The committees work with our Ward Councillors and provide a direct link to our communities.
Our observations are that there is a lack of proper communication between communities and municipalities, which does not directly necessarily mean poor service delivery. This is not to undervalue the importance of delivering services to our people. This, after all, is the main reason for our existence.
International Relations
Development Cooperation and International Relations mainly focuses on donor relations and aid however our partnerships are also aligned to our developmental agenda as the City and are focused at:
• Exploring economic development opportunities with specific interest in attracting tourism, investment and trade to our city
• Cementing cultural development through cultural exchanges
• Social development focusing on sports, education and health.
• Skills and capacity building programmes for improved service delivery
Our city has formed partnerships with seven international cities, the latest being the City of Oldenburg in Germany.
Through our international twinning’s we are eager to facilitate business to business partnerships between our Metro and these Cities. Some of the opportunities that exist include the interest from Chinese cities in rural development with interest in cattle, soy bean and corn farming, the City of Oldenburg in Germany has shown keen interest in textile and renewable energy.
The Swedish City of Gävle has shown interest for business to business exchange through application to the International Centre for Local Democracy however there is also interest in sludge management and recycling of sanitation as Gavle has a municipal owned company that deals with this area.
In conclusion, I want to rededicate the combined efforts of the political leadership and management of Buffalo City Metropolitan Municipality to the task of fulfilling the local interests of our people within the national priority of endeavouring to create a better life for all our people.
________________
Z.V. NCITHA
EXECUTIVE MAYOR
1.2 COUNCIL RESOLUTIONS
It is recommended that Council of Buffalo City Metropolitan Municipality, acting in terms of the Section 24 of the Municipal Finance Management Act, (No. 56 of 2003) approves and adopts the following resolutions:-
1. The 2013/14 Draft Medium Term Revenue and Expenditure Framework Budget
R thousands
2013/14 2014/15 2015/16 BUDGET
YEAR R’000
BUDGET YEAR 1
R’000
BUDGET YEAR 2
R’000
Total Revenue 4,460,342 5,005,110 5,433,374
Total Operating Expenditure 4,191,665 4,453,488 4,757,016
Surplus / (Deficit) 268,677 551,622 676,358
Operating Projects 330,182 525,442 517,558
Surplus /(Deficit) After Operating Projects (61,505) 26,180 158,880
Capital Projects 754,958 768,243 825,860
TOTAL BUDGET 5,276,805 5,747,172 6,100,434
2. The 2013/14 Medium Term Revenue and Expenditure Framework budget of the municipality as set out in the following tables:
2.1 Budgeted Financial Performance (revenue and expenditure by standard classification) as contained in Table 18;
2.2 Budgeted Financial Performance (revenue and expenditure by municipal vote) as contained in Table 19;
2.3 Budgeted Financial Performance (revenue by source and expenditure by type) as contained in Table 20; and
2.4 Budgeted Capital Expenditure appropriations by municipal vote and standard classification and associated funding by source as contained in Table 21.
3. The Financial Position, Cash Flows, cash-backed reserve/accumulated surplus, asset management and basic service delivery targets are approved as set out in the following tables:
3.1 Budgeted Financial Position as contained in Table 22;
3.2 Budgeted Cash Flows as contained in Table 23;
3.3 Cash backed reserves and accumulated surplus reconciliation as contained in Table 24;
3.4 Asset management as contained in Table 25; and
3.5 Basic service delivery measurement as contained in Table 26.
4.1 The 2013/14 Draft MTREF Tariff Increases:
Description 2012/2013 2013/2014 2014/2015 2015/2016
Rates 12.30% 11.90% 11.50% 11.30%
Refuse 13.30% 12.90% 12.50% 12.30%
Sewerage 11.30% 10.90% 10.50% 10.30%
Electricity 13.50% 10.00% 10.00% 10.00%
Water 15.15% 15.35% 14.95% 14.75%
Fire Levy 10.30% 9.90% 9.50% 9.30%
Sundry Income 10.30% 9.90% 9.50% 9.30%
5 The Buffalo City Metropolitan Municipality Council, acting in terms of section 75A of the Local Government: Municipal Systems Act (Act 32 of 2000) approves and adopts effect from 1 July 2013:
5.1 the tariffs for property rates – as set out in Annexure E 5.2 the tariffs for electricity – as set out in Annexure E
5.3 the tariffs for the supply of water – as set out in Annexure E 5.4 the tariffs for sanitation services – as set out in Annexure E 5.5 the tariffs for solid waste services – as set out in Annexure E 5.6 miscellaneous tariffs as set out in Annexure E
6 The Buffalo City Metropolitan Municipality Council, acting in terms of 75A of the Local Government: Municipal Systems Act (Act 32 of 2000) approves and adopts with effect from 1 July 2013 the tariffs for other services as set out in Annexure F.
7 To give proper effect to the municipality’s annual budget, the Council of Buffalo City Metropolitan Municipality approves:
7.1 That an indigent subsidy be granted to registered indigents in terms of Council’s Indigent Policy.
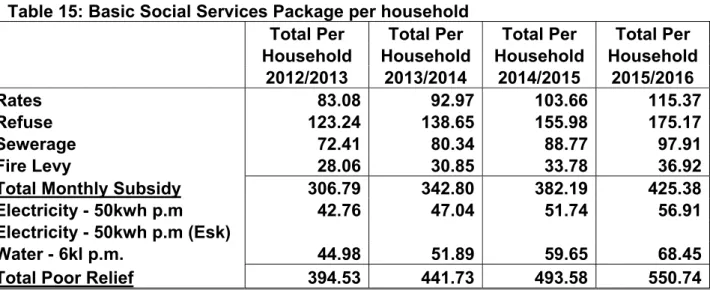
7.2 That an indigent consumer be given a maximum subsidy on his account of R441.73 per month, which includes a maximum of 50kwh for electricity and 6kl for water.
7.3 That free basic electricity be granted for a registered indigent consumer of 50KWh per month.
7.4 That free basic water be granted to a registered indigent of 6Kl per month.
8 The Buffalo City Metropolitan Municipality Council, approves and adopts the Draft budgeted related policies as set out in Annexure F
8.1 Asset Management Policy
8.2 Capital Infrastructure Investment Policy 8.3 Policy on Long-term Financial Planning 8.4 Funding and Reserves Policy
8.5 Virement Policy
9 That no new capital expenditure be undertaken until a commitment for funding has been received by Buffalo City Metropolitan Municipality and such project has been approved by Council.
10 Council notes that the 2013/14 Draft MTREF Budget tabled for adoption is structured in terms of the then Buffalo City Municipality votes and functions.
11. MFMA Circular 66 and 67, Municipal Budget Circular for the 2013/14 MTREF attached as Annexure to be noted by Council.
1.3 EXECUTIVE SUMMARY
The financial economic meltdown still prevails as countries in the euro-zone battle to come to grips with the financial crisis that is looming upon them.
The minister of finance was very moderate in indicating a slight increase in growth from 3% to 3.8% in the 2015/16 financial year. However, it must be emphasised that the inflation rate is still accelerating, and the constant high increases in fuel prices will eventually impact on the food basket of the poor.
BCMM has adopted a very conservative approach in preparation of the 2013/14 MTREF Budget as it is of a strong view that any major shift upwards in its parameters will result in an ever-growing debt book.
The following was taken into consideration in preparation of the MTREF Budget:
(a) Tariffs have been reduced by 0.2%, except for electricity and water to that which was approved in the 2012/13 MTREF period.
(b) Electricity is at 10% where 2% will be ring-fenced for bulk infrastructure upgrade
(c) Water, the most important commodity in bringing clean drinking water to all our citizens, will be the most valuable and expensive commodity of the future. Currently, BCMM is experiencing an average of 47% water losses (9.7% Technical Water Losses;
37.5%. Non-Revenue Water Losses), whether through systems, non-billing and theft.
The tariff is set at 15.35%
(d) There has been no increase in general expenses except for fuel and operating leases.
(e) Repairs and Maintenance has been maintained at a steady growth, where the surpluses have been directed to ensure that we maintain the healthy state of our assets.
In terms of the National Development Plan, the budget will be focused on:
1. Job Creation, whether through the EPWP Programme, major contracts and through skilling identified personnel.
2. Bulk infrastructure directed to housing, new businesses and industries.
3. Water and Sanitation has been prioritized to ensure services to all our citizens.
4. The creation of a sustainable human settlement/built environment. A place of work, stay and play.
The city has embarked on moving away from a funded budget to that of financial resilience in the future, but gradually increasing its surpluses over the medium to long term. The generation of additional surpluses is to move the city away from being grant dependent to that of financial sustainability.
National Treasury’s MFMA Circular No. 66 and 67 was used to guide the compilation of the 2013/14 Draft MTREF Budget.
1.3.1 KEY FOCUS AREAS FOR THE 2013/14 BUDGET PROCESS
• Economy projected growth by 2014 – GDP growth from 3% to 3.8% in 2015/16.
• Interventions:
° Investing in strategic infrastructure programmes
° Electricity generation
° Transport capacity
° Industrial opportunities / Job creation
° Strengthening municipal finances
° Investing in residential development and urban infrastructure
• Municipal revenues and cash flows – remain under pressure in 2013/14
• Municipalities must adopt conservative approach when projecting expected revenues
• Municipalities manage revenue effectively and evaluate spending decisions Key Priorities:
• Water and Sanitation
• Human Settlements
• Local Government Infrastructure
• Job Creation: EPWP – Schedule & Grant
As per Circular 66 and 67 the following areas require particular attention:
(i) Revenue Management - To ensure all households are accurately billed and revenue collected.
(ii) Collection Outstanding Debt - Ensure sufficient administrative capacity, political commitment and accuracy and affordability of the accounts for poor household.
(iii) Pricing of Services – To ensure that the services rendered are recovered in terms of the pricing structure.
(iv) Repairs and Maintenance – Assets should be maintained in a healthy state in order to generate revenue over a longer term.
(v) Spending on non-Priorities – Ensure that funding is allocated to prioritized items.
1.3.2 NATIONAL PRIORITY – EMPLOYMENT OPPORTUNITIES a) Service Delivery and Labour Intensive Capital Projects b) Service Providers should use Local Labour
c) Supporting Labour Intensive LED Projects
d) Participating in the Extended Public Works Programme e) Provide young people with on-the-job training
1.3.3 BUDGET PRINCIPLES AND GUIDELINES
The following budget principles and guidelines directly informed the compilation of the 2013/14 MTREF:
• The 2012/13 Adjustments Budget priorities and targets, as well as the base line allocations contained in that Adjustments Budget were adopted as the upper limits for the new baselines for the 2013/14 Draft MTREF Budget;
• Tariff and property rate increases affordability and the fact that they should generally not exceed inflation as measured by the CPI, except where there are price increases in the inputs of services that are beyond the control of the municipality, for instance the cost of bulk water and electricity. In addition the fact that tariffs need to remain or move towards being cost reflective, and should take into account the need to address infrastructure backlogs;
1.3.4 FINANCIAL MODELLING AND KEY PLANNING DRIVERS
As part of the compilation of the 2013/14 MTREF, extensive financial modelling was undertaken to ensure affordability and long-term financial sustainability. The following key factors and planning strategies have informed the compilation of the 2012/13 MTREF:
• IDP priorities and strategic objectives
• Economic climate and trends (i.e. inflation, Eskom increases, Amatola Water increases, indigent policy, etc.)
• The approved 2012/13 adjustments budget and performance against the SDBIP
• Cash Flow Management Strategy
• Current debtor payment levels
• Loan and investment possibilities
• The need for tariff increases versus the ability of the community to pay for services;
• Improved and sustainable service delivery
In addition to the above, the strategic guidance given in National Treasury’s MFMA Circulars 66 and 67 has been taken into consideration in the planning and prioritisation process.
1.3.5 CHALLENGES
The main challenges experienced during the compilation of the 2013/14 Draft MTREF can be summarised as follows:
• The ongoing difficulties in the national and local economy, resulting in the consumers ability to pay for services;
• Aging and poorly maintained water, roads and electricity infrastructure;
• The need to reprioritise projects and expenditure within the existing resource envelope given the cash flow realities in providing an effective and efficient service to the community at large;
• The increased cost of bulk water (due to tariff increases from Amatola Water) is placing upward pressure on service tariffs to residents. Continuous high tariff increases are not sustainable - as there will be point where services will no-longer be affordable; which will result in an increase in the debt book.
• Wage increases for municipal staff that continue to exceed consumer inflation, as well as the need to fill critical vacancies;
• Affordability of capital projects – original allocations had to be reduced and the operational expenditure associated with prior year’s capital investments needed to be factored into the budget as part of the 2013/14 Draft MTREF process.
• Ensuring that the informal settlements obtain basic services as well as rolling out the electrification programme
In view of the aforementioned, the following table is a consolidated overview of the 2013/14 Medium-Term Revenue and Expenditure Framework:
Table 1 Consolidated Overview of the 2013/14 Draft MTREF
R thousands
2013/14 2014/15 2015/16 BUDGET
YEAR R’000
BUDGET YEAR 1
R’000
BUDGET YEAR 2
R’000
Total Revenue 4,460,342 5,005,110 5,433,374
Total Operating Expenditure 4,191,665 4,453,488 4,757,016
Surplus / (Deficit) 268,677 551,622 676,358
Operating Projects 330,182 525,442 517,558
Surplus /(Deficit) After Operating Projects (61,505) 26,180 158,880
Capital Projects 754,958 768,243 825,860
TOTAL BUDGET 5,276,805 5,747,172 6,100,434
1.3.6 OPERATING BUDGET 1.3.6.1 REVENUE
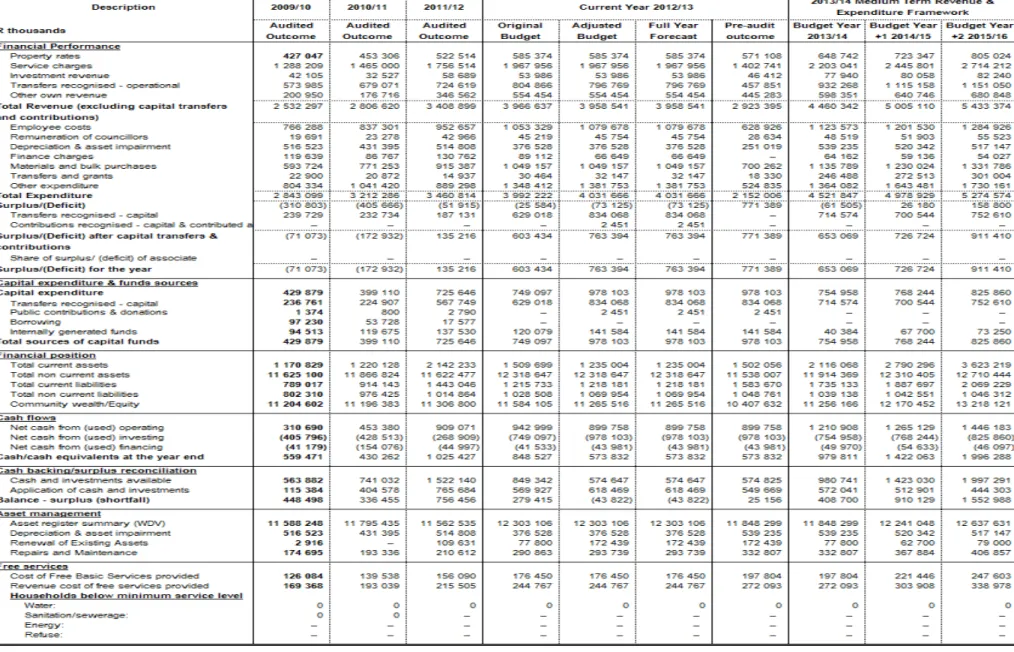
Operating revenue increases from R3.958 million in 2012/13 to R4.46 million in 2013/14.
This reflects a 13% growth in revenue which is comparable with the same growth in 2012/13 financial year as well as average tariff increase of 12%. This is mainly due to the following factors:
• A decline in growth in the equitable share allocation from 16.9% in the 2012/13 financial year to 0.3% in the 2013/14 financial year due to the revision of the equitable share allocation formula.
• A decline in growth in the fuel levy allocation for 86% in the 2012/12 financial year to 8% in the 2013/14 financial year.
• Increase in the allocation for Human Settlements from R168 million to R216 million in 2013/14 financial year.
Total operating revenue has grown by 12.68 per cent or R502 million for the 2013/14 financial year when compared to the 2012/13 Adjustments Budget. For the two outer years, operational revenue will increase by 12.22 and 8.55 per cent respectively, equating to a total revenue growth of R1.48 billion over the MTREF when compared to the 2012/13 financial year.
Table 2: Average Tariff increases for 2012/13, 2013/14 and 2014/15
Description 2012/2013 2013/2014 2014/2015 2015/2016
Rates 12.30% 11.90% 11.50% 11.30%
Refuse 13.30% 12.90% 12.50% 12.30%
Sewerage 11.30% 10.90% 10.50% 10.30%
Electricity 13.50% 10.00% 10.00% 10.00%
Water 15.15% 15.35% 14.95% 14.75%
Fire Levy 10.30% 9.90% 9.50% 9.30%
Sundry Income 10.30% 9.90% 9.50% 9.30%
Rates
The proposed average rates tariff increase is 11.9% for all categories of properties whilst the estimated total rates income is increased by a further 11%. This is due to growth in the valuation roll as a result of implementation of valuation roll undertaken. The rates rebate to Pensioners and Disabled Persons is now available to qualifying ratepayers whose gross monthly household income is R5,000 per month. The definitions and listing of categories are reflected in the Draft Tariff Book attached as an annexure E.
Water
The proposed water tariff increase is 15.35% whilst total water revenue has increased by 19%. The Bulk Water purchases tariff has been increased by 10.5%. The tariff increases are necessary to address essential operational requirements, maintenance of existing infrastructure, new infrastructure provision and to ensure the financial sustainability of the
service. The monthly indigent grant will increase from R44.98 to R51.89 for provision of the 6kl p.m.
Sanitation
The proposed water tariff increase is 10.9% whilst total sanitation revenue has increased by 11%. The tariff increases are necessary to address essential operational requirements, maintenance of existing infrastructure, new infrastructure provision and to ensure the financial sustainability of the service. The monthly indigent grant will increase from R72.41 to R80.34.
Solid Waste
The proposed solid waste tariff increase is 12.9% whilst total solid waste revenue has increased by 12%. The Solid Waste Tariffs are levied to recover amongst others costs of services provided directly to customers and include refuse collection fees, disposal fees, weighbridge fees and other ad hoc services. The monthly indigent grant will increase from R123.24 to R138.65.
Electricity
The proposed electricity tariff increase is 10% and the total electricity revenue has increased at the same rate. Guidelines for the municipal electricity tariff increase issued by NERSA is 8% However, the bulk purchases by the City are expected to rise by 8%. This increase, together with increases in expenditure on Salaries and Wages, Repairs &
Maintenance and contributions to the Rates Account require the electricity tariffs to be increased by an additional 2% which is going to be ring-fenced for the electricity infrastructure upgrade. The monthly indigent grant will increase from R42.76 to R47.04 for provision of the 50kwh p.m.
1.3.6.2 EXPENDITURE
Total Operating expenditure budget has increased by 12% from R4.03 million in 2012/13 to R4.5 million in 2013/14 financial year. This increase is 1% below the increase in revenue budget and details per expenditure categories are indicated in the table below.
Total operating expenditure for the 2013/14 financial year has been appropriated at R4,5 billion and translates into a budgeted deficit of R61,5 million. The deficit of R61,5 is due to the operating projects which are being funded from accumulated surpluses. It must be noted that depreciation for the MTREF period is fully funded. When compared to the 2012/13 Adjustments Budget, operational expenditure has grown by 12.1% in the 2013/14 budget and by 10.1% and 5.9% for each of the respective outer years of the MTREF. The operating surplus for the two outer years steadily increases to R26.1 million and R158.8 million respectively.
Reasons for expenditure categories where growth is above the average of 12%:
Salaries, Wages and Allowances
Salaries, wages and allowances have been increased by 6.85%. The growth from 2012/13 is 4% due to funding of critical vacant unfunded posts.
Debt Impairment
Provision for Debt Impairment has declined by 14% when compared to the 2011/12 financial year due to an increase in the collection rate which is projected to be 93.5% by end of 2012/13 financial year.
Depreciation & Asset Impairment
The increase of 43% is as a result of prior years infrastructure assets which was disclosed as work in progress and has since been capitalised.
Bulk Purchases
The increase is due to higher-than-inflation bulk purchase cost hikes envisaged for mainly water purchases from Amatola Water.
Repairs and maintenance –
The budget for repairs and maintenance reflects growth of 13% when compared to the 2012/13 financial year due to increase in budget allocated to 10% of service revenue except for refuse which is 8%.
Operating Projects –
This reflects a growth of 69% when compared to the 2012/13 financial year due to an increase in the Human Settlements allocation for housing top structure.
1.3.7 CAPITAL BUDGET
The Capital Budget increases from R749 million in 2012/13 (original budget) to R755 million in 2013/14. This reflects an overall growth of 0.8%, however there is a decrease of 22.8% when compared to the adjusted budget due to roll-over of 2011/12 unspent conditional grants of R267million.
The capital programme is R754,9 million in the 2013/14 financial year and then R768,2 and R825,9 million in the 2014/15 and 2015/16 financial years.
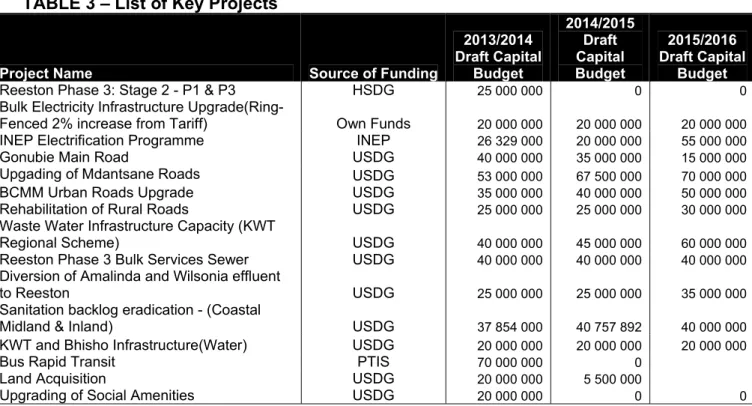
TABLE 3 – List of Key Projects
Project Name Source of Funding
2013/2014 Draft Capital
Budget
2014/2015 Draft Capital Budget
2015/2016 Draft Capital
Budget
Reeston Phase 3: Stage 2 - P1 & P3 HSDG 25 000 000 0 0
Bulk Electricity Infrastructure Upgrade(Ring-
Fenced 2% increase from Tariff) Own Funds 20 000 000 20 000 000 20 000 000 INEP Electrification Programme INEP 26 329 000 20 000 000 55 000 000
Gonubie Main Road USDG 40 000 000 35 000 000 15 000 000
Upgading of Mdantsane Roads USDG 53 000 000 67 500 000 70 000 000
BCMM Urban Roads Upgrade USDG 35 000 000 40 000 000 50 000 000
Rehabilitation of Rural Roads USDG 25 000 000 25 000 000 30 000 000 Waste Water Infrastructure Capacity (KWT
Regional Scheme) USDG 40 000 000 45 000 000 60 000 000
Reeston Phase 3 Bulk Services Sewer USDG 40 000 000 40 000 000 40 000 000 Diversion of Amalinda and Wilsonia effluent
to Reeston USDG 25 000 000 25 000 000 35 000 000
Sanitation backlog eradication - (Coastal
Midland & Inland) USDG 37 854 000 40 757 892 40 000 000
KWT and Bhisho Infrastructure(Water) USDG 20 000 000 20 000 000 20 000 000
Bus Rapid Transit PTIS 70 000 000 0
Land Acquisition USDG 20 000 000 5 500 000
Upgrading of Social Amenities USDG 20 000 000 0 0
1.4 OPERATING REVENUE FRAMEWORK
For BCMM to continue improving the quality of services provided to its citizens it needs to generate the required revenue. In these tough economic times strong revenue management is fundamental to the financial sustainability of every municipality. The reality is that the City is faced with development backlogs and increasing rate of unemployment. The expenditure required to address these challenges will inevitably always exceed available funding; hence difficult choices have to be made in relation to tariff increases and balancing expenditures against realistically anticipated revenues to be collected.
The municipality’s revenue strategy is built around the following key components:
• National Treasury’s guidelines and macroeconomic policy;
• Growth in the City and continued economic development;
• Efficient revenue management, which aims to ensure a 94% (per cent) annual collection rate for property rates and other key service charges;
• Electricity tariff increases as approved by the National Electricity Regulator of South Africa (NERSA);
• Achievement of full cost recovery of specific user charges especially in relation to trading services;
• Determining the tariff escalation rate by establishing/calculating the revenue requirement of each service;
• The municipality’s Property Rates Policy approved in terms of the Municipal Property Rates Act, 2004 (Act 6 of 2004) (MPRA);
• Increase ability to extend new services and recover costs;
• The municipality’s Indigent Policy and rendering of free basic services; and
• Tariff policies of the City.
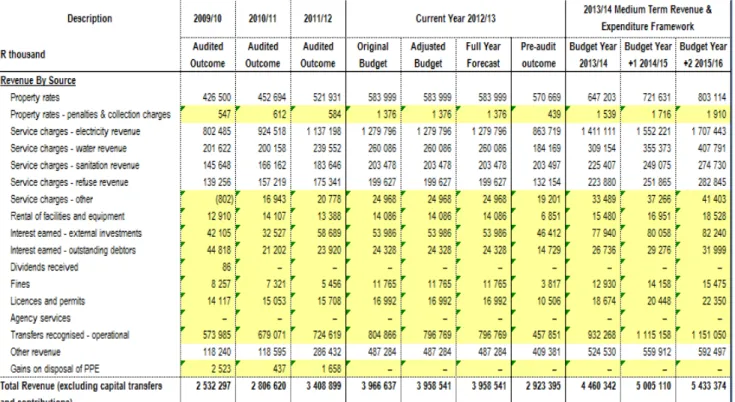
The following table is a summary of the 2013/14 Draft MTREF (classified by main revenue source):
Table 4: A4 - Percentage growth in revenue by main revenue source
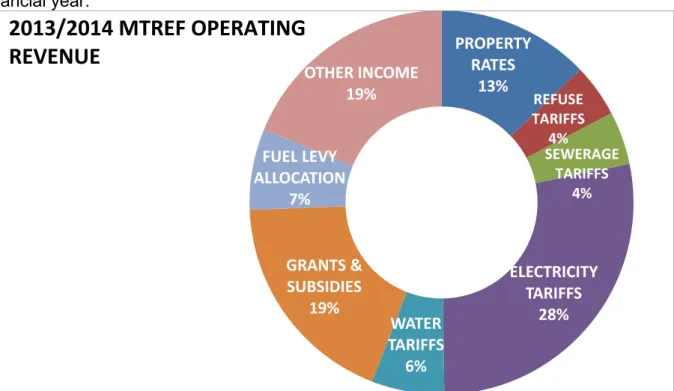
The following graph gives a breakdown of the main revenue categories for the 2013/14 financial year.
Figure 1: Main Operating Revenue categories for the 2013/14 financial year PROPERTY
RATES
13% REFUSE TARIFFS
SEWERAGE 4%
TARIFFS 4%
ELECTRICITY TARIFFS WATER 28%
TARIFFS 6%
GRANTS &
SUBSIDIES 19%
FUEL LEVY ALLOCATION
7%
OTHER INCOME 19%
2013/2014 MTREF OPERATING
REVENUE
In 2012/13 the City’s own generated revenue is 65% of the total revenue totalling to R2.6 billion and is declining to 64% which R2.9 billion, R3.2 billion and R3.6 billion in the respective financial years of the 2013/14 MTREF period. This is mainly attributed to the electricity service contribution to the total revenue mix which is 32% in the 2013/14 financial year and declining to 31% in the two outer years. The decline is due to an increase in grant funded operating projects. Electricity revenue is increasing from R1.2 billion in 2012/13 1/12 to R1.4 billion, R1.5 billion and R1.7 billion in 2013/14 MTREF period respectively. Property rates are the second largest revenue source with 15%
contribution over the 2013/14 MTREF period.
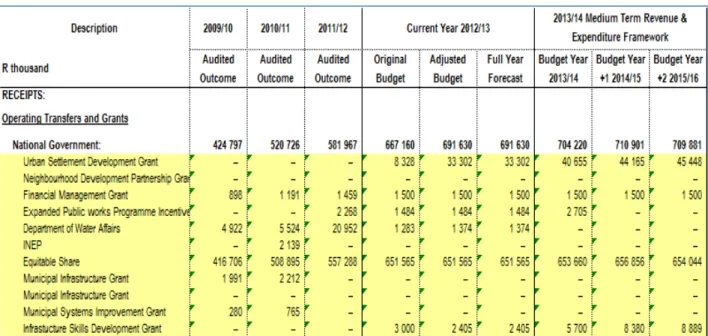
Operating grants and transfers contribute on average 21% of the total operating revenue.
This totals R796 million in the 2012/13 financial year and increases to R932 million (2013/14), R1.1 billion (2014/15) and R1.15 billion (2015/16).
The following table gives a breakdown of the various operating grants and subsidies allocated to the City over the medium term.
Table 5: SA18 - Operating Transfers and Grant Receipts
1.4.1 Property Rates and Service Charges and Impact of Tariff Increases
The proposed revisions to the tariffs have been formulated in accordance with the BCMM’s and comply with Section 74 of the Municipal Systems Act as well as the recommendations of the National Energy Regulator of South Africa (NERSA).
In terms of section 75A of the Local Government Municipal Systems Act, any fees, charges or tariffs which a municipality may wish to levy and recover in respect of any function or service of the municipality, must be approved by a resolution passed by the municipal council with a supporting vote of a majority of its members.
1.4.1.1 Property Rates
Property rates are a major source of revenue income for the City and contribute to cover the cost of the provision of general services. Determining the effective property rate tariff is therefore an integral part of the BCMM’s budgeting process.
National Treasury’s MFMA Circular No. 51 deals, inter alia with the implementation of the Municipal Property Rates Act, with the regulations issued by the Department of Co- operative Governance. These regulations came into effect on 1 July 2009 and prescribe the differential rate ratio for public service infrastructure, public benefit organisation and agricultural properties relative to residential properties to be 0,25:1. The implementation of these regulations was effected in the previous budget process and the Property Rates Policy of the Municipality has been amended accordingly.
The following stipulations in the Property Rates Policy are highlighted:
• The first R15 000 of the market value of a property used for residential purposes is excluded from the rateable value (Section 17(h) of the MPRA).
• 100 per cent rebate will be granted to registered indigents in terms of the municipality’s Indigent Policy where the value of the indigent property is to a maximum of R150,000 as determined for a RDP house;
• For pensioners, physically and mentally disabled persons, a maximum/total rebate of 40% will be granted to owners of rate-able property if the total gross income of the applicant and/or his/her spouse, if any, does not exceed R5,000 per month. In this regard the following stipulations are relevant:
- The rateable property concerned must be occupied only by the applicant and his/her spouse, if any, and by dependants without income;
- The applicant must submit proof of his/her age and identity and, in the case of a physically or mentally handicapped person, proof of certification by a Medical Officer of Health, also proof of the annual income from a social pension;
- The applicant’s account must be paid in full, or if not, an arrangement to pay the debt should be in place; and
- The property must be categorized as residential.
• The Municipality may award a 100 per cent grant-in-aid on the assessment rates of rate-able properties of certain classes such as registered welfare organizations, institutions or organizations performing charitable work, sports grounds used for purposes of amateur sport. The owner of such a property must apply to the Chief Financial Officer in the prescribed format for such a grant.
The categories of rate-able properties for purposes of levying rates and the proposed rates for the 2012/13 financial year based on a 11,90 per cent increase from 1 July 2013 is contained below:
Table 6: Comparison of proposed rates to levied for the 2013/14 financial year
Category Current
Tariff (1 July 2012)
Proposed tariff (from 1 July
2013)
c C
Residential properties (incl. farms & small holdings
used for residential purposes) 0,007350 0,008225
Agricultural (used for Bona-fide farming) 0,001838 0,002056
Public Service Infrastructure 0,001838 0,002056
Business, Commercial & Industrial properties (incl.
farms used for Game- / Eco Tourism) 0,018375 0,020562
Educational Institutions 0,005145 0,005757
Municipal Owned properties (Rateable, used for
residential purposes) 0,007350 0,008225
Municipal Owned (Rateable, used for non-residential
purposes) 0,018375 0,020562
Municipal Owned (Non-rateable) 0,000000 0,000000
Mining / Quarry 0,018375 0,020562
Government properties (incl. Correctional Services
Facilities, Office buildings & Hospitals) 0,018375 0,020562
Vacant land 0,022050 0,024674
Religious sites or Places of Worship 0,000000 0,000000 Special properties (e.g. Museums, Libraries) 0,000000 0,000000
Public Benefit Organisations 0,001838 0,002056
Rural Communal properties 0,000000 0,000000
1.4.2 Sale of Water and Impact of Tariff Increases
South Africa faces similar challenges with regard to water supply as it did with electricity, since demand growth outstrips supply. Consequently, National Treasury is encouraging all municipalities to carefully review the level and structure of their water tariffs to ensure:
• Water tariffs are fully cost-reflective – including the cost of maintenance and renewal of purification plants, water networks and the cost associated with reticulation expansion;
• Water tariffs are structured to protect basic levels of service and ensure the provision of free water to the poorest of the poor (indigent); and
• Water tariffs are designed to encourage efficient and sustainable consumption.
In addition National Treasury has urged all municipalities to ensure that water tariff structures are fully cost reflective by 2014.
Better maintenance of infrastructure, new dam construction and cost-reflective tariffs will ensure that the supply challenges are managed in future to ensure sustainability. Amatola Water has increased its bulk tariffs with 10.50% from 1 July 2013.
A tariff increase of 15.35% cent from 1 July 2013 for water is proposed. This is based on input cost assumptions of 10.50% increase in the cost of bulk water (Amatola Water), and the service progressing to becoming self-sufficient with at least a break-even position. In addition 6 kℓ water per 30-day period will again be granted free of charge to all indigent residents.
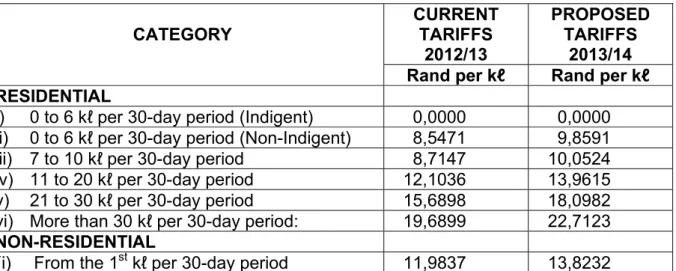
A summary of the proposed tariffs for households (residential) and non-residential are as follows:
Table 7: Proposed Water Tariffs
CATEGORY CURRENT
TARIFFS 2012/13
PROPOSED TARIFFS
2013/14
Rand per kℓ Rand per kℓ
RESIDENTIAL
(i) 0 to 6 kℓ per 30-day period (Indigent) 0,0000 0,0000 (ii) 0 to 6 kℓ per 30-day period (Non-Indigent) 8,5471 9,8591 (iii) 7 to 10 kℓ per 30-day period 8,7147 10,0524 (iv) 11 to 20 kℓ per 30-day period 12,1036 13,9615 (v) 21 to 30 kℓ per 30-day period 15,6898 18,0982 (vi) More than 30 kℓ per 30-day period: 19,6899 22,7123
NON-RESIDENTIAL
(i) From the 1st kℓ per 30-day period 11,9837 13,8232
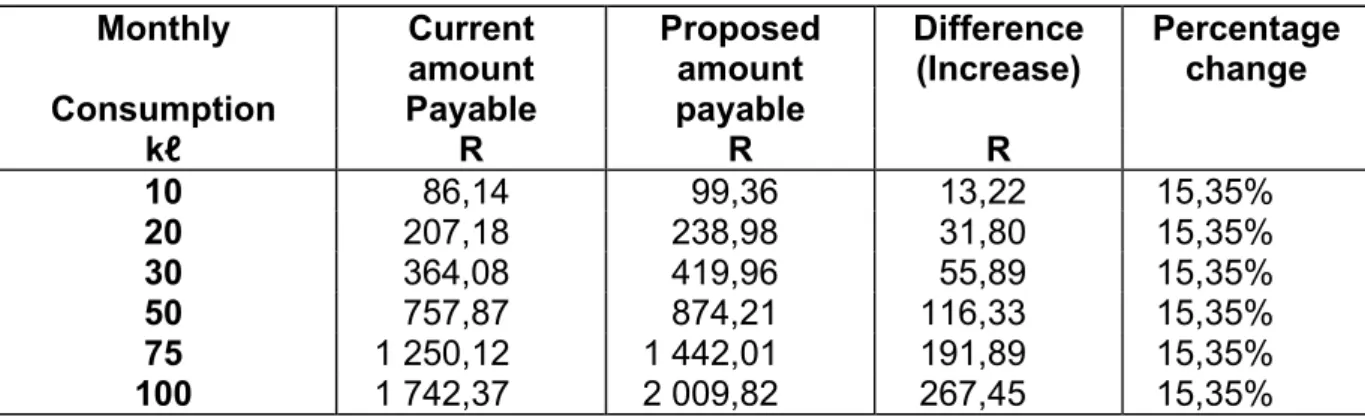
The following table shows the impact of the proposed increases in water tariffs on the water charges for a single dwelling-house:
Table 8: Comparison between current water charges and increases (Domestic) Monthly Current
amount Proposed
amount Difference
(Increase) Percentage change Consumption Payable payable
kℓ R R R
10 86,14 99,36 13,22 15,35%
20 207,18 238,98 31,80 15,35%
30 364,08 419,96 55,89 15,35%
50 757,87 874,21 116,33 15,35%
75 1 250,12 1 442,01 191,89 15,35%
100 1 742,37 2 009,82 267,45 15,35%
The tariff structure of the 2012/13 financial year has not been changed. The tariff structure is designed to charge higher levels of consumption a higher rate, steadily increasing to a rate of R22.7123 per kilolitre for consumption in excess of 30kℓ per 30 day period.
1.4.3 Sale of Electricity and Impact of Tariff Increases
On 28 February 2013 NERSA approved an average price increase of 8 per cent in Eskom’s bulk electricity tariff application. The increase to municipalities will be effective from 1 July 2013.
It should be noted that given the magnitude of the tariff increases in the recent past, it is expected that the depressed growth in electricity consumption, which is having a negative impact on the municipality’s revenue from electricity, will continue for the foreseeable future. However, it is proposed that BCMM increases its electricity tariff by 10% which is equivalent to the increase in the purchase price, plus 2% which will be ring-fenced to a specific electricity capital programme should Council approve such increase.
Registered indigents will again be granted the first 50 kWh per 30-day period free of charge, while the discounted Life-Line tariff for the second 50 kWh per 30-day period is available to all registered indigents and pensioners.
The following table shows the impact of the proposed increases in tariffs on the electricity charges for domestic customers:
Table 9: Comparison between current electricity charges and increases (Domestic)
Monthly Current amount Proposed amount Difference Percentage change Consumption Payable payable (Increase)
kWh R R R
100 134,43 147,87 13,44 10,00%
250 336,08 369,68 33,60 10,00%
500 672,15 739,35 67,20 10,00%
750 1 008,23 1 109,03 100,80 10,00%
1 000 1 344,30 1 478,70 134,40 10,00%
2 000 2 688,60 2 957,40 268,80 10,00%
For purposes of the MTREF Budget, the electricity tariff structure has been left unchanged. The inadequate electricity bulk capacity and the impact on service delivery and development remains a challenge for the City. Most of the suburbs and inner city reticulation network was designed or strengthened in the early 1980’s with an expected 20-25 year life-expectancy. The upgrading of the City’s electricity network has therefore become a strategic priority, especially the substations and transmission lines.
The approved budget for the Electricity Division can only be utilised for certain committed upgrade projects and to strengthen critical infrastructure (e.g. substations without back-up supply).
Owing to the high increases in Eskom’s bulk tariffs, it is clearly not possible to fund these necessary upgrades through increases in the municipal electricity tariff – as the resultant tariff increases would be unaffordable for the consumers. As part of the 2013/14 medium-
term capital programme, funding has been allocated to electricity infrastructure but these funding levels will require further investigation as part of the next budget cycle in an attempt to source more funding to ensure this risk is mitigated.
1.4.4 Sanitation and Impact of Tariff Increases
A tariff increase of 10.90 per cent for sanitation from 1 July 2013 is proposed. Currently sanitation charges are calculated according to the relative size of the erf on which the property is located. It is envisaged that future sanitation charges will be based on a percentage of water consumption, but first the large volumes of water losses will have to be brought under control.
The following table shows the impact of the proposed increases in annual tariffs on the sanitation charges for a single dwelling residence:
Table 10: Comparison between current sanitation charges and increases, single dwelling- residence (per annum)
Category Current
amount Proposed
amount Difference Percentage
Payable payable (Increase) Change
R R R
Erf : 0 – 300m2 623,00 691,00 68,00 10,9%
Erf : 301 – 400m2 991,00 1 099,00 108,00 10,9%
Flat : Complex 1 570,00 1 741,00 171,00 10,9%
Flat : Ordinary 1 734,00 1 923,00 189,00 10,9%
Flat : Semi 1 734,00 1 923,00 189,00 10,9%
Cluster/Town Houses 2 146,00 2 380,00 234,00 10,9%
Erf : 401 – 800m2 2 579,00 2 860,00 281,00 10,9%
Erf : 801 – 1200m2 2 784,00 3 087,00 303,00 10,9%
Erf : > 1200m2 3 033,00 3 364,00 331,00 10,9%
1.4.5 Waste Removal and Impact of Tariff Increases
It is widely accepted that the rendering of this service should at least break even, which is currently not the case. The City will have to implement a solid waste strategy to ensure that this service can be rendered in a sustainable manner over the medium to long-term.
The main contributors to this deficit are repairs and maintenance on vehicles, increases in general expenditure such as petrol and diesel and the cost of remuneration.
A 12.90 per cent increase in the waste removal tariff is proposed from 1 July 2013. Higher increases will not be viable in 2013/14 owing to the overall impact of higher than inflation increases of other services. Any increase higher than 12.90 per cent would be counter- productive and will result in affordability challenges for individual rates payers raising the risk associated with bad debt.
The following table compares current and proposed amounts payable from 1 July 2013:
Table 11: Comparison between current waste removal fees and increases
Category
Current amount
Proposed
amount Difference
Percentage
Payable payable (Increase) Change
R R R
Domestic: Weekly 2 x 85ℓ
load 140,00 158,00 18,00 12,9%
85ℓ Bins – Twice weekly
240ℓ Bins – Once weekly 317,00
446,00 358,00
504,00 41,00
58,00 12,9%
12,9%
240ℓ Bins – Twice weekly
420ℓ Bins – Once weekly 893,00
780,00 1 008,00
881,00 115,00
101,00 12,9%
12,9%
420ℓ Bins – Twice weekly 1 560,00 1 761,00 201,00 12,9%
1.1m3 Sprico – Once
weekly 535,00 604,00 69,00 12,9%
1.1m3 Sprico – Twice
weekly 1 066,00 1 204,00 138,00 12,9%
1.1m3 Sprico – Three x a
week 1 603,00 1 810,00 207,00 12,9%
1.1m3 Sprico – Four x a
week 2 133,00 2 408,00 275,00 12,9%
1.1m3 Sprico – Five x a
week 2 666,00 3 010,00 344,00 12,9%
1.4.6 Overall impact of tariff increases on households
The following table shows the overall expected impact of the tariff increases on a large and small household, as well as an indigent household receiving free basic services.
Note that in all instances the overall impact of the tariff increases on household’s bills has been kept at an average of 12% .
The categories of rate-able properties for purposes of levying rates and the proposed rates for the 2013/14 financial year based on a 11,9% increase from 1 July 2013 is contained below:
Table 12 - SA14 – Household bills
1.5 OPERATING EXPENDITURE FRAMEWORK
The City’s expenditure framework for the 2013/14 budget and MTREF is informed by Section 18 and 19 of the MFMA.
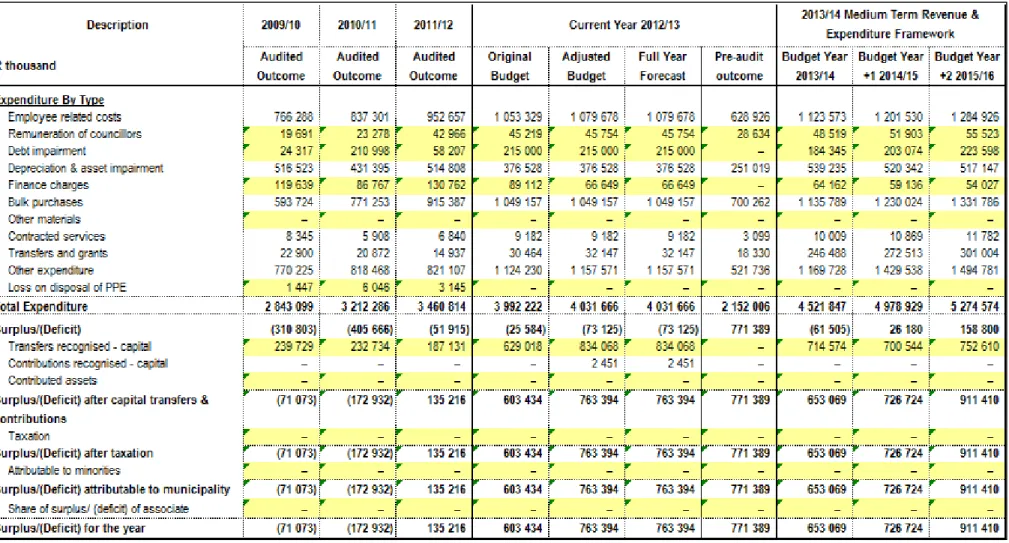
The following table is a high level summary of the 2013/14 budget and MTREF (classified per main type of operating expenditure):
Table 13: A4 - Summary of operating expenditure by standard classification item
The budgeted allocation for employee related costs for the 2013/14 financial year totals R1,12 billion, which equals 25% of the total operating expenditure. Based on average CPIX plus 1.5%, salary increases have been factored into this budget at a percentage increase of 6.85% for the 2013/14 financial year.
Remuneration of councillors is determined by the Minister of Cooperative Governance and Traditional Affairs in accordance with the Remuneration of Public Office Bearers Act, 1998 (Act 20 of 1998). The most recent proclamation in this regard has been taken into account in compiling the City’s budget.
The provision of debt impairment has been determined based on an annual collection rate. For the 2013/14 financial year this amounts to R184 million and escalates to R223 million by 2015/16. While this expenditure is considered to be a non-cash flow item, it informed the total cost associated with rendering the services of the municipality, as well as the municipality’s realistically anticipated revenues.
Provision for depreciation and asset impairment is widely considered a proxy for the measurement of the rate asset consumption. Budget appropriations in this regard total R539 million for the 2013/14 financial and equates to 12% of the total operating expenditure. The implementation of GRAP 17 accounting standard has meant bringing a range of assets previously not included in the assets register onto the register. This has resulted in a significant increase in depreciation relative to previous years.
Finance charges consist primarily of the repayment of interest on long-term borrowing (cost of capital). Finance charges make up 1% (R64 million) of operating expenditure excluding annual redemption for 2013/14.
Bulk purchases are directly informed by the purchase of electricity from Eskom and water from Amatola Water. The annual price increases have been factored into the budget appropriations and directly inform the revenue provisions.
Other expenditure comprises of various line items relating to the daily operations of the municipality. No increase has been made to the general expenses, except for Fuel, which is 7.5% and Operational Leases which are informed by the Agreements
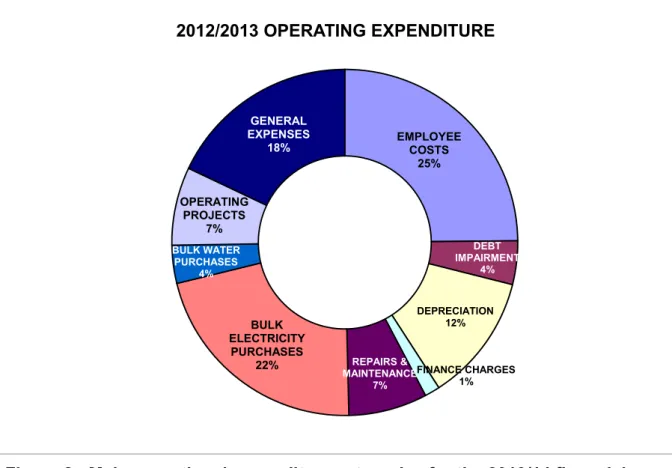
The following figure gives a breakdown of the main expenditure categories for the 2013/14 financial year:
Figure 2: Main operational expenditure categories for the 2013/14 financial year 1.5.1 Repairs and Maintenance
Repairs and maintenance budget is currently 7% of the total Operating Expenditure Budget. The City is striving towards a 10% repairs and maintenance of its total operating budget owing to the aging of the City’s infrastructure and historic deferred maintenance.
EMPLOYEE COSTS
25%
DEBT IMPAIRMENT
4%
DEPRECIATION 12%
FINANCE CHARGES 1%
REPAIRS &
MAINTENANCE 7%
BULK ELECTRICITY
PURCHASES 22%
BULK WATER PURCHASES
4%
OPERATING PROJECTS
7%
GENERAL EXPENSES
18%
2012/2013 OPERATING EXPENDITURE