CONTRIBUTION OF SMALL SCALE POULTRY FARMING IN BANGLADESH
BY
MD. ABDUL HANNAN
REGISTRATION NO. 27557/0072 1
A Thesis
Submitted to the Faculty of' Agriculture, Sher-e-Bangla Agricultural University, I)haka,
in partial fulfillment oithe requirements for the degree of
MASTER OF SCIENCE IN
AGRICULTURAL EXTENSION AND INFORMATION SYSTEM SEMESTER: IJANUARY-JUNE, 2007
Approved by:
1 ~ Ll
llc~"(Prof. Mohammad Hossain Bhuiyan) (Md. Mufainl Hossain)
Supervisor Co-Supervisor
... :~ q
(Prof. Md. Shadat Ulla) Chutiati
I xani i nation Col1)l)) ittec
j
This is to certify that thesis entitled
"CONTRIBUTION OF SMALL SCALE POULTRY FARMING IN BANGLADESH"submitted to the Faculty of Agriculture. Sher-e-Bangla Agricultural University, Dhaka, in partial fulfillment of the requirements for the degree of
MASTER OF SCIENCE IN AGRICULTURAL EXTENSION AND INFORMATION SYSTEM,embodies the result of a piece of hona fide research work carried out by Md. Abdul Hannan, Registration No. 27557/00721 under my supervision and guidance. No part of the thesis has been submitted for any other degree or diploma.
I further certify that such help or source of information, as has been availed of during the course of this investigation has duly been acknowledged.
Dated: 7 - 2-.
Dhaka, Bangladesh. ---'-
(Prof. Mohammad Hossain Bhuiyan)
Supervisor
Dedicated to My
Beloved Parents
ABBREVIATIONS AND ACRONYMS
BAU =Bangladesh Agricultural University BBS
=
Bangladesh Bureau of Statistics BCR =Beneflt Cost Ratiocm =Centimeter
ULS =Directorate of Livestock Services
e.g =For Example
eta! =Rt alia (and others)
etc =etcetra
FFYP =Fifth Five-Year Plan GDP =Gross Domestic Product
grn =Grain
COB =Government of Bangladesh HSC =Higher Secondary Certificate
ha =Hectare
i.e. =That is
kg =Kilogram
mt =Million ton
MS =Master of Science
No. =Number
11000" TK =Thousand Taka
A CKJVO rJ'LEI) GEMENT
All praises and appreciatios are to Almight' Allah for his endless niercY with whose blessings the author has been able to complete this work.
The author likes to express his deepest SenSe of grant ia/c, Si/ice/c appreciation and immense indebtedness to his thesis supcn'isor Professor Mohammed Hossain 13/iuivan Dept. ojAgricult urn! IL.vtens an? uiid /iifonnuuioii .Svste,n, £4 IL Dhakafbr his scholastic/nobel guidance, valuable suggestions, continuous encouragement and all kind of support and lie/p t/iroug/iouI the period of research work and alsoin the preparation a/manuscript.
The author also expresses his appreciation, gratitude and hear/f lell thanks to his co-supervisor Md. Mujazzal Hossain, Assistant Professor Dept of Animal husbandry, £4 U, Dhaka.. lie inspired the author to undertake such as a study and assisted the author to build the fbundation of i/ic research project. He provided creative suggestions, proper guidelines, helpful comineilts (1)1(1 cordial co-operations throughout the period of this research it'ork.
The author also grateful to the Chairman and all other respected teachers of 'Department of the Agricultural Extension & lnjbrmation System ' for their valuable instructions and encouragement c throng/iout the course stud,v. Deep sense of gratitude and profOund regards are also expressed to oihr respectable teachers from others for proving proper guidelines and suggestions. wine/i were helpful in developing the research stzu/v.
The author is aiw grateful to the farinet's who inatiaged themselves to give their valuable time during interviews for the collection of data.
The author is deeply v indebted to his beloved father and inot her whose suer ftIce, inspiration and encourageluient paved the way for his higher education. The author also indebted to his brothers and sister/br their cons/aut inspiration and moral supports.
The Author
CONTEN1'S
PAGE
LIST OF ABBREVIATIONS AND ACRONYMS I
ACKNOWLEDGEMENT II
LIST OF CONTENTS III
LIST OF TABLES VII
LIST OF FIGURES VII
LIST OF APPENDICES VIII
ABSTRACT IX
CHAPTER 1 INTRODUCTION
1.1 General background
1.2 Importance and Scope of Small Scale Poultry 3
1.3 Justification of the Study 5
1.4 Objectives of the Study 6
1.5 Limitation of' the study 7
1.6 Assumption olthe study 8
1.7 Statement of the hypothesis 9
1.8 Definition of terms 10
CHAPTER 11 REVIEW OF LITERATURE 14
CHAPTER 111 METHODOLOGY
3.1 Locate of the study 24
3.2 Population and Sampling procedure 27
3.3 Preparation of interview schedule 27
3.4 Period of data collection 28
3.5 Variables of the study 28
3.5.1 Measurement of Independent variables 29
3.5.1.1 Age 29
3.5.1.2 Education 29
3.5.1.3 Family size 29
3.5.1.4 Farm size 29
3.5.1.5 Annual income 30
3.5.1.6 Cosmopoliteness 31
3.5.1.7 Poultry farming knowledge 32
3.5.1.8 Training 32
3.5.2 Measurement of dependent variables 32 3.5.2.1 Simple profitability analysis 32
3.5.2.2 Gross margin analysis 33
3.5.2.3 Net return analysis 33
3.5.2.4 Production functional analysis 35 3.6 Procedure for computation costs and returns 37
3.7 Measurement of problem 39
3.8 Methods of data collection 39
3.9 Compilation of data 40
3.10 Analysis of data 40
.Iv
CHAPTER IV RESULTS AND DISCUSSION
4.1 Socio-econornic characteristics of pouhry producer 41
4.1.1 Age 42
4.1.2 Education 43
4.1.3 Family size 44
4.1.4 Farm size 45
4.1.5 Annual income 45
41.6 Cosmopoliteness 47
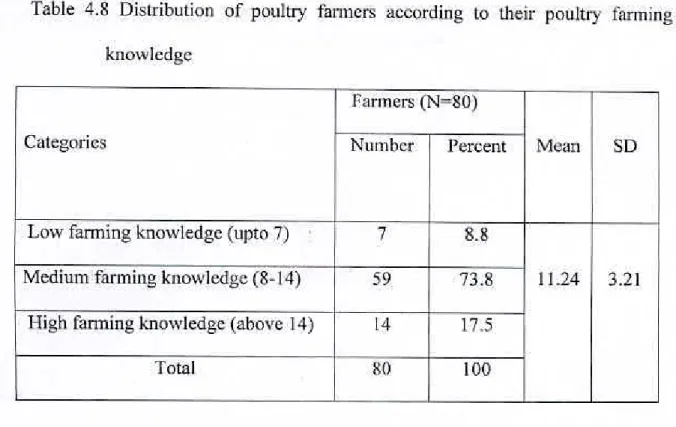
4.1.7 Farming knowledge 48
4.1.8 Training 49
4.1.9 Annual expense . 50
4.2 Profit 50
4.3 Relationship between profitability aismall-scale poultry and
soeio- economic characteristics 51
4.3.1 Relationship between age of small-scale poultry farmers and
their profit 53
4.3.2 Relationship between educations of small-scale poultry Farmers
and their profit 53
4.3.3 Relationship between family sizes of small-scale poultry farmers
and their profit 54
4.3.4 Relationship between farm sizes of small-scale poultry farmers
and their profit 55
4.3.5 Relationship between annual incomes of small-scale poultry farmers
and their profit 56
V
4.3.6 Relationship between cosmopoliteness of small-scale poultry farmers
and their profit 56
4.3.7 Relationship between farming knowledge of small-scale poultry farmers
and their profit 57
4.3.8 Relationship between training ofsmall-scale poultry farmers and
their profit 58
4.3.9 Relationship between annual expenses of small-scale poultry thrmers
and their profit 58
4.4 Problem and suggestions of poultry farming 59
CHAPTER V
SUMMERY, CONCLUSION & RECOMMENDATION
5.1 Summary 68
5.2 Major finding of the study 69
5.3 Conclusions and Recommendations 73
5.4 Recommendations 75
REFERENCES 76
APPENDIX A 82
APPENDIX B 89
VI
LEST OF TABLES TABLES
SL. NO. Title Page No.
4.1 Salient features of the characteristics of pouhrv farmers 41 4.2 Distribution of poultry fttrmcrs according to their age 42 4.3 Distribution of poultry farmers according to their education 43 4.4 Distribution olpoultry farmers according to their family size 44 4.5 Distribution of poultry farmers according to their farm size 45 4.6 Distribution of poultry farmers according to their annual income 46 4.7 Distribution of poultry farmers according to their cosmopoliteness 47 4.8 Distribution of poultry farmers according to their farming knowledge 48 4.9 Distribution of poultry farmers according to their training 49 4.10 Distribution of poultry farmers according to their annual expense 50 4.11 Distribution of poultry farmers according to their profit 51 4.12 Co-efficient of correlation showing relationship between the
characteristics of poultry farmers and their ihrm profit 52 4.13 Problem and constrains in raising poultry birds 63
LIST OF FIGURES
SL. NO. Title
3.1 A map of Dhaka district showing Savar ljpazilla 25 3.2 A map of Savar Upazilla showing Banagram union 26
VII
LIST OF APPENDIX
APPENDIX
A An English version of the interview schedule 82
B Correlation matrix showing interrelationship
among the variable 19
VIII
CONTRIBUTION OF SMALL SCALE POULTRY FARMING IN BANGLADESH
ABSTRACT
The study was undertaken to investigate the socioeconomic characteristics of poultry farm owners and to assess the relative profitability of broiler and layer poultry farms and to determine the contributions of key variables to the production process of the farms. In total. 80 poultry fan'tm. 40 from each of the selected broiler and layer poultry Rirms were selected randomly in Savar ljpazilla of Dhaka district. Data was collected during 10 July to 10 August 2007 with the help of Interview schedule. Coefficient of coiTciation was used in artier to analyze data in accordance with the objectives. To achieve the main objective of the study, a simple tabular analysis and the cost and return analysis were done. Cobb-Douglas production function model was also employed to estiniatc the contributions of the key variables: feed, human labour, vaccine and medicine, electricity to the production of poultry farms. The study revealed that on an average the total costs per poultry farm per year were Tk 2. 88,581.00 and 3. 24,661.00 for broiler and layer farm, respectively. The yearly gross returns from per broiler thrni were Tk 3, 54,093.00 and from per layer poultry farm were Tk. 4. 64,971.00 having net returns were Tk 65,512.00 and Tk 1, 40310.00. respectively. This implies that layer poultry farm was more profitable than broiler poultry farm. Correlation analysis shows that level of education. farm size, annual family income.
Cosmopoliteness. poultry farming knowledge, training and annual expense had significant relationship with their Farm profit. However, age and family size of the poultry farmers had no signiheant relationship with their farm profit. This study also revealed that sample poultry (lirni owners Riced some important problems, such as: capital and credit constraints. high prices of feed, frequent occurrence of diseases, inadequacy of veterinary care and services, non-availability of chicks, low market price of products and pollution of environment made by chicks. If steps were taken to solve these problems, the owners of both broiler and layer poultry farms could earn much higher profits than the existing level.
ix
Chapter 1
Introduction
CHAPTER 1
INTRODUCTION
ofoJ 1.1 General Background
Poultry in Bangladesh, as an emerging sub-sector of livestock, play a pivotal role in her economic development by providing employment to different sections of people. In addition to combat the challenges of inadequate nutrition at home, poultry industry in Bangladesh is also trying to earn a good deal of foreign exchange by exploring export possibilities. This industry, aLong with the other relevant sectors of agriculture, has committed to the nation to supply the cheapest sources of prime quality of animal proteins (meat and eggs) in the diet of people.
Though the expansion and development ol' this industry is remarkable in the recent years, particularly in commercial sector, there is still a big gap between the demand and the supply of animal protein.
Chicken meat, unlike beef, is acceptable to all sectors of people irrespective caste
and religion. Poultry sector contributes about 37% of the total animal protein
supplied in Bangladesh (Ahmed & Islam. 1990). Bangladesh is a densely
populated country and per capita land is 0.089 hectare (BBS, 1998). Due to the
limited availability of grazing land and poor tinancial condition the scope for
development of livestock industries of large animals is limited here. Therefore, the poultry, more especially small-scale poultry farming has good opportunity to increase rapidly day by day.
There are about 160 million chickens and 36 million ducks in Bangladesh (Ahmmad, 2005). Commercial poultry production is increasing day by day still then about 70% of chicken and 80% to 8511
/oof clucks raised by small and landless farmers in rural Bangladesh (Fluque, 2003). Maximum people of Bangladesh live in substandard and poor condition. Their per capita incomc is 463 VS $ per annum (BBS, 2005). They have no huge capital to build up a large-scale poultry
farm. The traditional scavenging poultry rearing, most popularly known as familypoultry production, which is still popular to the rural poor and a section of urban people due to less financial involvement. Among the poultry species, chicken population is dominant over others, covering almost 90 per cent followed by duck (8 per cent) and a small numbers of pigeons. geese and quails. Almost each rural family usually keeps 10-20 chicken, duck or pigeon that are traditionally maintained by the female members of the family, fed on household wastes and crop residues (Saleque. 2001; Rahman, 2003). Commercial poultry !ärrning, mainly small-scale poultry lhrming has recently emerged in different areas of the country because of the market demands of poultry meat and eggs.
In our country poultry farming have a bright prospect because we have a large and ready market for meat and egg and also have a favorable environment to raising
7
poultry. Our landless and sinail fanner can easily start small-scale poultry farming because it requires small capital. If we can produce enough milk, meat and egg then we can fulfill our demand and we can cxport those items to other countries.
1.2 Importance and Scope of small-scale poultry
Poultry rearing is considered as a highly viable sector for generation of employment and income
forthe landless, unemployed youths and destitute women. Poultry farming, unlike crops, is not seasonal. People in this country raise poultry mainly with a view to getting meat, egg to fulfill their day-to-day consumption. Income from sale proceeds also helps them to satisfy their various financial needs.
Rural poultry, particularly chicken and duck production play a significant role in
the soeio-cconomic development of Bangladesh. Almost 90% rural titmily keeps a
small number of indigenous chicken and duck tinder traditional scavenging
system. (Masuda, 2006). The main liaiure of the small-scale poultry production
system is low-input quick return. Poor lhrmers, who could not afford to keep large
animals because of big investment, can easily maintain a few chickens or ducks
within their homestead premises. It is believed that the contribution of scavenging
fowl and duck in terms of supplying meat and eggs in country is more than the
large commercial poultry. Rural women and children that generate cash income
for the family in addition to supplying adequate eggs and meat to family's diet as
the cheapest source of animal protein generally maintain poultry birds. Small-scale
chicken generally scavenges around the homestead areas at daytime where they cat kitchen wastes, leftover cereal grains like rice, wheat, pulse, green grasses and oilier feedstuffs. The birds to produce good quality animal protein instead of being wasted utilize these feedstuffs. Therefore, rural small-scale poultry keeping is found suitable for the poor farmers in Bangladesh, like some other developing countries to provide animal protein and cash income for rural women, Landless poor or marginal farmers.
it may be noted that small-scale commercial Poultry farming based on imported hybrid strain expanded in the country over the last seven to ten years. These small holders have a great contribution to the economy of the country (Sharaban, 2004).
It has created the employment opportunity for disguised and unemployed people.
Balanced food is an important factor for normal growth and mental development for human body. Animal proteins such as meat, fish, milk, egg etc., are essential for balanced food. According to WHO (2001), 55 gm animal protein is required per person per day but we are getting only 7.6 gilt According to the report of GOB (1999), average per capita availability of meat is 13 gm per day and egg is 0.06 (no.) per day whereas per capita requirement of meat is 120 gm per day and eggs is 0.28 (no.) per day. To reduce the gap between demand and supply of animal protein, can play very significant role.
Poultry meat and eggs are used chiefly as human food. Poultry meat alone contributes 37 per cent of the total meat production in the country. Poultry
4 rt.
contributes about 22 to 27 per cent of the total animal protein supply in the country (Bhuyan, 1999).
Approximately 70 per cent people are suffering from malnutrition and about 81 per cent families do not have their calorie requirements. in addition to these, about 60 per cent families of Bangladesh cannot meet their protein requirement in their daily food consumption. Therefore poultry, especially small-scale poultry fanning can play vital role to fulfill the nutritional deficiency in human body.
1.3 Justification of the study
Population pressure in Bangladesh is forcing marginal lands to be brought under cultivation, leaving practically little land exclusively for grazing of animals.
Ilence, the possibility
ofexpansion of livestock farming is very limited in this country. Poultry however, have a shorter lii ë cycle and their production requires less land and capital compared to other meat-producing animals such as cattle, sheep goat, etc. It should also be noted that crop cultivation in Bangladesh is subject to a high degree of risk and uncertainty and provides seasonal irregular and uncertain income to the farmers. Our consumption of non-cereal foods are among the lowest in the world and therefore, needs more production of eggs, meat, milk, etc., to get a satisfactory level
ofbalanced diet as well as cash income.
Since the majority of people irrespective
ofcaste/religion, prefer chickens and eggs, its demand is very high and the prices has gone up. As a result, a tendency to
5
initiate small-scale commercial poultry farming is observed both in rural and urban areas.
Maximum farmers of our country are poor. They are interested to set up small- scale poultry farm due to less financial investment. This type of poultry also contributes a lot to meet up our protein requirement as well as our empLoyment opportunity. But small-scale poultry farming is negligible in our country. So, this type of fanning should be evaluated keeping this view in mind present study was taken.
1.4 Objectives of the study
The overall objective of this research is to investigate various socioeconomic aspects of small-scale poultry farming in selected areas of' the country. The
followings are specific objectives of the study:
I. To identif3' and describe some major socioeconomic characteristics of poultry farmers. The socioeconomic characteristics are age, education, family size. thrm size, annul income, cosniopoliteness, farming knowledge, training and annual expense.
11. To determine the profitability of the small poultry farms.
Ill. To explore relationship between profitability of small-scale poultry farm and socioeconomic characteristics.
rol
IV. To identify the major problems facing by the farmers in conducting poultry business and suggest policy implication based on the findings.
1.5 Limitation of the study
Almost all research studies have some limitations in terms of time, money and personnel. The present study is not an exception to that. l)espite the care taken to make this study more meaningful, there are still some limitations, - which are highlighted below:
The researcher had to vork with limited samples because of the constraints of time and funds. A large sample might have strengthened the findings.
The farmers of Bangladesh do not keep any farm records of their farm business. So the data supplied by them in this study were from their memories. So, the accuracy of the data depends upon their sincerity and memories. As a result the probability of data errors cannot be ignored.
The profitability analysis of poultry farms was done using constant input-output price relationship, which may he changed over time. This may also change the results, but the broad conclusions drawn from the present study is expected to remain unchanged.
7
iv. The findings of the study are based on data from a very small area of Bangladesh. So to draw any general conclusion on the basis of the results should deserve special caution and care for the country as a whole.
1.6 Assumption of the study
"An assumption is the supposition that an apparent fact or principle is true in the light of available evidence" (Goode and HaLt, 1952). The researcher had the following assumptions in mind while undertaking this study:
The respondent included in the sample was capable of providing proper answer to the question in the interview schedule.
The researcher who acted as interviewer was adjusted to social and environment condition of the study area. hence the data collected by him and the respondents were free from bias.
Views and opinions furnished by farmers included in the sample were representative views and opinion of the whole population of the study.
The response fhrnished by the respondents were reliable i.e. they expressed the truth about their conviction and opinions.
The respondents were more or less conscious about poultry farming.
o The findings of the study will have general application to other part of the country with similar. socio-economic, cultural and agro- ecological conditions of the study area.
1.7 Statement of the hypothesis
The following hypothesis was formulated to test the relationship between the selected characteristics of the poultry farmers and their profit.
Research hypothesis:
There is relationship between age. education, Ibmily size, farm
size,
annual income, cosmopoliteness, fanning knowledge, training, annual expense of the poultry farmers and their profit.For testing the hypothesis statistically, the following null hypothesis were formulated:
There is no relationship between age of the poultry farmers and their profit.
There is no relationship between education of the poultry ihrmers and their profit.
There is no relationship between family size of the poultry farmers and their profit.
There is no relationship between farm size of the poultry farmers and their profit.
9
V. There is no relationship between annual income of the poultry farmers and their profit.
There is no relationship between cosinopolteness of the poultry farmers and their profit.
There is no relationship between (lirming knowledge of the poultry farmers and their profit.
vli. There is no relationship between training of the poultry farmers and their profit.
ix. There is no relationship between annual expense of the poultry farmers and their profit.
1.8 Definition of related terms:
For clarity of understanding, certain terms used throughout the study are defined as follows:
Farmers: The persons who were involved in farming activities are called farmers.
They participated in different farm and community level activities like crops, livestock, fisheries, and other fanning activities. In this study the owners of small- scale poultry farms were considered as a ibrm.
10
Age: It means the age of a farmer that will refers to the period of time from his birth to the time of investigation. In this study age refers to the period of time from the birth of a poultry farmer to the time of face-to-face interview with him.
Education: Education of an individual poultry farmer was defined as the formal education received up to a certain level from an cdueational institute. (e.g. School, College and University)
Family size: Family size refers to the total number of members of a poultry farm family including the respondent himself, his spouse. children and other dependent, who live and eat together in a family unit.
Farm size: Farm size refers to the total area on which a poultry farm lärnily carries on farming operations, the area being estimated in terms of full benefit to the farmer's family.
Annual income: It means the total earning by a poultry fanner the respondents himself and the members of his family from agriculture and other sources during a year. It is expressed in taka.
Training exposure: It refers to the total number of days attended by a poultry farmer in his life to the various agricultural subject matter. Respondent received shortllong term training in his entire life tip to the date of interviewing as provided by different organizations is considcrcd for this variable.
Cosmopoliteness: Cosmopoliteness is the degree which express extends of poultry farmers external orientation.
Respondents: People who have answered questions by an interviewer for a social
survey. The), are the people from whom a social research worker usually gets most data required for his research. in this study poultry farmers were the respondents.
Problem faced: The term 'problem faced' refers to dilièrent problems faced by the farmers at the time of operating different activities.
Variable: A general indication in statistical research of characteristics that occurs
in a number of individuals, objects, groups etc. and that can take on various values, for example the age of individual.
Assumption: An assumption is "'l'he supposition that an apparent thct or principle
is true in the light of the available evidence'.
Hypothesis: Defined by Goode and Halt (1952), a proposition this can be put to a test to determine its validity". It may seem contrary to or in accord with common sense. However, it leads to an empirical test.
Null hypothesis: The hypothesis, which we pick for statistical test, is null
hypothesis (Fl0). In this study null hypothesis is stated that there is no relationship between the concerned variables.
Statistical test: A body of rules that help to take decision regarding accepting or
rejection of the hypothesis is defined as test. In this study ira
jitillhypothesis is rejected it is assumed that there is a relationship between the variables.
12
Chapter 2
Review of literature
CHAPTER 11
REVIEW OF LITERATURE
The purpose of this chapter is to provide a review of some previous research works, which are related to the present study. Although a good number of researches have been done in the poultry sector; it was found that only a limited number of works related were conducted in Bangladesh. However. the most relevant studies are reviewed:
Anonymous (1981) conducted a study at Daribhabakhali two miles away from the
Bangladesh Agricultural University Campus. 'Ihe study showed that the share of poultry in the total income of farm families was only 4.22 percent but 83.00 percent farming families were interested to raise poultry production.
Vasmin
a
at (1989) studied on characteristics of backyard poultry farmersaffecting their knowledge on poultry production in Bangladesh. Findings of the
study indicated that 17 percent farmers had low knowledge compared to 70
percent medium and 13 percent high. Statistical test showed that education, family
size, occupation, number of birds and extension contract of the farmers had a
positive and significant relationship with their knowledge on poultry production.
However, farm size was negatively significant and age and income of farmers had no significant relationship with their knowledge on poultry production.
Miah (1990) conducted a study on small-scale poultry farms in Savar areas. The purpose of the study was to gain information about the profitability of small-scale commercial poultry farming. The average earning in birds in small and medium farms was 589 and 3139, respectively. The average number of birds in small and medium farms was Tk 1, 36,788.00 and 5, 67,304.00, respectively. The small and medium farms on an average annually earned •Fk 3. 08379.00 and 14. 80.302.00, respectively. He found that the profitability of small-scale commercial poultry farming was positively co-related to the sizes of individual farms. The study also revealed that profitability of poultry farming depends on the sizes of individual farms.
Ukill and Paul (1992) conducted a study on problems and prospects of broiler industry in Chittagong Region. They found that non-availability of chicks, prevention and control of diseases, predators, lack of balanced feed, housing lighting and fluctuations of market were the basic problems of broiler poultry farming. They also showed that 88 per cent profit within a year by broiler farming.
Haque (1992) presented a paper on Itural poultry in Bangladesh economy" of Fourth National Conferences of Bangladesh Animal Husbandry Association. He
14
employed cost benefit analysis on 500 layers and 500 broilers, Ftc found that the profit of layer farm was TIC 1,05,876.00 and broilers' farm was TIC 37,146.00.
Paul et al. (1992) conducted a study on the profitability of layer poultry farm in Savar areas. The purpose of the study was to gain information about the profitability of small-scale commercial poultry farming. The average numbers of birds in small, medium and large farms were 100. 200 and 300. respectively. The average annual cost per small, medium and large farms were TIC 53,800.00, TIC 1,06380.00 and TIC 1.53.800.00. respectively. The small, rncdiuni and large farms on an average annually earned TIC 72,000.00. 'l'k 1,44,000.00 and TIC 2.16,200.00, respectively. They ibund that the profitability of small-scale commercial poultry farming was positively co-related to the sizes of individual farms.
AU (1993) conducted a study on the profitability of small-scale egg producing poultry farm in the Dhaka City in Bangladesh. In total 30 poultry farms in which 16 were small and 14 medium were selected, which were mainly egg producing poultry farms. The average number of birds in small farms was 61 while it was 178 in medium farms. The average egg production per year was 268 and 260 per hen in small and medium farms, respectively. The study also noted that poultry owners earned annually net return 1121,301.00 in small farm and 'Uk 6,731.00 in medium farm on the basis of cash cost. On the basis ot' full cost poultry owners
15
earned annually net return Tk 12,135.00 in small farm and Tk 51,556.00 in medium farm.
Islam (1995) conducted a study on economic analysis of poultry !hrnis of different sizes in some selected areas of Dhaka City. He found that the relative profitability of small, medium and large poultry farms. The study revealed that total costs per poultry birds per year were Tk 406.17. Tk 373.86 and 1k 347.54 for small, medium and large fanns, respectively. On the other hand, the average gross returns per poultry bird per year stood Tk 614015 for a small farm. Tk 599.67 for a medium and 1k 351.69 for a large farm.
Kitsopanidis, clot (1996) studied the effects of the most important factors on the profitability of the poultry farming in Greece. The most important factors for poultry meat production were mortality and age of Final Live Weight (FLW) of broilers, because they affected the total feed consumed and the total FLW of broilers achieved. Analysis of these factors showed that an increase of mortality from 2.5 to 10.0 per cent and the age of FLW of broilers from 53 to 62 days led to a decrease in the profitability by 96.7 and 77.1 per cent, respectively.
Hasan (1997) examined the relative profitability of poultry rearing under the supervision of selected four difiCrent categories of farms under the supervision of Bangladesh Rural Advancement Cobmittec (BRAC) in the Mirpur thana of Kustia
16
District. In total 72 samples of BRAC members were selected randomly. Out of which 20 from Model Rearer, 10 from Chick Rearer and 10 from Mini Ilatcherer, 10 from egg and poultry bird Collector, 2 from Aratdar and 10 from Retailer. The study revealed that on an average the total cost per poultry fhn per year was Tk 1,367.65, 6259.13. and 46,703.75 for key Rearer, Model Rearer, Chick Rearer and Mini Hatcherer respectively. The gross returns and net returns peir poultry farm per year were Tk 6,533.25 and Tk 5,165.00. 1k 1,7150.00 and Tk 10.899.27, Tk 42,996.50 and 18,437.74, 1k 92,611.20 and 45,907.45 for key Rearer, Model Rearer,, Chick Rearer and Mini 1-latcherer. respectively. The annual net return was the highest for the Mini Hatcherer but the net return per taka invested was the highest for the key Rearer.
Sarker (1998) conducted a study to know the existing poultry production, management and product utilization policy of the farmers in two northern districts of Bangladesh during February-March. 1997. The linding of the study showed that on an average number of egg production of breed Fayoumi, \Vhite Leghorn.
Rhode Island Red, Australorp, Native Chicken and Duck were 140, 136, 111, 123, 51 and 58 per year, respectively. It was found that only 6 percent fanners used poultry vaccine regularly and 52 per cent farmers quite irregularly. Predator animals, non-availability of balanced ration and improved breeds were identified as the most important problems of poultry production in the northern part of Bangladesh.
17
Zebunnesa (1998) in her study revealed that the average annual income per household from poultry, dairy and sericulture groups were Tk. 23,388.40. Tk.
31,881.97 and Tk. 32,607.18 respectively. She estimated that total variable costs of poultry, dairy and sericulture were Tk. 32,979.00. 15,790.80 and Tk. 5,175.21 respectively. Annual gross margin obtained from poultry, dairy, and sericulture were 1k. 8,529.00, 13,992.00 and Tk. 15.642.00 respectively.
Bhuiyan (1999) studied the socio-cconomic characteristics olpoultry farm owners and assessed the relative profitability of broiler and layer poultry farms. He worked on a total of 60 poultry farms taking 30 broiler farms and 30 layer farms from the Kotwali lipazilla of Mymensingh district. The study revealed that on an average, the total costs per poultry farm per year were Tk 2,99,482 and 3,14,620 for broiler and layer farm, respectively. The gross returns per year were Tk 3.55,772 and 4,37,477 for broiler and layer farm, respectively. The net returns per year were Tk 56,290 for broiler and 1k 1.22.826 for layer poultry farm revealed that most of the selected input variables had some signitleant impacts on the production of broiler and layer poultry thmis.
Begum (2000) conducted a study to estimate the relative profitability of small, medium and large categories of broiler and layer farms and to determine the contributions key variables to poultry income. She found that total costs per broiler per farm per year stood at 1k. 2. 38,051, 525095, 1120630 and 1k 663943
18
for small, medium, large and all farms, respectively. For layer farms total costs per farm per year stood at Tk. 215255, 432179. 1192688 and Tk. 535129 for small, medium, large and all farms, respectively.
Karim (2000) conducted a study on economic analysis of broiler enterprise under
contract farming system in Bangladesh. For this study the area selected was Bajitpur Upazilla of Kishoreganj district. The study showed that total costs per bird were estimated at
'1k. 78.43 for small farms. Tk.78.51 lbr medium Ihrms, '1k.
78.32 for large farms and Tk. 78.31 for all broiler firms. Variable costs per bird were Tk. 71.33 for small farms and Tk. 71.81 for medium and Tk. 71.98 for large
farms and Tk. 71.75 for all broiler farms. Average amount of gross return per birdstood at 1k. 89.21,
Tk.89.40. and Tk. 90.71 and Tk. 89.87 for small, medium, large and all broiler farms respectively. It may be seen that the variation in return for different farm categories was not insignificant. The findings of the study also showed that the broiler farms contributed significantly to the creation of self- employment/ product wage employment in the study area. The study showed that the proportion of savings increases with the rise in income. It indicated that broiler farming was playing a crucial role in creating employment opportunity in the rural and semi-urban areas of Bangladesh.
19
Nair and Ghadoliya (2000) based on the number of birds, classified farms into three size groups, viz. small, medium and large and also showed the economic viability of layer farming in the state of Ooa. They showed that the total cost of maintenance per layer was Rs. 327.52. Rs. 320.00 and Rs. 307.52 for small, medium and large size farms respectively. The net returns per layer were also being Rs. 30.78, Rs. 46.35 and Rs. 64.98 for small, medium and large size farms respectively. On the return side, returns lioni eggs per layer accounted the maximum amount than other returns as would be expected. It was found from the study that the net returns were highest in the large size farms and lowest in small size farms indicating economies of scale. They also reported that better feeding, and proper management on large size thrms resulted in higher egg production and returns per layer on these farms. Production cost of an egg was niaxiinuin for small farms and minimum for the large farms. They also calculated the cost-
benefit ratio that was 1:1.1 I, 1:1.17 and 1:125 for small, medium and large size farms respectively. The ratio was also the highest for the large size group farms. It was concluded from the study that layer poultry farms of all categories were economically viable in the study area and they also showed that large size group layer farms were making more profits as compared with the medium and small size group farms.
20
Ahmed (2001) conducted a study on comparative economic analysis of broiler production under PROSHIKA supervised and private management in some selected areas of Tangail district. It was observed that broiler rising under both PROSHIK.A supervision and private management were prolilablc but broiler production under private management was profitable than PROSHIKA supervision.
Bhuiyan (2003) conducted a study comparing economic analysis of poultry production tinder supervision of ABF and farmers own management in some selected areas of Kishorcgonj district. The study reveals that in case of broiler farm total cost per year stood at 1'k 8,33,860 and 6,53,952 under ABF supervision and farmers own management. The respective figures at layer farm per 1 8 months were Tk 32,81.098 and 7,09,712. It is evident from the study that the gross returns of broiler farm per year stood at Tk 11.01386 and 8,84.482 under ABF supervision and farmers own management. respectively. On the other hand, gross returns at layer farm per 18 months stood at 11 62,66,456 and 10.08.38 1. The net returns over full cost at broiler farm per stood at Tk 2,67.926 and 2.30,530 under ABF supervision and farmers own management, respectively. The respective figures for layer farm per 18 months were estimated at Tk 29,85,358 and 2,98,669.
21
Begum (2004) conducted a study on the profitability of poultiy farms at smallholder production units in some selected areas at Muktagachha upazilla of Mymcnsingh district. She selected 3 commercial layer farms (Total number of birds 9,450) and 3 commercial broiler farms (Total number of birds 21,000). She showed that rearing cost per layer stood Tk. 1,014.80 for 1.5 year and total costs per broiler were estimated at Tk. 72.04 for 1 year. Average gross return per layer and broiler stood at 1k. 1,168.72 and 82.31 respectively. Net returns per layer stood at Tk. 153.92 and per broiler at 1k. 10.27. The study also noted that cost benefit ratio was 1.17 for layer farm and 1.14 for broiler farms. It was concluded from the study area than broiler frms.
22
Chapter 3
Matedals and methods
CHAPTER III
METHODOLOGY OF THE STUDY
The focus of the chapter is to describe the selection of the study area, selection of the population samples, period of data collection, collection of data and their validity and reliability, analytical lechniques and methods of measuring cost items and competitiveness along with other relevant methods.
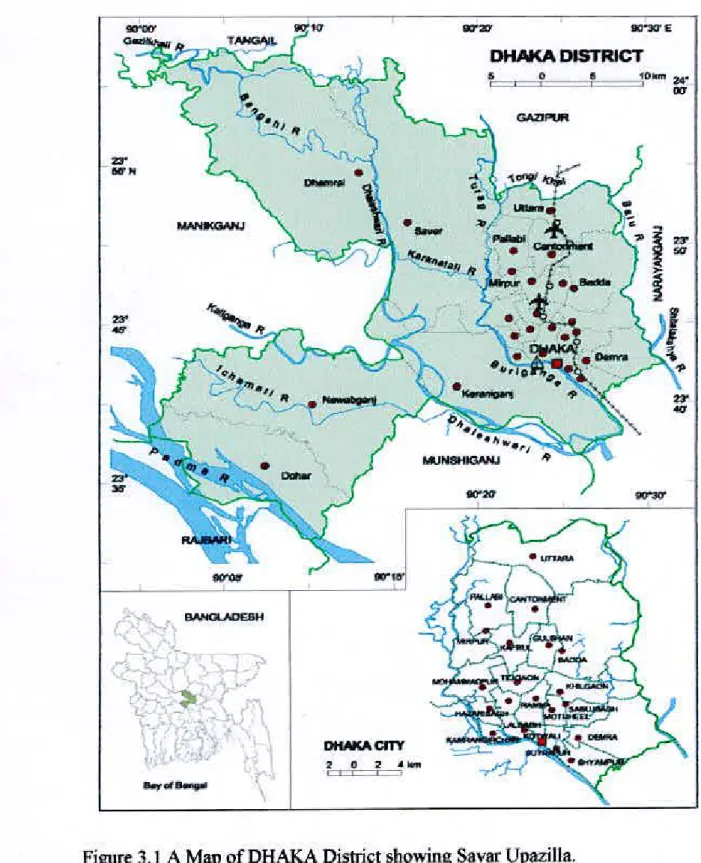
3.1 Locale of the study
The study was purposely conducted at four villages namely Shadapur, Chakulia, Genda and Beraid in the Savar Upazilla under Dhaka district. The area was chosen for the following reason: I) availability of dilkrent categories of poultry farms; ii) easy communication facilities from the Sher-e-Bangla Agricultural University Campus to the area and iii) expected better cooperation from the owners of poultry farms. Before selecting the study area the author visited these areas to get him acquainted with the characteristics of the poultry farmers and specially practices involved in poultry farming.
23
G tGJ
-'I- •
23•
6tH &..r\ S
srr E
DHAKA DISTRICT
GAVP(H
•
saw Pwamm 1 10 23'.•LSJIfl 5U
1 1
'IRS • 1 j,••Befl 1
'-
40
RmJNSHIGANJ 4
Inc ) C
Wit) P
ALLM
(CJc (I \
cYAk •
cnv
2 0 2 4I&
:c1r
Figure 3.1 A Map of DRAKA District showing Savar lJpazilla.
24
23 58 N
9017 902U E
)CAUAXAJR
SAVAR UPAZILA
1 0 I 2km Shimu
DHAMRAI
L23
rsc
a.-
PathaSe
cic
L
WATC '/1223
"Paflc,
t' ssroVLn
BkulIa
Paurashava ) 0
Dqwst*i -
-- SAyAR,H
-- —I
. .4
C Banegum Kaunáa, -.-, ..-".. 23t
Tehn/
-.
It
-
MOHAhStD-
- Pun
XERAJ'lPGANJ
90'14"/ 9018'
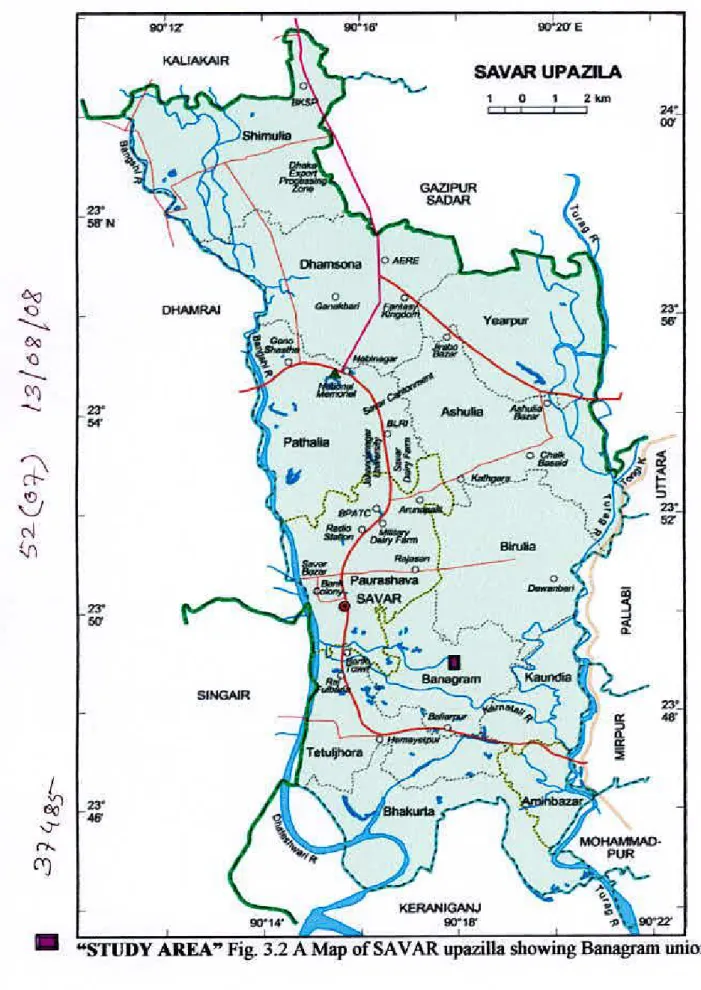
"STUDY AREA" Fig 31 A Man of SAVAR unazilla showini! BanaQram Wi on
SSPJGAIR
[2r He
25
3.2 Population and sampling procedure
It is not possible to make farm business survey covering all farms. For this reason, sampling was done to select representative thrrns to minimize time and cost of the study. There were 150 poultry farms in the study area. Out of these population 80 poultry farms were selectcd at random 30 belong to small farm having tip to 500 birds, and 30 belong to medium having 500-1000 birds and 20 belong to large having more than 1000 and above birds.
3.3 Preparation of Interview schedule
In order to collect relevant data, an interview schedule was prepared keeping in view the major objectives of the study. The draft schedule was pre-tested by interviewing six respondents in the study areas. The draft schedule was improved, rearranged and modified in the light of the actual and practical experiences. After making necessary adjustments, a final survey schedule was developed in logical sequences of the following items of information:
Socioeconomic characteristics of poultry owners.
Productivity indicators of the poultry farming and items of costs and returns.
Inventory of the poultry farms.
Problems of poultry farming and the suggestions of the poultry owners to solve those problems.
26
3.4 Period of data collection
The data were collected during July 2007 to August 2007.
3.5 Variables of the study
In descriptive survey research, (he selection and measurement of variables constitute an important task. Ezekiel and Fox (1959) defined a variable as any measurable characteristics, which can assume varying or different values in successive individual cases. A research hypothesis contains at different values in successive individual cases. A research hypothesis contains at least two elements, an independent variable and a dependent variable. Thowsand (1953) defined an independent variable is that factor which is manipulated by the experimenter in his attempt to ascertain its relationship to an observed phenomenon. He ffirther defined a dependent variable is that flictor which appears, disappear or varies as an effect of the independent variables.
The dependent variable of the study was: Profitability of Small-scale poultry fanning.
The independent variables included; age, education, family size, farm size, annual income, cosmopoliteness, and poultry thrining Knowledge.
27
3.5.1 Measurement of Independent variables:
3.5.1.1 Age:
The age of a respondent was measured in terms of actual years from his birthday to the intcn'iew. One score was assigned for each and every complete year of a farmer's age.
3.5.1.2 Education:
A score of zero was given to a respondent who didn't know how to read and write, a score of 0.5 was given to the respondent who could sign only and a score of one was given for each year of formal schooling completed by the respondent i.e. one for completing class one, two for class two and so on.
3.5.1.3 Family size:
Family size of a respondent was measured in terms of actual members for his family. One score was assigned for each member of the family.
3.5.1.4 Farm size:
Farm size was estimated in terms of full benefit to the respondent. By considering benefit the farm size of a respondent was measured by using the following formula:
Farm size = A+B±C+ '/2 (D+E)±F
Where,
A= Homestead area including orchard/Garden B= Farm areas
C= Cultivation area owned by the respondent D= Area shared in (Borga) by the respondent E= Area shared out (Borga) by the respondent F= Land taken from others on lease.
The farm size of a respondent was calculated in hectare 3.5.1.5 Annual income:
Income of a respondent was measured in taka on the basis of the total yearly earnings of his family from agricultural and non-agricultural sources. For determining agricultural income of a respondent at first the yields of all the crops produced in the immediate previous year of the study were converted into cash according to the market price. The values of other farming products encompassing live stock, poultry. fisheries etc. were taken into consideration. Earning from other non-farming activities (Scrvices. Business, Labour and others) of the respondents and other members of his family was also calculating the income. Yearly earnings from farming and non-farming activities were added together to obtain the total income of a respondent. For calculation of income score, one was assigned one thousand taka of income. Annual income of a respondent was measured by using the following formula:
(
29
Annual income = A+13 = -1k.
Where,
A= Income from agricultural sources B= Income from non-agricultural sources
3.5.1.6 Cosmopoliteness:
Cosmopolitcness of a respondent was measured in terms of his nature of visits to the six different place external to his own social system. The scale was used for computing the cosmopolitcncss scores is presented below:
Nature of visit Weight
Never visit U
Occasional visit
Often visit 2
Regular visit 3
The cosmopoliteness score of a respondent was determined by adding the scores obtained for his visits to each of the six locations of places as shown in item no.
six of the interview schedule (Appendix A). The cosmopoliteness scores of an individual could range from 0-36 where 0 indicated no cosmopolitencss and 36 indicated very high cosmopoliteness.
30
3.5.1.7 Poultry farming knowledge:
Poultry flirming knowledge of a respondent was measured by asking him ten (10) questions on different aspects of poultry farming. The score two (2) was given to each of the questions. The total assigned score of all questions was 20. The score was given to their response at the time of interview. Answering a question correctly an individual could obtain full score, while for wrong answer he obtained zero score.
3.5.1.8 Training:
Training is essential for poultry farming. Training of' a respondent was measured in terms of actual day/months for their percentage.
3.5.2 Measurement of dependent variable:
The dependent variable of the study was profitability of small-scale poultry farming.
3.5.2.1 Simple profitability analysis
Relative profitability of different categories of poultry farmer was examined on the basis of gross margin and net return analysis.
31
3.5.2.2 Gross margin analysis
Gross margin analysis was donc to have an estimate of the dilièrence between total return and variable cost. The argument for using the gross analysis is that farmers of Bangladesh are more interested to know their return over variable cost.
Moreover, for short run analysis as well as for farm planning, gross margin analysis is widely used. This analysis is also easily understandable to the farmers because of its simplicity.
3.5.2.3 Net return analysis
The analysis considered flxed cost (which includes cost for land rent, interest on operating capital, depreciation of tools and equipment, etc.) Deducting all costs (variable and fixed cost) from gross return arrived at net return.
To achieve the main objectives of the study, a simple costs and returns analysis was used to determine the profitability of the selected poultry farms. For this purpose, the following equation was developed to assess the profitability of the poultry farms.
32
R = PeEs + PeEc + PeEg + PqQs + PqQc + PqQg-
X
(PX1) + Ic- TFCWhere,
R = Profit per poultry farm per year (Tk/year) Pc = Per unit price of egg (fl/piece)
Pq = Per unit price (1k) of poultry/chicklpullct (Tk/kg) Es = Total number of eggs sold in a year.
Ec = Total number of eggs consumed in a year by farm family.
Eg = Total number of eggs gifted in a year.
Qs = Total number ofpoultry/chicks/pullets sold in a year.
Qe = Total number pullet consumed in a year by farm family.
Qg = Total number of poultry/chicks/pullets gifts in a year.
Pxi = Per unit price of iEh (variable) inputs.
Xi = Number/quantity of ith inputs (i1,3, ----n).
Ic = Value of change in inventory.
TFC = Total Fixed Costs
T 33
Interpretation and discussion of the findings presented in simple terms, such as average, percentage, ratios, etc. In order to confirm some results normal test were performed. Normal tests for large samples were used to test the difference between two sample means when population variances were not equal.
3.5.2.4 Production functional analysis
To determine the contribution of the most important variable in the production process of poultry farms, (he Cobb-Douglas production function was used. The log linear form of the model has, in fact, important application in economics and it is, therefore, widely used by many researchers in their economic studies (Dorman and Guise 1984, All and Miah 1994). Another advantage of this model is that the elasticity of production, for example, and returns to scale can easily be obtained from the results of the co-efficient. iRe following model was used in this study.
y= ax, bi X2&2XJb3X4I)4X5(5DPÔD2/I7eZ1
Which was linearised in the logarithmic form as under:
In Y= In a+b1 In x1+b2 In x2 +b3 In x3 ±b4 lax4 + b5 In x5 + b6 + D1-'-b7 + D2+ u
Where,
Y = Returns from eggs and poultry birds.
34
a = Constant or intercept of the function.
x1 = Cost offecd.
x2 = Cost of labour x3 = Veterinary expenses
X4 =Cost of electricity
= Cost of purchase of day-old chicks
= Intercept dummy for farm size effect
1)1 = I for medium poultry farms;
=0 for otherwise.
D2 = Intercept dummy for farm sizc effect
= 1 for medium poultry farms;
= 0 for otherwise.
u = error terms
= Parameters to be estimated.
A separate function was also estimated for the pooled data of poultry ('antis with intercept dummy for farm category
(e. g. D3 = I for poultry farms;
D3 = 0 for otherwise)
It was measured by the total profit in poultry farming of poultry farmers. One score was given for one thousand.
35
3.6 Procedure for computation of costs and returns
To determine the relative prolitability of poultry farms, it is necessary to compute all cost items, which have to be deducted Iron) the value of' output. The cost of inputs is an important factor affecting economics decision of a farm manager. But it is quite difficult to estimate the costs of some production inputs. For purchased inputs costing were relatively straight forward as the actual price paid for the item.
For home or farm supplied inputs, costing was done byusing the principle of opportunity cost. The cost items were divided tinder the following heads:
Cost of day old chicks: Cost of' poultry birds is the money value of total costs of poultry birds, purchased by the owners of the poultry [lirms.
Feed cost: Cost of teed included ready made ICed, such as, rice bran, wheat bran, fishmeal, bone meal, oil cake, salt, mineral, vitamin, D. L. methionin, (In ready made feed they used rice bran, ctc)
Veterinary charge: Veterinary expenses included costs of vaccine.
medicine and treatment. Veterinary expenses were calculated by taking into account the actual cost incurred by the sample farmers.
Electricity or fuel cost: Electricity or fuel cost has been measured as per unit appeared in a month
Cost of tools and equipment: The costs of durable assets like tools and equipment, poultry house, etc., were determined by applying straight-line
depreciation method for one year. The annual depreciation cost was worked out as follows;
Original value —Salvage value Depreciation = Life of the asset
Housing cost: The cost of land use was calculated by taking into account of the depreciation cost, interest on housing value and repairing cost.
Land uses cost: The cost of land use was difibrent Lbr different plots depending upon to location, topography and fertility of the soil. The cost of land use may be estimated by using one of the alternative concepts ( I ) interest on the value of land and (ii ) rental value of land.
The average rental value of land use was estimated according to the assessment of the farmers. The interest rate was charged at the rate of Tk. 10 per cent, which was the interest rate given on short-term deposits. Interest on the value of land was computed by using the following lormula:
Interest on the value of land V x I x T Where, V = Average value of land
I = Rate of interest per annum T = Length of production period
Interest on Operating Capital: In this study, the amount of money needed to meet the expenses on hired or purchased inputs was treated as operating capital. Interest on operating capital was computed at the rate of 10 per annum. Interest on operating capital was computed by the following formula:
37
Annual interest on OC = Operating Capital IR = Rate ol'Iniercst 3.7 Measurement of problems
Ten problems were selected supposed to be faced by farmers in poultry farming.
These were measured by using a ten-point scale. Scores were assigned to ten for very high problem, S for high problem, 6 for medium problem, 4 for low problem, 2 for very low problem and 0 for no problem. To ascertain the intensity of problem in poultry farming. Problem Facing Index (P11) was computed by using following forniula:
PFI=P\sHxlO+Pux8±PM x6+PL x4+P\1 x2
Where,PFI = Problem Facing Index
H
= Percent of farmers having very high problem P11 = Percent of farmers having high problem
= Percent of Ilirmers having medium problem
= Percent of farmers having low problem
PVL
= Percent of farmers having very low problem
3.8 Methods of data collectionThe researcher conducted the whole survey after the preparation of the final schedules. The thee-to-thee data collected from the selected poultry owners by direct interview with a set of interview schedules designed for the study. Before asking the individual questions, each owner of a poultry farm was explained in
38
brief the aims and objectives of the present study. They were then convinced that the study was purely an academic one, and was not likely to have an adverse etThct on their businesses. To attain accuracy and reliability of data, care and caution were taken in the data collection. Attention was paid to the mood of the farmers and a congenial relationship was maintained between the respondents and the researcher.
After completion of each interview, the schedule was checked and verilied to be sure that answer to farmers was again interviewed for relevant answers. In order to minimize errors, data were collected in local units. These were subsequently converted into appropriate standard units.
3.9 Compilation of Data
The researcher coded and compiled after the data from the interview schedule. The local units were converted into standard unit. The qualitative data were transferred into quantitative forms by appropriate scoring techniques. The responses of the respondents from the interview schedule to a master sheet and then entering the data into the computer for analysis.
3.10 Analysis of data
All the collected data were summarized and scrutinized carefully and recorded in master sheets. Finally relevant tables were prepared in accordance with the objectives of the study. Data were presented mostly in tabular form, because it is simple in calculation, widely used and easy to understand.
39
Chapter 4
Results and Discussion
CHAPTER IV
RESULT AND DISCUSSION
The main purpose of this section is to provide a clear idea about the poultry farm and farm owners. The findings have been discussed tinder the following socio- economic characteristics.
4.1 Socio-economic characteristics of poultry prod ucers
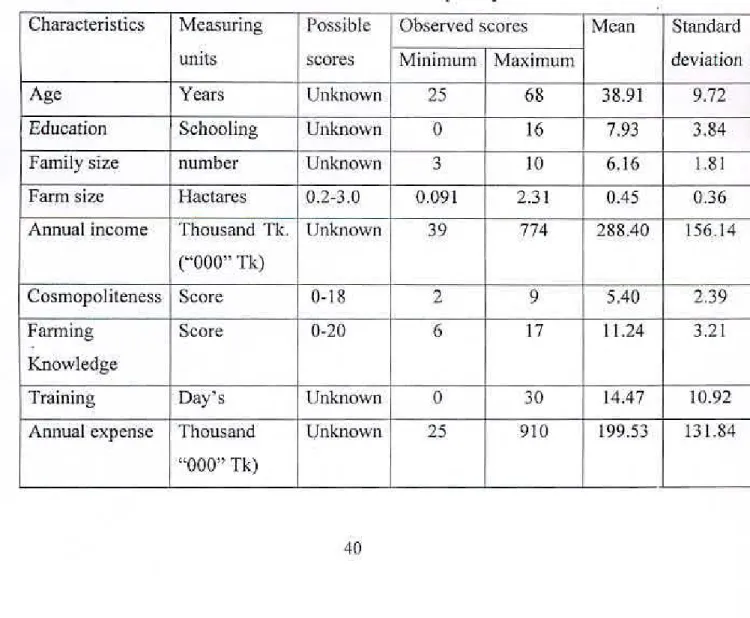
The salient features of the nine (9) characteristics of the farm owners, each of which constituted an independent variable are presented in Table 4.1
Table 4.1 Salient features of the characteristics of poultry [hrniers Characteristics Measuring Possible Observed scores
units scores Minimum ] Maximum
Mean Standard -, deviation
Age Years Unknown 25 68 38.91 9.72
Education
1_Schooling Unknown 0 16 7.93 3.84
Family size numbcr Unknown 3 10 6.16 1.81
Farm size Haetares 0.2-3.0 0.091 2.31 0.45 0.36
Annual income Thousand Tk.
('000" Tk)
Unknown 39 774 f288.40 156.14
Cosmopoliteness Score 0-I8 2
[ 9 5.40 2.39
Farming Score
Knowledge
0-20 6 17 11.24 3.21
Training Day's Unknown 0 30 14.47 10.92
Annual expense Thousand
"000" Tk)
Unknown 25 910 199.53 131.84
40
4.1.1 Age:
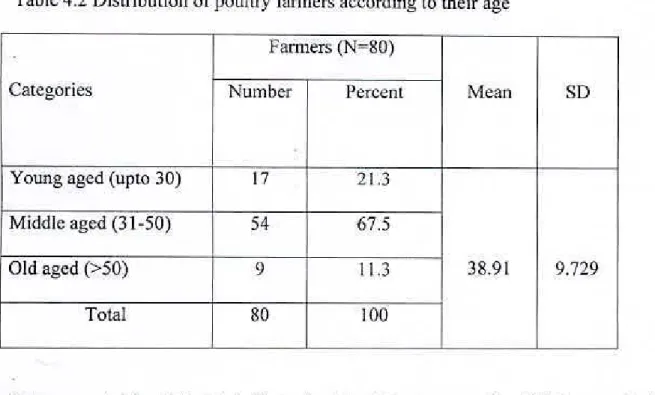
Age of the respondents ranged from 25 to 68 years, the average being 38.91 with standard deviation of 9.729. The poultry farmers of the study group were classified into three categories on the basis of their age as shown in Table 4.2
Table 4.2 Distribution of poultry farmers according to their age
Categories
Farmers (Nr80)
Mean SD
Number
-
PercentYoung aged (upto 30) 17 1 21.3
38.91 9.729 Middle aged (3 1-50) 54 67.5
Old aged (>50) 9 11.3
Total 80 100
Data presented in table 4.2 indicate that the highest proportion (67.5 percent) of the flirmers were middle aged compared to 11.3 percent of being old and 21.3 percent the young. Flowever, data also revealed that 88.8 percent of the farmers were young and middle aged. It might he due to young and middle-aged people are generally more receptive to new ideas and practices.
41
4.1.2 Education
Education has its own merits and it contributes to economic and social development. Education also plays an important role in agricultural development especially in the livestock and poultry sub-sector. Education helps a person to have day-by-day information about the modern techniques together with technological change in various production processes. It makes a man more capable to manage scarce resources and hence to earn maximum profit (Miah
1990). It also helps a person to take proper decision regarding his thnn business.
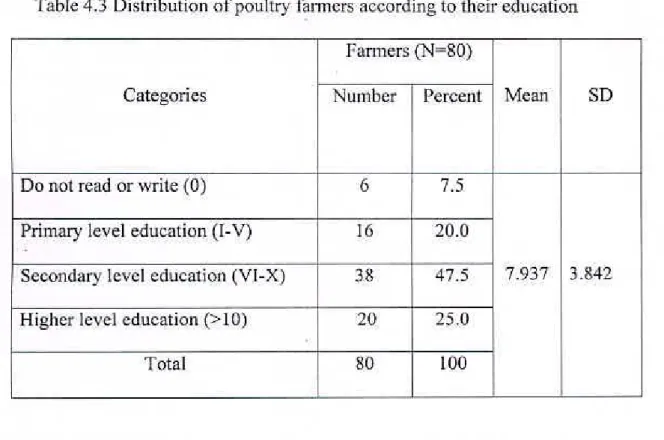
Table 4.3 Distribution of poultry färniers according to their education
Categories
1:ar,iers (N80)
Mean SD
Number Percent
Do not read or write (0) 6 7.5
7.937 3.842 Primary level education (I-V) 16 20.0
Secondary level education (Vl-X) 38 47.5 Higher level education (>10) 20 25.0
Total 80 100
The table 4.3 reveals that most of the owners of selected poultry farmers are well educated and a very little less than half portion (47.5 percent) of the respondents fell in the secondary education and above to the respondents few them (25
a 42
percent) and (20 percent) were higher and primary level of education. Only 7.5 percent of the farmers had no education respectively. The findings indicate that education of an individual is likely to be more receptive to the modern facts and ideas; they have much mental Strength in deciding of a matter related to problem sol' I ng.
4.1.3 Family size
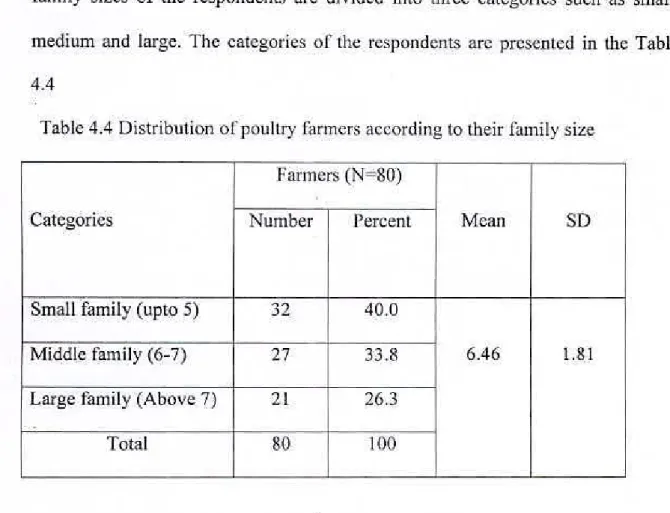
The range of family size of the poultry farmers was from 3-10 members. The family sizes of the respondents are divided into three categories such as small, medium and large. The categories of the respondents are presented in the Table 4.4
Table 4.4 Distribution of poultry farmers according to their !ämily size
Categories
Fariiiers (N=80)
Mcan SD
Number Percent
Small family (upto 5) 32 40.0
6.46 1.81 Middle family (6-7) 27 33.8
Large family (Above 7) 21 26.3
Total 80 IN
Table 4.4 indicates that the highest proportion (40 percent) of the respondents had small family size compared to 33.8 percent and 26.3 percent medium and large family size respectively.
43
4.1.4 Farm size
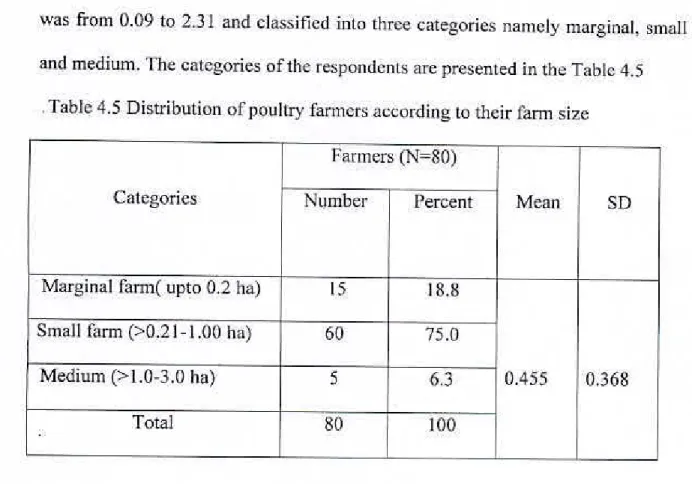
—( Farm size of the respondents varied from farm to farm. The range of the farm size was from 0.09 to 2.31 and classified into three categories namely marginal, small and medium. The categories of the respondents are presented in the Table 4.5
Table 4.5 Distribution of poultry farmers according to their farm size
Categories
Farmers (N$0)
Mean SD
Number Percent
Marginal farm( upto 0.2 ha) 15 18.8
0.455 0.368 Small farm (>0.21-1.00 ha) 60 75.0
Medium (>1.0-3.0 ha) 5 6.3
Total 80 100
Data presented in Table 4.5 indicates that more than one third (75 percent) of the respondents had small farm while 18.8 percent were marginal. However 6.3 percent of the respondents had medium thrm.
4.1.5 Annual income
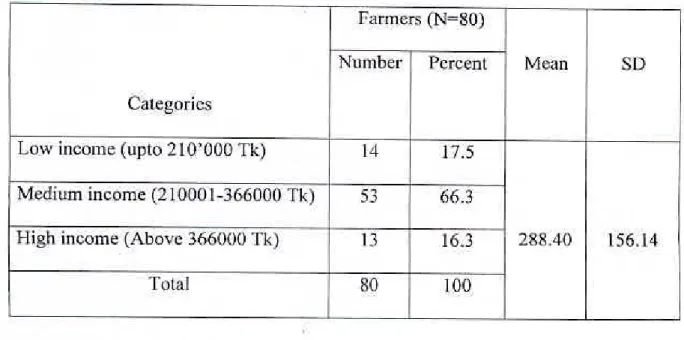
The annual income of the respondents in this study ranged From 39 to 774 and classified into three categories such as low, medium and high. The categories of annual income are presented in the Table 4.6
ii. 44
Table 4.6 Distribution of poultry farmers according to their annual income
Categories
Farmers (N=80)
Mean SD
Number Percent
Low income (upto 210'000 Tk) 14 17.5
288.4() 156.14 Medium income (21000 1-366000 1k) 53 66.3
High income (Above 366000 Tk) 13 16.3
Total 80 100
Data furnished in the 1ahle 4.6 indicatcs that the highest portion (66.3 percent) of the respondents had medium annual income while 17.5 percent and 16.3 percent low and high income respectively. The average income of the farmers was much higher of the study area than national average income of the country. This might be due to the fact that the farmers of the study area were not engaged in only agriculture. They earned from other sources such as service, business etc.
4.1.6 Cosmopoliteness
The range of the computed cosmopoliteness scores of the respondents varied from (one) ito 15, against the possible range of zero (0) to 18. The mean was 5.40 and the standard deviation was 3.21. Based on the observed cosmopolitencss scores, the farmers were classified into three categories as shown in 1iiblc 4.7
45
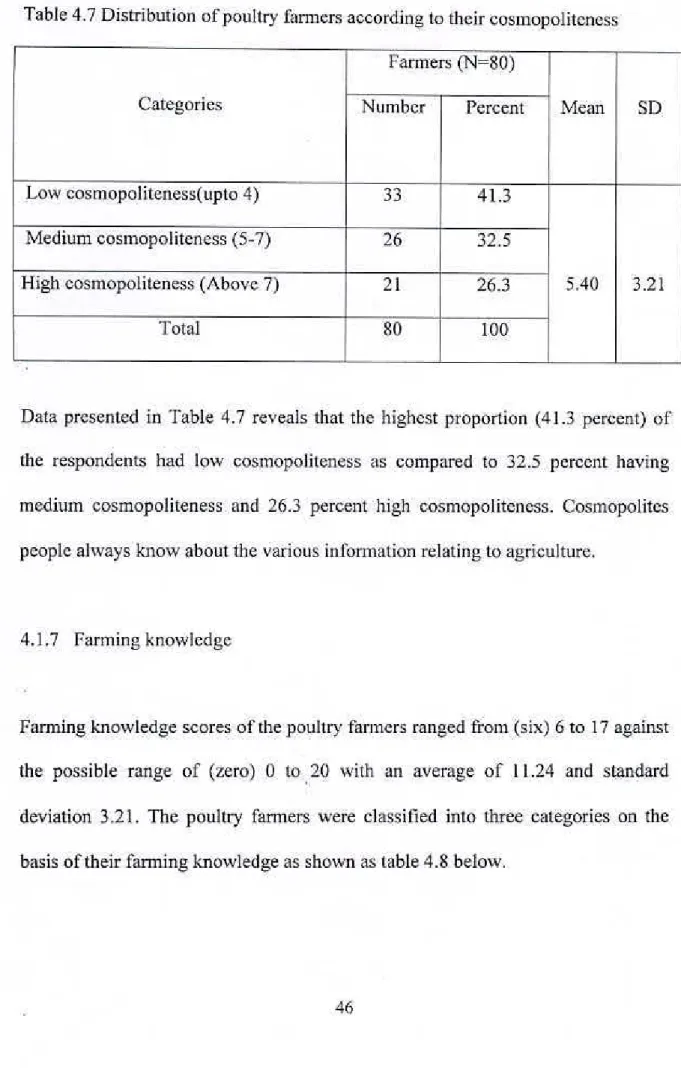
Table 4.7 Distribution of poultry thrmers according to their cosmopoliteness Farmers (N =80)
Categories Number Percent Mean SD
Low cosmopoliteness(upto 4) -- 33 41.3 Medium cosmopoliteness (5-7)
M6
32.5High cosmopoliteness (Above 7) 21 26.3 5.40 3.21
1'otal I 80 I 100
Data presented in Table 4.7 reveals that the highest proportion (41.3 percent) of the respondents had low cosmopoliteness as compared to 32.5 percent having medium cosmopoliteness and 26.3 percent high cosmopoliteness. Cosmopolites people always know about the various i