PROFITABILITY AND TECHNICAL EFFICIENCY OF BORO RICE PRODUCTION IN SOME SELECTED AREAS OF NILPHAMARI DISTRICT IN BANGLADESH
MD. EMDADUL HAQUE
DEPARTMENT OF AGRIBUSINESS AND MARKETING SHER-E-BANGLA AGRICULTURAL UNIVERSITY
SHER-E-BANGLA NAGAR, DHAKA -1207
JUNE, 2020
PROFITABILITY AND TECHNICAL EFFICIENCY OF BORO RICE PRODUCTION IN SOME SELECTED AREAS OF NILPHAMARI DISTRICT IN BANGLADESH
BY
MD. EMDADUL HAQUE
Reg. No. : 13-05650
A Thesis Submitted to the Faculty of Agribusiness Management Sher-e-Bangla Agricultural University, Dhaka,
in partial fulfillment of the requirements for the degree of MASTER OF SCIENCE
IN
AGRIBUSINESS AND MARKETING SEMESTER: JANUARY-JUNE, 2020
Approved by:
Sauda Afrin Anny Supervisor &
Assistant Professor
Dept. of Agribusiness & Marketing Sher-e-Bangla Agricultural University
Bisakha Dewan Co-supervisor &
Assistant Professor
Dept. of Agribusiness & Marketing Sher-e-Bangla Agricultural University
Md. Rashidul Hasan Chairman
Department of Agribusiness & Marketing Sher-e-Bangla Agricultural University
Dhaka-1207
CERTIFICATE
This is to certify that thesis entitled, “PROFITABILITY AND TECHNICAL EFFICIENCY OF BORO RICE PRODUCTION IN SOME SELECTED AREAS OF NILPHAMARI DISTRICT IN BANGLADESH" submitted to the Faculty of Agribusiness Management, Sher-e-Bangla Agricultural University, Dhaka, in partial fulfillment of the requirements for the degree of MASTER OF SCIENCE IN AGRIBUSINESS AND MARKETING, embodies the result of a piece of bona fide research work carried out MD. EMDADUL HAQUE, Registration No. 13-05650 under my supervision and guidance. No part of the thesis has been submitted for any other degree or diploma.
I further certify that such help or source of information, as has been availed of during the course of this investigation has duly been acknowledged.
Dated: 30 Ma y, 2020
Place: Dhaka, Bangladesh
Sauda Afrin Anny Supervisor &
Assistant Professor
Dept. of Agribusiness & Marketing Sher-e-Bangla Agricultural University
Department of Agribusiness & Marketing
Sher-Bangla Agricultural University
Sher-e-Bangla Nagar, Dhaka-1207, Bangladesh
.
Website: www.sau.edu.bd
DEDICATED TO
MY BELOVED PARENTS
i
ACKNOWLEDGEMENTS
First of all, I would like to thank Almighty Allah, the most merciful and kindhearted, the most gracious and beneficent to Whom every praise is due and to His prophet Mohammad (SM) Who is forever a torch of knowledge and guidance for humanity as a whole with who’s delighting the present and endeavor beautiful. All praises are due to the omnipotent, omnipresent and omniscient Allah, who enabled me to pursue my higher studies in Agricultural Economics and to complete the research work and this thesis successfully for the degree of Master of Science in Agricultural Economics.
Now, I would like to pay ineffable gratitude to my Supervisor, Assistant Professor, Sauda Afrin Anny, Chairman, Department of Agribusiness and Marketing, Sher-e-Bangla Agricultural University, Dhaka-1207, for her ever inspiring guidance, scholarly comments and constructive suggestions throughout the research work and preparation of thesis. Without her valuable intellectual advice, precise constructive comments and help this work would never have come to life.I am especially grateful to my respected Co-supervisor, Bisakha Dewan, Assistant Professor, Department of Agribusiness and Marketing Sher-e-Bangla Agricultural University, Dhaka-1207, for his proper guidance, inspiring co-operation and encouragement during the research work and preparation of thesis.
I would also like to extend my appreciation to Supervisor, Assistant Professor, Sauda Afrin Anny, Chairman, Department of Agricultural Economics, Sher-e-Bangla Agricultural University, Dhaka, for her sincere cooperation, valuable suggestions and encouragement at every stage of this thesis. I am highly grateful to all of my honorable teachers, for their valuable teaching, direct and indirect advice, encouragement and co-operation during the whole study period.
I would like to express my gratitude to 60 farmers who actively participate in this survey and most importantly help me to understand their initiatives and activities related to Boro rice farming in general and in particular. They provided important data upon which different models were employed to evaluate the efficiency of farming activities. Their invaluable cooperation during my data collection process is highly acknowledged.
ii ABSTRACT
Boro rice is the most important and single largest crop in Bangladesh in respect of volume of production. It has been persistently contributing to higher rice production in last successive years. Present study was designed to measure the profitability and technical efficiency of boro rice farmers in selected areas of three upazillas Dimla, Domar, Jhaldhaka under Nilphamari district. Primary data were collected from randomly selected total 60 farmers from the study area. Both tabular and functional analyses were applied in this study. The Cobb-douglas stochastic frontier production function was used for this study to measure technical efficiency of boro rice farmers.
The major findings of the study reveal that boro rice production is profitable. Total cost of production of Boro rice was Tk. 88748.85 per hectare. Gross return of boro rice was Tk. 130904.38 per hectare and net returns of Boro rice was Tk. 42155.53 per hectare.
Benefit Cost Ratio (BCR) was found to be 1.47 which implies that one-taka investment in boro rice production generated Tk.1.47. The coefficients of parameters like Human Labor and TSP was negative. Where Seed, Urea, and Irrigation was found positive and significant at 1, 5 and 10 percent level of significant respectively. In the technical inefficiency effect model, experience, farm size, extension service and credit service have negative coefficients indicating that this helps in reducing technical inefficiency of boro rice farmers. The study revealed that a considerable improvement took place to increase household income of the farmers in the study area and to improve the socioeconomic conditions with the introduction of large-scale commercial boro rice production. The study also identified some problems and constraints faced by the boro rice farmers and suggested some recommendations to improve the present production situation so that yield of boro rice would possibly be increased.
iii
TITLE PAGES
TABLE OF CONTENT
CHAPTER I ... 1
INTRODUCTION... 1
1.1 General background ... 1
1.2 Present status of Bangladesh agriculture ... 1
1.3 Importance of boro rice ... 4
1.4 Boro rice production in Nilphamari ... 5
1.5 Nutritive and medicinal value of these crops ... 6
1.6 Justification of the study ... 8
1.7 Specific objectives of the study ... 9
1.8 Limitations of the study... 9
CHAPTER II ... 10
REVIEW OF LITERATURE ... 10
CHAPTER III ... 15
METHODOLOGY ... 15
3.1. Introduction ... 15
3.2. Selection of the study area ... 15
3.3. Sampling technique and sample size ... 16
3.4 Data collection... 16
3.4.1. Questionnaire design ... 16
3.4.2. Pre-testing the questionnaire ... 17
3.4.3. Finalization of the questionnaire & method of data collection ... 17
3.4.4. Data editing and coding data editing and coding ... 17
3.5. Data processing ... 17
3.6. Processing, tabulation and analysis of data ... 18
3.7. Analytical techniques ... 18
3.7.1 Profitability analysis ... 18
3.7.1.1 Cost of land preparation ... 19
3.7.1.2 Cost of human labor ... 19
3.7.1.3 Cost of seed ... 19
3.7.1.4 Cost of urea ... 20
3.7.1.5 Cost of TSP ... 20
iv
3.7.1.6 Cost of MoP ... 20
3.7.1.7 Cost of insecticides... 20
3.7.1.8 Cost of irrigation ... 20
3.7.1.9 Interest on operating capital ... 20
3.7.1.10 Land use costs ... 21
3.7.1.11 Calculation of returns ... 21
3.8.1.12 Undiscounted benefit cost ratio (BCR) ... 22
3.7.2 Technical efficiency analysis ... 22
3.7.2.1 The stochastic frontier models ... 22
3.7.2.2 The stochastic frontier with cobb-douglas production function... 23
3.7.2.3 Specification of production model ... 24
CHAPTER IV... 26
DESCRIPTION OF THE STUDY AREA ... 26
4.1 Introduction ... 26
4.2 Location ... 26
4.3 Physical features, topography and soil type ... 26
4.4 General information of study area ... 28
4.5 Climate ... 29
4.6 Agriculture and economic condition ... 30
4.7 Transportation ... 31
4.8 NGO activities ... 31
4.9 Concluding remarks ... 31
CHAPTER V ... 32
SOCIO-ECONOMIC PROFILE OF HOUSEHOLD POPULATION ... 32
5.1 Introduction ... 32
5.2 Composition of the family size ... 32
5.3 Age ... 33
5.4 Education ... 34
5.5 Annual family income ... 35
5.6. Annual family expenditure ... 36
5.7 Agricultural training ... 37
5.8 Membership of any social organization ... 38
5.9 Concluding remarks ... 38
CHAPTER VI... 39
PROFITABILITY OF BORO RICE PRODUCTION ... 39
v
6.1 Introduction ... 39
6.2 Profitability of boro rice production... 39
6.2.1 Variable costs ... 39
6.2.1.1 Cost of land preparation ... 39
6.2.1.2 Cost of hired human labour ... 39
6.2.1.3 Cost of seed ... 40
6.2.1.4 Cost of urea ... 40
6.2.1.5 Cost of TSP ... 40
6.2.1.6 Cost of MoP ... 40
6.2.1.7 Cost of gypsum... 40
6.2.1.8 Cost of insecticides... 40
6.2.1.9 Cost of irrigation ... 41
6.2.1.10 Cost of manure ... 41
6.2.1.11 Total variable cost ... 42
6.2.2 Fixed cost ... 42
6.2.2.1 Rental value of land... 42
6.2.2.2 Cost of family labour... 43
6.2.2.3 Interest on operating capital ... 43
6.2.3 Total cost (tc) of boro rice production ... 43
6.2.4 Return of boro rice production ... 44
6.2.4.1 Gross return ... 44
6.2.4.2 Gross margin ... 44
6.2.4.3 Net return... 44
6.2.5 Benefit cost ratio (undiscounted) ... 44
6.3 Concluding remarks ... 44
CHAPTER VII ... 46
MAJOR FACTORS AFFECTING AND TECHNICAL EFFICIENCY OF BORO RICE PRODUCTION ... 46
7.1 Introduction ... 46
7.2 Interpretation of ML estimates of the stochastic frontier production function: . 46 7.3 Interpretation of technical inefficiency model ... 48
7.4 Technical efficiency and its distribution ... 49
7.5 Concluding remarks ... 50
CHAPTER VIII ... 51
PROBLEMS AND CONSTRAINTS TO BORO RICE PRODUCTION ... 51
vi
8.1 Introduction ... 51
8.2 Low price of output ... 51
8.3 High cost of irrigation water ... 51
8.4 High price of quality seed ... 51
8.5 Lack of quality seed ... 52
8.6 Attack of pest and disease ... 52
8.7 Inadequate extension service ... 52
8.8 Lack of operating capital ... 52
8.9 Natural calamities ... 52
8.10 Shortage of human labour ... 53
8.11 Lack of scientific knowledge of farming ... 53
8.12 Adulteration of fertilizer, insecticide, and pesticide ... 53
8.13 High price of fertilizers ... 53
8.14 Poor storage facilities in house... 53
8.15 Lack of quality tillage ... 54
8.16 Concluding remarks ... 54
CHAPTER IX... 55
SUMMARY, CONCLUSIONS AND RECOMMENDATIONS ... 55
9.1 Summary ... 55
9.2 Conclusion ... 58
9.3 Suggestion ... 58
CHAPTER X ... 60
REFERENCES ... 60
APPENDICES ... 64
APPENDIX A ... 64
APPENDIX B ... 68
vii
TITLE PAGES
LIST OF TABLE
Table 1.1: Food grains production (In lakh MT.) ... 3
Table 1.2: Area and production of rice and boro rice by different years ... 5
Table 1.3: Yearly boro rice production in Nilphamari ... 6
Table 1.4: Nutrients from per 100 gm rice ... 7
Table 4.1: Broad classification of study area (In sq. km.) ... 28
Table 4.2: Number of household, population and density of study area ... 28
Table 4.3: Population and literacy rate of study area ... 28
Table 4.4: Temperature, rainfall, humidity of Nilphamari ... 30
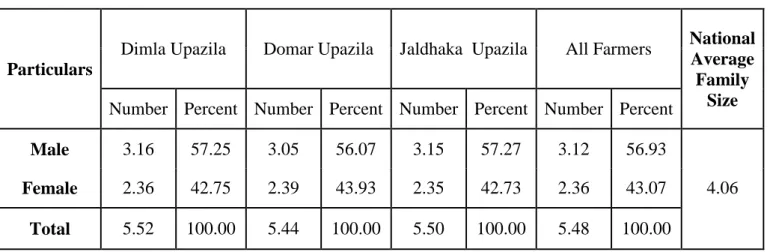
Table 5.1: Average family size and distribution of members according to sex of the sample farmers ... 33
Table 5.1: Agricultural work ... 35
Table 5.4: Membership in any organization of the respondent by study area ... 37
Table 5.5: Membership in any organization of the respondent by study area ... 38
Table 6.1: Per hectare costs of boro rice production ... 42
Table 6.2: Per Hectare cost and return of boro rice production ... 43
Table 7.1: ML estimates for parameters of cobb-douglas stochastic frontier Production function and technical inefficiency model for boro rice farmers. ... 47
Table 7.2: ML estimates for parameters of cobb-douglas stochastic frontier technical inefficiency model for boro rice farmers. ... 48
Table 7.3: Frequency distribution of technical efficiency of boro rice farms ... 49
Table 8.1 Problems and constraints of boro rice production by no. of farmers ... 54
viii
TITLE PAGES
LIST OF FIGURE
Figure 4.1: Map of Nilphamari district ... 27
Figure 5.1: Age of the respondent by study area ... 34
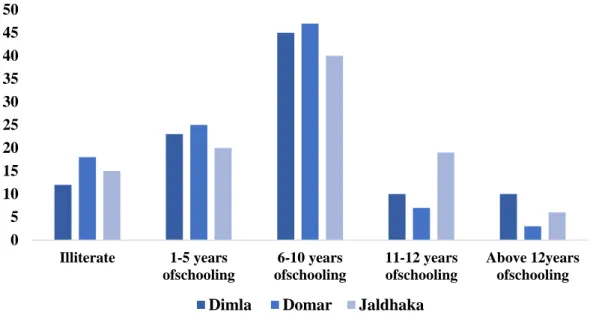
Figure 5.2: Education of the household members by study area ... 35
Figure 5.3: Annual family income and expenditure by study area ... 36
Figure 5.4: Annual family expenditure and savings by study area ... 37
1 CHAPTER I INTRODUCTION 1.1 General background
Agriculture is a means of food security, but it is a livelihood for a vast population in Bangladesh and a means of reducing poverty (accounting for 90% of reduction in poverty and fostering sustainable economic development. It is a sector that is strategically favorable to Bangladesh given its location as the largest delta in Asia, and most populated delta in the world. A plurality of Bangladeshis earn their living from agriculture. Although rice is the primary crops. Rice can be grown and harvested three times a year in many areas. Among them boro rice is the highest yielding production season. The country’s farmers produced record 2.04 crore tonnes of Boro rice during the 2018-19 crop season, according to the Department of Agricultural Extension. Boro rice yield per hectare was also estimated at 4.15 tonnes, adding that boro rice production crossed the target due to higher cultivation acreage.
The farmers grew boro rice at over 49 lakh hectares of lands though the government target was 48 lakh hectares. In last year 2019, the growers produced 1.96 crore tonnes of boro rice from 48.42 lakh hectares of lands, according to the DAE estimate.
The BRRI estimates that the country's annual demand for rice stands at 3.30 crore tonnes. The area for plantation increased in the last boro rice season. There is also improvement in the yield. Farmers grew rice on 48.59 lakh hectares of land in the last boro rice season, up 8.58 percent from a year ago, BBS data showed. Areas dedicated to the previous two crops – aus and aman – had also risen amid farmers' enthusiasm to cultivate rice on the back of higher prices prevailing in the domestic market for more than a year.Rice production in the aus season shot up 27 percent year-on-year to 27.09 lakh tonnes in 2017-18. Aman output rose 2.46 percent to 1.39 crore tonnes in the just concluded fiscal year. The boro rice season starts in December-February and ends in April-May. Planting of aus starts in April-May and the harvesting takes place in July- August, while the aman season begins in April-May and ends in November-December.
1.2 Present status of Bangladesh agriculture
Bangladesh is predominantly an agricultural country where agriculture sector plays a vital role in accelerating the economic growth. It is therefore important to have a
2
profitable, sustainable and environment-friendly agricultural system in order to ensure long-term food security for people. Broad agriculture sector has been given the highest priority in order to make Bangladesh self-sufficient in food. The Government determined to develop the overall agriculture sector keeping in view of the goals set out in the Seventh Five Year Plan and National Agriculture Policy. Over the last few years, there has been an increasing trend in food production. Agriculture sector plays an important role in overall economic development of Bangladesh. The agricultural sector (crops, animal farming, forests and fishing) contributes 14.10 (BBS, 2018) percent to the country’s GDP, provides employment about 39 percent of the labour force according to Quarterly Labour Force Survey 2016-17. Moreover, agriculture is the source of wide range of consumer demanded agricultural commodity markets, especially in rural areas. GDP from Agriculture in Bangladesh increased to 10739.10 BDT Million in 2019 from 10468.80 BDT Million in 2018. GDP From Agriculture in Bangladesh averaged 9012.60 BDT Million from 2006 until 2019, reaching an all-time high of 10739.10 BDT Million in 2019 and a record low of 7017.10 BDT Million in 2006.(BBS, 2019).
According to the final estimate of BBS, the volume of food grains production in FY2015-16 stood at 388.17 lakh MT of which Aus accounted for 22.89 lakh MT, aman 134.83 lakh MT, boro rice 189.38 lakh MT, wheat 13.48 lakh MT and maize 27.59 lakh MT. In FY2016-17 food grains production stood at 388.14 lakh MT of which Aus accounted for 21.33 lakh MT, aman 136.56 lakh MT, boro rice 180.24 lakh MT, wheat 14.23 lakh MT and maize 35.78 lakh MT. Table 1.1 shows the food grains production status during the period from FY2008-09 to FY 2016-17.
3 Table 1.1: Food grains production (In lakh MT.)
Food Grains 2009-10 2010-11 2011-12 2012-13 2013-14 2014-15 2015-16 2016-17 2017-18
Aus 21 22.18 21.33 23.33 21.58 23.26 23.28 22.89 21.33
Aman 122.25 126.6 127.91 127.98 128.97 130.23 131.9 134.83 136.56
Boro rice 182.87 185.25 186.17 187.59 187.78 190.07 191.92 189.38 180.24
Total Rice 326.12 334.03 335.41 338.9 338.33 343.56 347.1 347.1 338.13
Wheat 9.58 10.39 9.72 9.95 12.55 13.02 13.48 13.48 14.23
Maize 11.37 13.7 15.52 19.54 21.78 25.16 23.61 27.59 35.78
Total 347.07 358.12 360.65 368.39 372.66 381.74 384.2 388.17 388.14
Source: Bangladesh Bureau of Statistics (BBS) and DAE
4 1.3 Importance of boro rice
Rice is the amazing food grain that shapes the diets, culture, economy and the way of life in Bangladesh. It is the staple food for entire 155.8 million people. Keeping this in mind, since the independence all the successive governments have given high priority for attaining self-sufficiency in food production. The development of high yielding modern grain varieties of rice which are highly responsive to inorganic fertilizer and insecticides, effective soil management and water control helped the country to meet the increasing food grain (Hayami and Ruttan, 1985). Among the high yielding varieties boro rice varieties have maximum share to the total rice production which is more or less stable over the last decades. Rice is the staple food for the general people of Bangladesh.
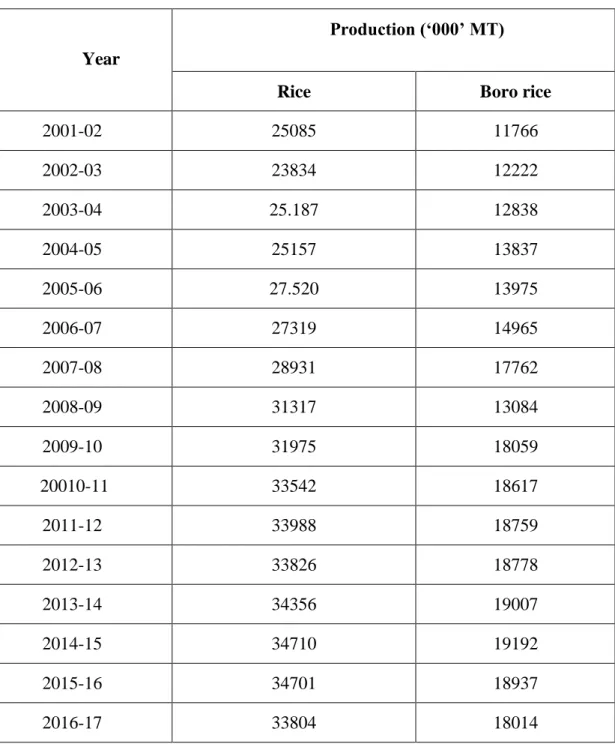
Accordingly, the demand for rice is constantly rising and 2.3 million people being added each year to its total population. Rice constitutes about 70 percent of total calorie intake for the people particularly for hard working people. Rice covers an area of about 11.53 million hectares and is by far the most important provider of rural employment (HIES, 2005 and BBS, 2006). The area, production and yield rate of rice, in general and boro rice, in particular, for different years were shown in Table 1.2.
5
Table 1.2: Area and production of rice and boro rice by different years
Year
Production (‘000’ MT)
Rice Boro rice
2001-02 25085 11766
2002-03 23834 12222
2003-04 25.187 12838
2004-05 25157 13837
2005-06 27.520 13975
2006-07 27319 14965
2007-08 28931 17762
2008-09 31317 13084
2009-10 31975 18059
20010-11 33542 18617
2011-12 33988 18759
2012-13 33826 18778
2013-14 34356 19007
2014-15 34710 19192
2015-16 34701 18937
2016-17 33804 18014
Source: BBS, 2018
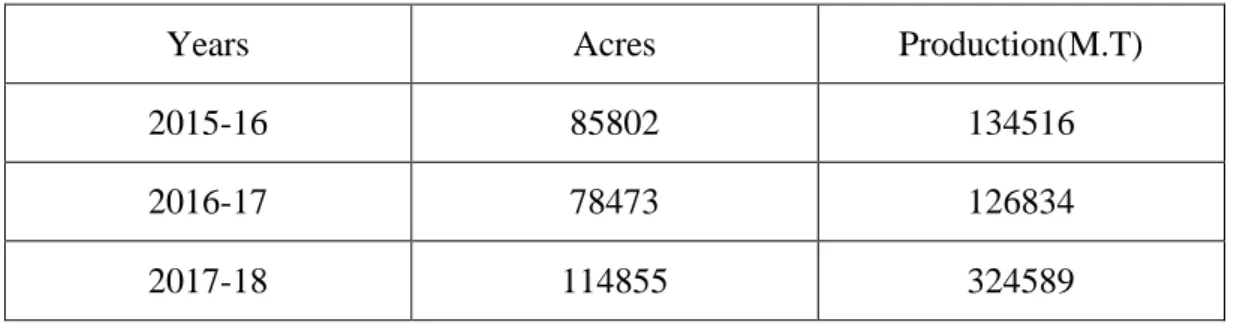
1.4 Boro rice production in Nilphamari
Department of Agricultural Extension (DAE), a total 79443 hectares of land has been brought under the Boro rice cultivation in the district this season and production target is 329671 tons.“boro rice cultivatable land is being tilled by using power tiller and tractor, use of bullock in cultivating land has almost come to an end. Cultivation of this crop totally depends on irrigation.
6
DAE sources a total of 300 deep tube-wells, 29633 shallow tube-wells, 33 power pumps and 1232 irrigation machineries of Teesta Irrigation Project are being used for irrigation purposes in the district.
Table 1.3: Yearly boro rice production in Nilphamari
Years Acres Production(M.T)
2015-16 85802 134516
2016-17 78473 126834
2017-18 114855 324589
Source: Agriculture year book, 2018
1.5 Nutritive and medicinal value of these crops
Rice is the staple food of over half the world’s population. It is the predominant dietary energy source for 17 countries in Asia and the Pacific, 9 countries in North and South America and 8 countries in Africa. Rice provides 20% of the world’s dietary energy supply, while wheat supplies 19% and maize (corn) 5%. A detailed analysis of nutrient content of rice suggests that the nutrition value of rice varies based on a number of factors. It depends on the strain of rice, that is between white, brown, red, and black (or purple) varieties of rice, each prevalent in different parts of the world. It also depends on nutrient quality of the soil rice is grown in, whether and how the rice is polished or processed, the manner it is enriched, and how it is prepared before consumption.
About 40 percent of the world’s population derives most of their calories from rice.
Almost 90 percent of the population of Bangladesh, Myanmar, Sri Lanka, Vietnam and Kampuchea are rice eaters. Rice is interwoven with Bengali culture.
7 Table 1.4: Nutrients from per 100 gm rice
Composition Rice
Calories (k. calorie) 325
Moisture content (percent) 13.3
Carbohydrate (percent) 79
Protein (gm) 6.4
Fat (gm) 0.4
Β-carotine (µg) 0
Vitamin B (mg) 0
Thiamin 0.21
Riboflovine 0.09
Vitamin C (mg) 0
Calcium (Ca) (mg) 9
Iron (Fe) (mg) 1
Source: Bose and Som, 1986; Wahed and Anjan, 2008
It is the symbol of wealth. The food department of the government of Bangladesh recommends 410 gm of rice/head/day.
The opportunity cost of food imports may be high in terms of lower investment and consequently reduced rate of economic growth (Ghatak and Ingersent, 1984, p. 32).
The overall performance of the economy is, therefore, yet intricately linked to the performance of the agricultural sector (Matin, 2004). Hence, it is evident that Bangladesh should develop its agriculture sector to attain economic development.
The total area of Bangladesh is about 14.845 million hectares of which 53.89 percent is cultivable, 3.16 percent is current fallow land and rest 42.95 percent is covered by homesteads, rivers, tidal creeks, lakes, ponds, roads, etc. (BER, 2015). So there is a little scope left to increase agricultural output by bringing new land under cultivation.
Increase in agricultural output could be attained, however, by using High Yielding Varieties (HYV) and adopting improved cultural and management practices. In the past, growth of agriculture in Bangladesh has centered on food grain production rice alone
8
comprises over 90 percent of that growth. Massive increase in rice production led to the decline in area of tubers, pulses, spices, oilseeds, roots, and other minor crops (Baset, 2003). Thus Bangladesh has to import spices at the cost of its hard earned foreign currency.
Realizing the importance of minor crops for the improvement of nutritional status of the people, the government of Bangladesh has taken a crop diversification program (CDP) in the sixth five-year plan (2011-2015). Under the CDP strategy, emphasis was placed to increase production and consumption of those nutrient rich foods. The diversification has not yet taken place adequately within the crop sector, which is still dominated by the production of cereals.
In order to explore the potentials and possibilities of expansion in the acreage and production of the minor crops, it is, therefore, important to examine the past performance of the crops; to analyze the profitability of those crops in order that all these activities would reveal necessary information before farmers, researchers, planners and so on to take unique steps forward to increase both the acreage and production of boro rice in Bangladesh.
1.6 Justification of the study
Rice is the staple food of about 135 million people of Bangladesh. It provides nearly 48% of rural employment, about two-third of total calorie supply and about one-half of the total protein intake of an average person in the country. Rice sector contributes one- half of the agricultural GDP and one-sixth of the national income in Bangladesh.
Almost all of the 13 million farm families of the country grow rice. Rice is grown on about 10.5 million hectares which has remained almost stable over the past three decades. About 75% of the total cropped area and over 80% of the total irrigated area is planted to rice. Thus, rice plays a vital role in the livelihood of the people of Bangladesh.
Total rice production in Bangladesh was about 10.59 million tons in the year 1971 when the country’s population was only about 70.88 millions. However, the country is now producing about 25.0 million tons to feed her 135 million people. This indicates that the growth of rice production was much faster than the growth of population. This increased rice production has been possible largely due to the adoption of modern rice varieties on around 66% of the rice land which contributes to about 73% of the
9
country’s total rice production. However, there is no reason to be complacent. The population of Bangladesh is still growing by two million every year and may increase by another 30 million over the next 20 years. Thus, Bangladesh will require about 27.26 million tons of rice for the year 2020. During this time total rice area will also shrink to 10.28 million hectares. Rice yield therefore, needs to be increased from the present 2.74 to 3.74 t/ha. The weather condition for boro rice cultivation was favorable in the growing stage this year.
But due to flash flood in some northern districts (boro rice) crop under 40,198 hectares of land was fully damaged for FY 2015-16. In a subjective manner, farmers were interviewed on some points relating to management system of seed, fertilizer and rural electricity supply. They opined that proper management and timely distribution of seed, fertilizer and stable supply of electricity led to higher yield of boro rice this year.
1.7 Specific objectives of the study
In view of the problem as stated above, the following specific objectives were formulated for giving proper direction to the study:
a) to determine and describe some selected characteristic of the boro rice cultivators
b) to determine the profitability of boro rice production c) to analyze technical efficiency of boro rice growers
d) to draw conclusions and formulate some recommendations for necessary interventions with a view to increasing production of boro rice
1.8 Limitations of the study
There are some limitations of the study thus are indicated below.
a. Most of the data were collected through interview of the farmers and sometimes they did not well-cooperate with the interviewer.
b. The information were gathered mostly through the memories of the farmers which were not always correct.
c. Due to resource and time constraints, broad based and in-depth study was hampered to some extent.
10 CHAPTER II
REVIEW OF LITERATURE
In this chapter, an attempt has been made to review of pertinent literature keeping in view the problem entitled, “Profitability and technical efficiency of boro rice production in some selected areas of Nilphamari district in Bangladesh.” Again, some of these studies may not entirely relevant to the present study, but their findings, methodology of analysis and suggestions have a great influence on the present study.
Review of some research works relevant to the present studies, which have been conducted in the recent past, are discussed below.
Akter (2011) studied on profitability and resource use efficiency of BRRI Dhan29 in old Brahmaputra floodplain area of Tangail district with a sample of 60 farmers using cobb-douglas production function and found that total return of BRRI Dhan29 was higher than total cost.
Banu (2011) studied on economic analysis of BR-28, BR-29 and Hybrid Hira rice production in Kurigram district with a sample of 90 farmers considering cobb-douglas production function and found that Hybrid Hira was more profitable than BR-28 and BR-29 rice as the net return was much higher than BR-28 and BR-29.
Kamruzzaman (2011) studied on economic potential of BRRI Dhan-51 and BR-11 rice production in Rangpur district with a sample of 60 farmers considering Cobb Douglas production function and found that BRRI Dhan-51 had higher gross return than BR-11.
Kana (2011) studied on economic analysis of salt tolerant Binadhan-8 and HYV BRRI Dhan28 rice production in Satkhira district with a sample of 60 respondents using Cobb Douglas production function and found that total return of Binadhan-8 was greater than total return of BR-28.
Ahmed (2009) conducted a comparative economic analysis of boro rice. Boro rice cultivation was more profitable than boro rice cultivation. Per hectare average yield of boro rice were 6000 kg and 16302 kg, respectively. Per hectare total cost of production, gross margin and net margin of boro rice were Tk. 58202.74, Tk. 39402.2 and Tk.
24117.26, respectively. On the other hand, the corresponding figures for producing boro rice were Tk. 120221.71, Tk. 155436.23 and Tk. 142403.51, respectively.
11
Hanifa (2009) studied on economic analysis of BR-29 and Hybrid Hira rice production in Netrokona district with a sample of 80 farmers using cobb-douglas production function and found that total returns from hybrid Hira rice per hectare was higher than BR-29.
Siddiqui (2008) studied on economic profitability of BRRI Dhan33 and BR-11 rice production in Kurigram district with 60 farmers using cobb-douglas production function and found that gross return for BRRI Dhan33 was higher than BR-11.
Ullah (2008) studied on comparative profitability and technical efficiency of aromatic and non-aromatic aman rice production in Dinajpur district with a sample of 60 farmers using stochastic frontier analysis and found that profitability of BRRI Dhan 34 (aromatic) was much higher than BR-11 rice (non-aromatic) as the total return from BRRI Dhan 34 was higher than BR-11.
Islam et al. (2007) carried out a study to examine the income and price elasticities of demand for different types of rice in Bangladesh. The total budget for cereal field allocated to aromatic, fine, course rice and wheat was 4.0%, 23.3%, 65.2% and 7.5%
respectively. The estimated expenditure elasticities of demand for those types of cereal were 0.85, 0.79, 0.29 and 0.55 respectively.
Majid and Haque (2007) conducted a study on Monga mitigation for employment and food security increase through early aman rice production and crop diversification in greater Rangpur region of Bangladesh. Introducing of cash crop in boro rice growing time (early to late November) contributed more productivity (32.4-39.3 MT/ha) than Rice-Non-Rice system as Rice-Rice (13.2 MT/ha). The highest rice equivalent yield associated with early aman rice-boro rice-Mungbean (37.4 MT/ha) and Early aman rice-boro rice (Bolan/older seedling of BRRI Dhan-33) (32.4-32.6 MT/ha). However, early aman rice-boro rice-Mungbean gave lower productivity than rice-boro rice-Relay maize/maize but mungbean added some biomass in the soil for soil health.
Mondal (2005) attempted to measure and compare resource use, efficiency and relative productivity of farming under different tenurial conditions. It is found that total cash expenses as well as total gross cost producing HYV Boro rice was highest in owner- cum-tenants owned land than in rented in land. When individual inputs were concerned it was observed that expenses on human labour shared a major portion of expenses in the production of HYV boro rice under all tenure groups. The fertilizer cost in owner's
12
own land was significantly different from that of tenant's rented land. It was found that owner farmers were more efficient than owner-cum-tenant and tenant farmers. Again, owner-cum-tenants were more efficient in production in the case of his owned land than in rented in land.
Anik (2003) studied on economic and financial profitability of aromatic and fine rice production in Dinajpur and Sherpur district with a sample of 100 farmers using cobb- douglas production function and found that aromatic rice was more profitable than fine rice as the net return was higher than fine rice.
Thakur (2003) studied on local boro rice and hybrid Boro rice production in Brahmanbaria district with a sample of 60 farmers considering cobb-douglas production function and found that the net return of hybrid boro rice was 15.04% higher than local boro rice.
Quazi and Paul (2002) conducted a study on comparative advantages of crop production in Bangladesh. In their study, the economic profitability analysis demonstrates that Bangladesh has a comparative advantage in domestic production of rice for import substitution. However, at the export parity price, economic profitability of rice is generally less than economic profitability of many non-rice crops, implying that Bangladesh has more profitable options other than production for rice export.
Several non-cereal crops, including vegetables, boro ricees and onions have financial and economic returns that are as high as or higher than those of High Yielding Variety (HYV) rice.
Rahman et al. (2002) attempted to measure the technical efficiencies obtained by owner operated farming and share cropping for boro rice, aus and aman rice were 86 percent, 93 percent and 80 percent, respectively whereas mean technical efficiencies obtained by sharecroppers for boro rice, aus and aman rice were respectively 73 percent, 76 percent and 72 percent. The study reveals that owner operators were technically more efficient than sharecroppers in the production of all the rice crops. To reduce the difference of technical efficiencies between owner operator and sharecropper a perfect leasing system is inevitable.
Zaman (2002) conducted a study to accomplish a comparative analysis of resource productivity and adoption of modern technology under owner and tenant farms. It was found that gross cost for producing HYV Boro rice were the highest in owner farms
13
and the lowest in tenant farms. Owner operators used more hired labour where tenant operators used more family labour. The maximum return over total cost per hectare was obtained by owner operators and minimum by tenant operators. It was also observed that owner operators were more efficient than tenant operators.
It was also observed that owner operators were more efficient than tenant operators; it was also found that the degrees of adequacy level in the application of modern farm inputs were higher in owner farms than in tenant farms.
Akter (2001) conducted a study on relative profitability of alternate cropping patterns under irrigation condition in some selected area of Barguna district. The relative profitability of 5 dominant cropping patterns in two villages of Barguna district Bangladesh was assessed. The cropping patterns considered were (1) T. Aus Rice-T.
Aman rice-HYV Boro rice; (2) T. Aus rice-T. Aman rice-wheat; (3) T. Aman rice-Jute- HYV Boro rice; (4) T. Aman rice -chilli-fallow; and (5) T. Aman Rice-Jute-Boro rice.
Data were obtained through interviews with 60 farmers 10 farmers from each cropping pattern during June-August 2000. Cropping pattern 1 had the highest per hectare gross margin (Tk. 43312) and net return (Tk. 27643). While cropping pattern 4 had the lowest gross margin (Tk. 29575) and net return (Tk. 19000). The inclusion of HYV boro rice as a third crop in the cropping pattern increased bom income and employment.
Islam (2001) studied on economic potential of Bina-6 rice production in Mymensingh district with a sample of 55 farmers considering cobb-douglas production function and found that BINA-6 rice production was profitable because the total return was much higher than total cost of production.
Ali (2000) attempted to measure and compare resource use and land productivity within tenure groups. Total gross cost for producing aman, boro rice and aus were the highest in owner farms and the lowest in tenant farms. It observed that owner operators used higher level of inputs than owner-cum-tenant and tenant operators. Rice owner-cum- tenant operators obtained higher yield in aman and aus production then owner and tenant operators. In boro rice paddy production tenant operators obtained maximum net return than owner operators and owner-cum- tenant operators in owner land. Finally, it was concluded that tenancy affects positively on resource use and production in a predictable fashion even in small scale peasant agriculture.
14
Hasan (2000) studied on the economic potential of alok hybrid rice and found that per hectare total cost for hybrid alok was Tk. 36,276.33 per hectare variable cost was calculated as Tk. 2,927.05 and per hectare yield was 6,557.07 kg. The price of alok paddy was Tk. 7.81/kg. Taking the by product into account the gross return of hybrid alok per hectare was Tk. 5,465.02. The net return per hectare was Tk. 18,375.50 and the gross margin was Tk. 26,409.97.
Mustafi and Azad (2000) conducted a study on adoption of modern rice varieties in Bangladesh. They examined the comparative profitability of BR-28 and BR-29 and found that the average yields 5,980 kg and 6,670 kg per hectare respectively. The gross margin was higher for BR-29 which was Tk. 27,717.02 per hectare. The farm level data also showed that the unit cost of BR-29 and BR-28 were Tk. 4.70 and Tk. 5.12 per kg.
They also compared to BR-28 return from BR-29 is higher by Tk. 3,759 per hectare
15 CHAPTER III METHODOLOGY 3.1. Introduction
Farm management research depends on the proper methodology of the study. Proper methodology is a prerequisite of a good research. The design of any survey is predominantly determined by the nature, aims, and objectives of the study. It also depends on the availability of necessary resources, materials and time. There are several methods of collecting data for farm management research. A farm business study usually involves collection of information from individual farmers; collection of data for farm business analysis involves judgment of the analyst in the selection of data collection methods within the limits imposed by the resources available for the work (Dillon and Hardaker 1993). In this study, “survey method" was employed mainly due to two reasons:
i. Survey enables quick investigations of large number of cases; and ii. Its results have wider applicability.
The major disadvantage of the survey method is that the investigator has to rely upon the memory of the farmers. To overcome this problem, repeated visits were made to collect data in the study area and in the case of any omission or contradiction the farmers were revisited to obtain the `missing and/or correct information. The design of the survey for the present study involved the following steps.
3.2. Selection of the study area
Selection of the study area is an important step for farm management study. The selection of an area fulfilled the particular purpose which was set for the study and also the possible cooperation from the farmer. Although Boro rice is grown all over Bangladesh, The district Nagoan, Bogura , Nilphamari as well as Nilphamari and most of the northern area of Bangladesh are the important districts where it is grown quite extensively.
So, on the basis of higher concentration of boro rice production, 3 big upazila namely Dimla, Domar and Jaldhaka, under Nilphamari district were purposively selected for the study. The main reasons in selecting the study area were as follows:
16
a) Availability of a large number of boro rice growers in the study area;
b) These villages had some identical physical characteristics like topography, soil and climatic conditions for producing boro rice.
c) Easy accessibility and good communication facilities in these villages; and d) Co-operation from the respondents was expected to be high so that the reliable data would be obtained.
3.3. Sampling technique and sample size
In selecting samples for a study two factors need to be taken into consideration. The sample size should be as large as to allow for adequate degrees of freedom in the statistical analysis. On the other hand, administration of field research, processing and analysis of data should be manageable within the limitation imposed by physical, human and financial resources (Mannan, 2001). However, because of diversity in the technical and human environment, it is necessary to sample several numbers of the population before any conclusion can be drawn. Therefore, the purpose of sampling is to select a sub-set of the population that is representative of the population (Rahman, 2000).
It was not possible to include all the farmers of the study area due to limitation of time, money and personnel. In total 70 farmers were randomly selected. A purposive random sampling technique was followed in the present study for minimizing cost, time and to achieve the ultimate objectives of the study.
3.4 Data collection
As data collection has a noteworthy impact on the quality of survey results, it is treated as a significant part of a survey. Considering its importance, the following measures were taken during the preparation of questionnaire as the tool of data collection:
3.4.1. Questionnaire design
A questionnaire is a powerful evaluation tool that allows the collection of data through the use of multi-dimensional questions. A questionnaire written without a clear goal and purpose is inevitably going to overlook important issues and waste enumerators’ as well as respondents’ time by asking and responding useless questions. All these matters were addressed to the extent possible for developing the questionnaire of survey.
17 3.4.2. Pre-testing the questionnaire
The questionnaire was pre-tested to examine the time necessary to complete the interview, test the reliability i.e. whether it captured the information desired, and also investigated the consistency whether the information gathered by it was related to the whole purpose of the survey. The test had also targeted to check the logistics required for successful operation of the survey. In order to ensure the best performance of the questionnaire in respect of data collection, processing and analyzing, the pre-testing was carried out during the month of December 2018 and January 2019 prior to the survey at rural area of namely Dimla, Domar and Jaldhaka, under Nilphamari District.
Myself chosen some of the farmers at random as the respondents.
3.4.3. Finalization of the questionnaire & method of data collection
After addressing all the changes following the recommendations evolved from the pre- test, the questionnaire was placed to supervisor. She also put notable contribution to the questionnaire. Eventually, the questionnaire had been finalized with the approval. Face to face interview had been carried out following questionnaire.
3.4.4. Data editing and coding data editing and coding
Data editing and coding data editing and coding were other vital phases of the survey, which were indispensable for data processing. It should be completed before data processing. In case of this survey coding had been done along with questionnaire development so that the enumerator could easily and accurately mark the right answers.
Data editing referred to the activity of checking and cleaning data that had already been collected from the field.
3.5. Data processing
Data processing involved many steps that were very important because it affected survey results according to the involved steps. During data processing following steps had been taken.
i. Data entry
ii. Appending and merging files
iii. Data validation (further computer checking, editing, and imputation)
18 iv. Final decision on errors
v. Completion of data processing and generation of data files vi. Final documentations
vii. Conversion of data files to another software.
viii. Storage of all files.
3.6. Processing, tabulation and analysis of data
The collected data were manually edited and coded. Then all the collected data were summarized and scrutinized carefully. Moreover, data entry was made in computer and analyses were done using the concerned software Microsoft Excel and STATA. It may be noted here that information was collected initially in local units. After necessary checking it was converted into standard international units.
3.7. Analytical techniques
Data were analyzed with a view to achieving the objectives of the study. Several analytical methods were employed in the present study. Tabular method was used for a substantial part of data analysis. This technique is intensively used for its inherent quality of purporting the true picture of the farm economy in the simplest form.
Relatively simple statistical techniques such as percentage and arithmetic mean or average were employed to analyze data and to describe socioeconomic characteristics of boro rice growers, input use, costs and returns of boro rice production and to calculate undiscounted benefit cost ratio (BCR).
In order to estimate the level of technical efficiency in a manner consistent with the theory of production function, cobb-douglas type stochastic frontier production function was used in the present study.
3.7.1 Profitability analysis
The net returns of boro rice were estimated using the set of financial prices. The financial prices were market prices actually received by farmers for outputs and paid for purchased inputs during the period under consideration in this study. The cost items identified for the study were as follows-
i. Land preparation
19 ii. Human labor
iii. Seedlings iv. Urea
v. TSP vi. MoP vii. Insecticide viii. Irrigation
ix. Interest on operating capital x. Land use
The returns from the crops were estimated based on the value of main products. In this study variable cost, fixed cost and total cost had been described. Total variable cost (TVC) included land preparation, human labor, seedlings, organic manure, urea, TSP, MoP, insecticides, irrigation and interest on operating capital. Fixed cost (FC) included only rental value of land. Total cost (TC) included total variable cost and fixed cost.
3.7.1.1 Cost of land preparation
Land preparation considered one of the most important components in the production process. Land preparation for boro rice production included ploughing, laddering and other activities needed to make the soil suitable for planting seedling. It was revealed that the number of ploughing varied from farm to farm and location to location.
3.7.1.2 Cost of human labor
Human labor cost was considered one of the major cost components in the production process. It is generally required for different operations such as land preparation, sowing and transplanting, weeding, fertilizer and insecticides application, irrigation, harvesting and carrying, threshing, cleaning, drying, storing etc. In order to calculate human labor cost, the recorded man-days per hectare were multiplied by the wage per man-day for a particular operation.
3.7.1.3 Cost of seed
Cost of seed varied widely depending on its quality and availability. Market prices of seeds of respected boro rice were used to compute cost of seed. The total quantity of
20
seed needed per hectare was multiplied by the market price of seed to calculate the cost of seeds for the study areas.
3.7.1.4 Cost of urea
Urea was one of the important fertilizers in boro rice production. The cost of urea was computed on the basis of market price. In order to calculate cost of urea the recorded unit of urea per hectare were multiplied by the market price of urea.
3.7.1.5 Cost of TSP
The cost of TSP was also computed on the basis of market price. In order to calculate cost of TSP the recorded unit of TSP per hectare were multiplied by the market price of TSP.
3.7.1.6 Cost of MoP
Among the three main fertilizers used in boro rice production, MoP was one of them.
To calculate the cost of MoP per hectare, the market price of MoP was multiplied by per unit of that input per hectare for a particular operation.
3.7.1.7 Cost of insecticides
Farmers used different kinds of insecticides for 5-7 times to keep their crop free from pests and diseases. Cost of insecticides was calculated based on the market price of the insecticides which was used in the study areas per hectare.
3.7.1.8 Cost of irrigation
Water management helps to increase boro rice production. Cost of irrigation varies from farmers to farmers. It was calculated based on how many times irrigation was needed per hectare and what was its cost.
3.7.1.9 Interest on operating capital
Interest on operating capital was determined on the basis of opportunity cost principle.
The operating capital actually represented the average operating cost over the period because all costs were not incurred at the beginning or at any single point of time. The cost was incurred throughout the whole production period;
21
Hence, at the rate of 12 percent per annum interest on operating capital for four months was computed for Boro rice. Interest on operating capital was calculated by using the following formula:
IOC= AIit Where,
IOC= Interest on operating capital i= Rate of interest
AI= Total investment / 2 t = Total time period of a cycle
3.7.1.10 Land use costs
Land use cost was calculated on the basis of opportunity cost of the use of land per hectare for the cropping period of four months. So, cash rental value of land has been used for cost of land use.
3.7.1.11 Calculation of returns Gross return
Per hectare gross return was calculated by multiplying the total amount of product and by-product by their respective per unit prices.
Gross return= Quantity of the product * Average price of the product + Value of by- product.
Gross margin
Gross margin is defined as the difference between gross return and variable costs.
Generally, farmers want maximum return over variable cost of production. The argument for using the gross margin analysis is that the farmers are interested to get returns over variable cost. Gross margin was calculated on TVC basis.
Per hectare gross margin was obtained by subtracting variable costs from gross return.
That is,
Gross margin = Gross return – Variable cost
22 Net return
Net return or profit was calculated by deducting the total production cost from the total return or gross return. That is,
Net return = Total return – Total production cost.
3.8.1.12 Undiscounted benefit cost ratio (BCR)
Average return to each taka spent on production is an important criterion for measuring profitability. Undiscounted BCR was estimated as the ratio of total return to total cost per hectare.
BCR = Total return (Gross return)/ Total cost 3.7.2 Technical efficiency analysis
Technical efficiency refers to the ability of a firm to produce the maximum possible output from a given set of inputs and given technology. A technically efficient farm will operate on its frontier production function. Given the stated relationship the firm is technically efficient if it produces on its outer-bound production function to obtain the maximum possible output which is feasible under the current technology. Putting it differently a firm is considered to be technically efficient if it operates at a point on an isoquant rather than interior to the isoquant. The homogeneity of inputs is a vital factor for achieving technically efficient output.
No one would dispute that the output produced from given inputs is a genuine measure of efficiency, but there is room for doubt whether, in a particular application, the inputs of a given firm are really the same as those represented by the corresponding point on the efficient isoquant. But it is important to note that mere heterogeneity of factors will not matter, as long as it is spread evenly over firms, it is when there are differences between firms in the average quality (or more strictly, in the distribution of qualities) of a factor, that a firm's technical efficiency will reflect the quality of its inputs as well as the efficiency of its management.
3.7.2.1 The stochastic frontier models
The most widely discussed, theoretically reasonable and empirically competent method of measuring efficiency is the stochastic frontier model. It is an improvement on the
23
traditional average production function and on all types of deterministic frontiers in the sense that it introduces in addition to one-sided error component a symmetric error term to the model. This permits random variation of the frontier across farms, and captures the effects of measurement error, other statistical noise arid random shocks outside the firm's control. A one-sided component captures the effects of inefficiency relative to the stochastic frontier. The stochastic frontier model is also called the 'composed error' model introduced by Aigner, Lovell and Schmidt (1977). It was later extended and elaborated by Jondrow et al. (1982).
The notion of a deterministic frontier shared by all farms ignores the very real possibility that a farm’s performance may be affected by factors entirely outside its control (such as poor machine performance, bad weather, input supply breakdowns, and so on), as well as by factors under its control (inefficiency). But stochastic frontiers consider all the factors while estimating the model and accordingly it separates firm- specific efficiency and random error effect. Thus the efficiency measurements as well as the estimated parameters are unbiased.
3.7.2.2 The stochastic frontier with cobb-douglas production function
The cobb-douglas production function is probably the most widely used form for fitting agricultural production data, because of its mathematical properties, ease of interpretation and computational simplicity (Heady and Dillion, 1969; Fuss and Mcfadden, 1978). The cobb-douglas function has convex isoquants, but as it has unitary elasticity of substitution; it does not allow for technically independent or competitive factors, nor does it allow for Stages I and III along with Stage II. That is, MPP and APP are monotonically decreasing functions for all X- the entire factor-factor space is Stage II-given 0 < b < 1, which is the usual case.
However, the cobb-douglas may be good approximation for the production processes for which factors are imperfect substitutes over the entire range of input values. Also, the cobb-douglas is relatively easy to estimate because in logarithmic form it is linear in parameters; it is parsimonious in parameters (Beattie and Taylor, 1985).
A stochastic cobb-douglas production frontier model may be written as Yi = f(Xi,β) exp.(Vi-Ui) i = 1, 2, 3, ……….., N
24
Where the stochastic production frontier is f(Xi,β)exp.(Vi), Vi having some symmetric distribution to capture the random effects of measurement error and exogenous shocks which cause the placement of the deterministic kernel f(Xi,β) to vary across firms.
The technical inefficiency relative to the stochastic production frontier is then captured by the one-sided error component Ui > 0.
The explicit form of the stochastic cobb-douglas production frontier is given by 𝑌𝑖 = 𝛼𝑋1𝑖𝛽1 𝑋2𝑖𝛽2 𝑋3𝑖𝛽3 𝑋4𝑖𝛽4 𝑋5𝑖𝛽5 𝑋6𝑖𝛽6 𝑒𝑢𝑖
Where Y is the frontier output, X is physical input, b the elasticity of Y with respect to X, a is intercept and Ɛ = V-U is a composed error term as defined earlier. For simplicity, we have ignored the subscript.
3.7.2.3 Specification of production model
We have specified the cobb-douglas stochastic frontier production function in order to estimate the level of technical efficiency. The functional form of stochastic frontier is as follows:
Y = β0 X1β1 X2β2 ……….X6β6 eVi-Ui The above function is linearized double-log form:
lnY = lnβ0 + β1lnX1 + β2lnX2 + β3lnX3 + β4lnX4+ β5lnX5+ β6lnX6+Vi-Ui Where,
Y = Output (kg/ha)
X1 = Human labour (man days/ha) X2 = Seed (Kg/ha),
X3= Urea (kg/ha) X4= TSP (Tk/ha)
X5 = Cost of insecticide (Tk./ha) X6 = Irrigation cost (Tk./ha).
The model of the technical inefficiency effects in the stochastic production frontier equation is defined by
Ui = δ0 + δ1Z1+ δ2Z2+ δ3Z3+ δ4Z4+ δ5Z5+ + Wi Where,
Z1…….. Z5 are explanatory variables.
25 The equation can be written as:
Ui = δ0 + δ1 Boro rice farming experience + δ2 Farm size + δ3 Extension service + δ4 Training + δ5Taking loan + Wi
V is two-sided uniform random variable beyond the control of farmer having N (0, σ 2) distribution, U is one-sided technical inefficiency effect under the control of farmer having a positive half normal distribution {Ui∼|N (0, σu2)|} and Wi is two-sided uniform random variable. W is unobservable random variable having a positive half normal distribution. The model was estimated simultaneously using STATA and MS excel.
26 CHAPTER IV
DESCRIPTION OF THE STUDY AREA 4.1 Introduction
This chapter presents a brief description of the study area. Knowledge of the study area is very essential to understand the location, physical features and topography, soil type, temperature, rainfall, agricultural and economic condition, population, education and other socioeconomic infrastructure available in the area. This chapter aims at present the above-mentioned characteristics of the study area.
4.2 Location
The study was conducted on some villages of three Upazila namely Dimla, Domar, Jaldhaka under Nilphamari District. Nilphamari district was one of the sub-divisions of Rangpur District. It was upgraded to a district in 1984. Nothing is definitely known about the origin of the district name. But it is said that the present place of the district was once prominent for Nil (Indigo) cultivation. A big Nil 'Khamar'(meaning farm) was set up here, as such the area was called Nilkhamari. The present name of the district Nilphamari is the phonetic corruption of the original name Nilkhamari. Nilphamari district is surrounded on the north by West Bengal State of India, east by Lalmonirhat District and Rangpur District, south by Rangpur District and Dinajpur District and west by Nilphamari District and Dinajpur District. It lies between 25º44' and 26º19' north latitudes and between 88º44' and 89º12' east longitudes. The total area of the district is 1546.59 sq. km. (597.00 sq. miles) of which 33.54 sq. km. (12.95 sq. miles) is riverine and 6.26 sq. km (2.42 sq. miles) is under forest. Tista Barrage Project, one of the biggest irrigation projects of the country, begins from Dalia of this district.
4.3 Physical features, topography and soil type
The Nilphamari district is consist of two agro-ecological zones Active Tista Floodplain (02) and Tista Meander Floodplain (03). Active Tista Floodplain (830 sq km) this region includes the active floodplains of the TISTA, DHARLA and DUDHKUMAR rivers. It has complex patterns of low, generally smooth ridges, inter-ridge depressions, river channels and cut-off channels.
27
The area has irregular patterns of grey stratified SANDS and SILTS. They are moderately acidic throughout and parent alluvium is medium in weatherable K minerals. Four general soil types occur in the region, and of them, non-calcareous alluvium predominates. Organic matter contents and SOIL FERTILITY level are low to medium.
Tista Meander Floodplain (9,468 sq km) this region occupies the major part of the Tista floodplain as well as the floodplain of the ATRAI, LITTLE JAMUNA, KARATOYA, Dharla and Dudhkumar rivers. Most areas have broad floodplain ridges and almost level basins. There is an overall pattern of olive brown, rapidly permeable, loamy soils on the floodplain ridges, and grey or dark grey, slowly permeable, heavy silt loam or silty clay loam soils on the lower land and PARENT MATERIALS medium in weatherable K minerals. Eight general soil types occur in the region, moderately acidic throughout, low in organic matter content on the higher land, but moderate in the lower parts.
Fertility level is low to medium. Soils, in general, have good moisture holding capacity.
Figure 4.1: Map of Nilphamari district
28 4.4 General information of study area
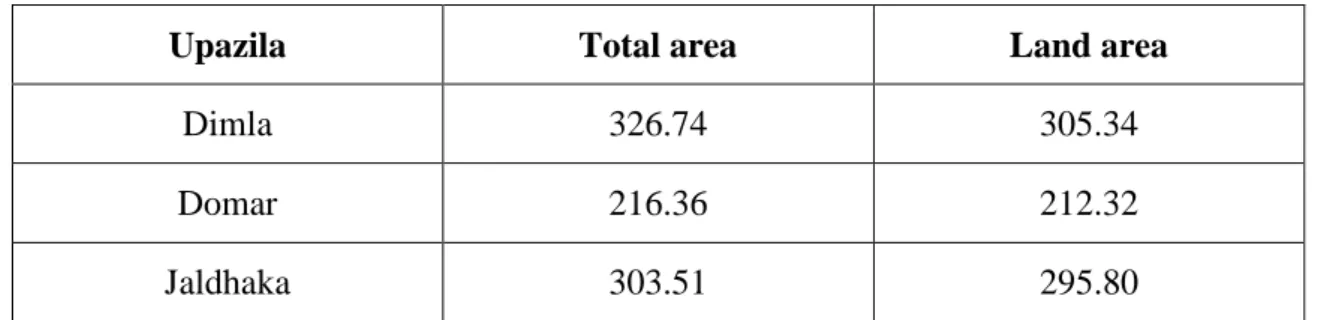
Table 4.1: Broad classification of study area (In sq. km.)
Upazila Total area Land area
Dimla 326.74 305.34
Domar 216.36 212.32
Jaldhaka 303.51 295.80
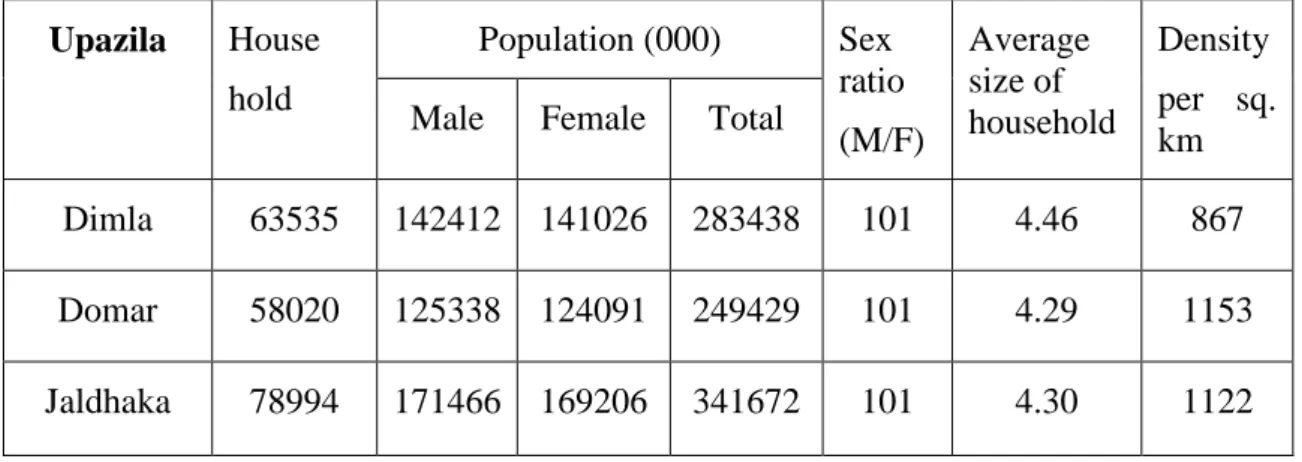
Table 4.2: Number of household, population and density of study area Upazila House
hold
Population (000) Sex ratio (M/F)
Average size of household
Density per sq.
Male Female Total km
Dimla 63535 142412 141026 283438 101 4.46 867
Domar 58020 125338 124091 249429 101 4.29 1153
Jaldhaka 78994 171466 169206 341672 101 4.30 1122
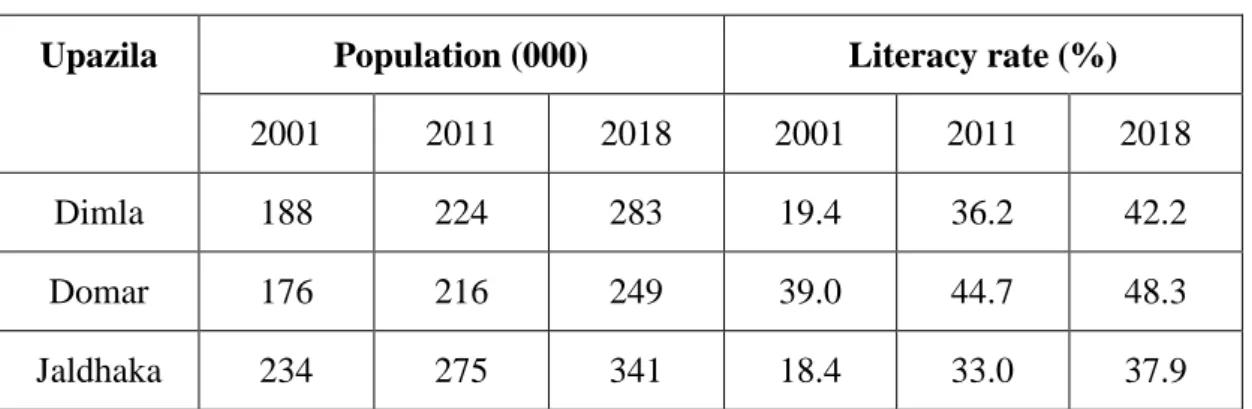
Table 4.3: Population and literacy rate of study area
Upazila Population (000) Literacy rate (%)
2001 2011 2018 2001 2011 2018
Dimla 188 224 283 19.4 36.2 42.2
Domar 176 216 249 39.0 44.7 48.3
Jaldhaka 234 275 341 18.4 33.0 37.9
29 4.5 Climate
The data of the last 35 years of some areas of the northwestern region, it was found that the trend in temperature rise in summer over 1981 to 2016 is very high. On average, the temperature in the summer is 36 degrees celsius. However, in some cases it went up to 42 degrees. It is estimated that in the coming years, it will go up by 2/3 degrees more.
In the same way, we see abrupt changes in rainfall as well. The average rainfall in a year remains the same over the years but the timing is changing; sometimes there is more rainfall before the rainy season but less during. The annual average temperature of the district varies maximum 32.3°C to minimum 11.2°C and the annual average rainfall of the district is recorded 2931 mm. We are seeing reflections of the same findings in our household surveys and participatory research studies conducted in the region. This coalescence will help to do a proper vulnerability analysis and find an effective adaptation strategy. Also shows that the indigenous people of the northwest are suffering from food insecurity. They remain unemployed for six months. They don’t have enough means to buy three meals. Their food basket is also very narrow – only carbohydrates. Hence, they suffer from malnutrition which directly affects their ability to work. It is a vicious cycle. They are the worst sufferers of climate change. In the existing patriarchal social structure, women are already in a vulnerable position. The climate change factors are pushing them further into the danger zone.Through effective adaptation strategies for these vulnerable groups. Although they have their own form of adaptation techniques, they are still lagging behind in terms of knowledge, skills and resources. We have pinpointed some specific sectors where they can find employment such as small farming, courtyard vegetation, and poultry.
30
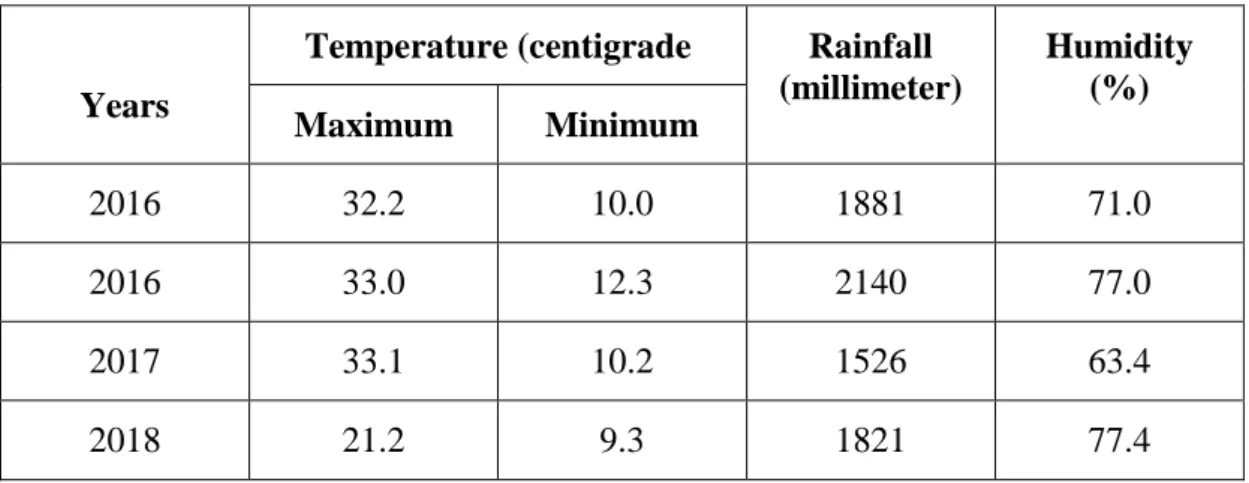
Table 4.4: Temperature, rainfall, humidity of Nilphamari
Years
Temperature (centigrade Rainfall (millimeter)
Humidity (%) Maximum Minimum
2016 32.2 10.0 1881 71.0
2016 33.0 12.3 2140 77.0
2017 33.1 10.2 1526 63.4
2018 21.2 9.3 1821 77.4
Source: Bangladesh Meteorological Department 4.6 Agriculture and economic condition
The economy of Nilphamari is predominately agricultural. Out of total 384629 households of the district 53.09 % holdings are farms which produce varieties of crops namely local and HYV rice, wheat, jute, tobacco, Boro rice vegetables, spices, pulses etc. Various fruits like mango, jackfruit, litchee, jam, palm betelnut etc are the main fruits of the district. Nilphamari has an agriculture-based economy. Nilphamari produces rice, wheat, Boro rice, tobacco, and many seasonal crops. The major occupation of the people is farming. Among the working population 45.28% are farmers, 27.81% are farm labourers, 3.42% are daily workers, 8.65% are businessmen, 6.07% are government and non-government employers, 8.77% have other occupations.
Varieties of fish are caught from rivers, beels and paddy fields during rainy season. The most common fishes are ruhi, katla mrigal, magur, singi , koi, puti, shoil, gazar, boal etc. All these fishes are economically valuable. Besides these common varieties some other well-known varieties of fish are pangash, airh, bacha, rita batasi, khalisha and chingri or prown are found. Besides crops, livestock and poultry are the subsidiary source of household income of the district. Non-farm activities also play an important role in economic development of Nilphamari district.
Main crops: The major agricultural crops of Nilphamari district are rice, wheat, jute, pulse, oilseed, vegetable, spice, sugarcane, tobacco, etc. Among rice crops aman occupies the largest area followed by aus and boro rice. The fruit crops are banana and coconut. The crop which is very commonly grown and is very special of this district is betel nut.