COMPARATIVE FINANCIAL ANALYSIS AND
RESOURCE USE EFFICIECY OF HIGH YIELDING RICE VARIETIES (HYV's) AND LOCAL RICE VARIETIES OF
TRANSPLANT AMAN (T.AMAN) IN SOME SELECTED AREAS OF NARAIL DISTRICT.
PARTHA PROTIM ROY
DEPARTMENT OF AGRICULTURAL ECONOMICS SHER-E-BANGLA AGRICULTURAL UNIVERSITY
DHAKA-1207
June, 2020
COMPARATIVE FINANCIAL ANALYSIS AND
RESOURCE USE EFFICIECY OF HIGH YIELDING RICE VARIETIES (HYV's) AND LOCAL RICE VARIETIES OF
TRANSPLANT AMAN (T.AMAN) IN SOME SELECTED AREAS OF NARAIL DISTRICT.
BY
PARTHA PROTIM ROY REGISTRATION NO. 13-05670
A Thesis
Submitted to the Faculty of Agribusiness Management, Sher-e-Bangla Agricultural University, Dhaka
in partial fulfillment of the requirements for the degree of
MASTER OF SCIENCE IN
AGRICULTURAL ECONOMICS SEMESTER: JULY-DECEMBER, 2019
Approved by:
(Dr. B.A.A Mustafi) Former Director (Admin) BRRI
Co-Supervisor (Professor Gazi M. A. Jalil)
Professor Supervisor
(Professor Gazi M. A. Jalil) Chairman
Department of Agricultural Economics
CERTIFICATE
This is to certify that thesis entitled, “COMPARATIVE FINANCIAL ANALYSIS AND RESOURCE USE EFFICIECY OF HIGH YIELDING RICE VARIETIES (HYV's) AND LOCAL RICE VARIETIES OF TRANSPLANT AMAN (T.AMAN) IN SOME SELECTED AREAS OF NARAIL DISTRICT.” submitted to the Faculty of Agribusiness Management, Sher-e-Bangla Agricultural University, Dhaka, in partial fulfillment of the requirements for the degree of MASTER OF SCIENCE in AGRICULTURAL ECONOMICS, embodies the result of a piece of bona fide research work carried out by PARTHA PROTIM ROY, Registration No. 13-05670 under my supervision and guidance. No part of the thesis has been submitted for any other degree or diploma.
I further certify that such help or source of information, as has been availed of during the course of this investigation has duly been acknowledged.
Dated:
Place: Dhaka Bangladesh
Professor Gazi M. A. Jalil
Professor
Department of Agricultural Economics Sher-E-Bangla Agricultural University
Dhaka-1207, Bangladesh Mob: +8801552321883 E-mail: [email protected]
Professor Gazi M. A. Jalil Professor
Supervisor
DEDICATED
TO ALL
CORONA
WARRIORS
Page | I ACKNOWLEDGEMENT
At first, I would like to acknowledge the elegance, mercy and profound kindness of
"Lord Krishna" for helping me to materialize this thesis paper. Without his intention it was impossible to perform my thesis work.
I am grateful to honorable chairman and supervisor Professor Gazi M. A. Jalil, Department of Agricultural Economics, Sher-e-Bangla Agricultural University, Dhaka, for his scholastic inspection, helpful explanation, valuable suggestions and constant encouragement from the very beginning to the end of this research work. In spite of having heavy academic pressure, he made himself available whenever I needed his help and suggestions.
My heartfelt liability to my Co-supervisor Dr. B.A.A Mustafi, Former Director (Admin) BRRI, for his kind co-operation and bountiful help in completing this study. His constant encouragement and valuable suggestions helped me much for completing this thesis timely.
I would like to express my heartiest thanks to the farmers whose kind co-operation, patience and valuable information helped me so much during the period of data collection.
I am really proud and exultant for my father and mother for their unbiased affections and for numerous sacrifices they have made for my study.
Last but not the least, my heartiest thanks to my beloved sister, wife and friends for their never ending inspiration throughout the research period.
July, 2020 The Author SAU, Dhaka
Page | II
ABSTRACT
Rice cultivation is one of the oldest agricultural practices for farmers of Narail district.
Transplant and Broadcast both Aman rice are popular for farming here. Some local varieties are so popular that they restrict the popularity of modern Aman rice. By this thesis work we were trying to find out the financial comparison of this two types of Aman rice. This study was conducted during December, 2019. In Narail district there are three upazilas: Narail Sadar upazila, Kalia upazila and Lohagara upazila. The total sample sizes from three upazilas were 60 T. Aman rice cultivators. The number of sample from each upazila was 20 rice cultivators. A simple random sampling procedure was used to select the farmers who cultivate T. Aman rice in this area for collecting the data. In this study, both descriptive and statistical tools were used to analyze the data. The profitability of local and HYV T.Aman cultivation was estimated by using gross margin, net return, and benefit cost analysis. Cob-Douglas production function analysis was used to estimate the significance level of inputs. Then resource use efficiency was calculated in this research. The research found that young energetic farmers were interested in HYV’s cultivation. But the experienced farmers were interested in local varieties cultivation. For local T.Aman varieties gross margin was calculated taka 33508.73 per hectare and for HYV T.Aman varieties gross margin was calculated taka 67304.38 per hectare. Gross margin of HYV’s was calculated 33795.65 taka more than local T.Aman.
On the other hand for local T.Aman net return was calculated taka 18092.77 per hectare and for HYV T.Aman varieties net return was calculated taka 36150.54 per hectare. The net return of HYV’s was calculated 18057.77 taka higher than local T.Aman. Benefit cost ratio for local T.Aman full cost and variable cost basis were calculated 1.56 and 2.98 which were greater than the HYV T.Aman 1.49 and 2.59. The thesis found producing local varieties was profitable here. The effect of land preparation cost, seedling cost and TSP cost were significant for local T.Aman rice. Other taken variables had insignificant effect on local T.Aman rice. Human labor cost, seedling cost, manure cost and supplementary irrigation cost had significant effect on gross return of HYV T,Aman rice.
It was found from resource use efficiency that human labor, seeds, manure and pesticides were over utilized in local T.Aman. Farmars should reduce use of these inputs. Land preparation, Urea, TSP, DAP, Gypsum, ZnSO4 and Irrigation were underutilized and
Page | III farmers should increase use of this inputs to obtain efficiency. On the other hand Seeds, TSP, MOP, Gypsum and ZnSO4 were over utilized in HYV T.Aman. Farmars should reduce use of these inputs. Human labor, Land preparation, Urea, SSP, DAP, Manure, Pesticides and irrigation were underutilized and farmers should increase use of this inputs to obtain efficiency. The problems of cultivating T.Aman were high input price, insufficient credit facilities/ lack of capital, shortage of agricultural labor, high wage rate, poor agronomic practice, lack of scientific knowledge and training, attack by pests and diseases, inadequate and underdeveloped market, lack of storage facilities, natural disaster etc. Government, non-government organizations and other organs of agricultural sectors should take necessary actions to overcome these problems.
Page | IV
CONTENTS TABLE OF CONTENTS
CHAPRER TITLE PAGE NO.
ACKNOWLEDGEMENT I
ABSTRACT II-III
TABLE OF CONTENT IV-VI
LIST OF TABLE VII
LIST OF FIGURES VIII
LIST OF APPENDIX VIII
LIST OF ABBREVIATED TABLE IX
CHAPTER I INTRODUCTION 1-9
1.1 Background 2-5
1.2 History Of Rice Cultivation in Bangladesh 5-7
1.3 Objective Of The Study 8
1.4 Justification Of The Study 8-9
CHAPTER II REVIEW LITARATURE 10-14
CHAPTER III METHODOLOGY 15-20
3.1 Selection Of Study Area 16
3.2 Sample Size 16
3.3 Data Collection 17
3.4 Data Processing and Analysis 17
3.5 Analytical Technique 17-20
CHAPTER IV DESCRIPRION OF THE STUDY AREA 21-27 CHAPTER V SOCIO-ECONOMIC CHARACTERISTICS
OF THE T.AMAN RICE FARMERS
28-34
5.1 Age and Sex Distribution of the Farmers 29-30
5.2 Level of Education of the Respondents 30-31
Page | V
TABLE OF CONTENTS (Contd.)
CHAPRER TITLE PAGE NO.
5.3 Family Size 31
5.4 Distribution of Family Member by Literacy and Sex
32
5.5 Occupational Status of Rice Farmers by Sex 32-33 5.6 Amount of Land Ownership of T.Aman Cultivators 33
5.7 Sources of Fund 34
5.8 Yearly Income of farmers 34
CHAPTER VI COMPARATIVE PROFITABILITY ANALYSIS AND RESOURCE USE EFFECIENCY OF LOCAL T.AMAN AND
HYBRID T.AMAN CULTIVATION
35-49
6.1 Comparative Input Use Pattern of local and HYV T.Aman rice
36-37
6.2 Cost and return Comparison of local T.aman and HYV T.aman
38-42
6.3 Factors Affecting the Yield local And HYV T.Aman
42-46
6.4 Comments for Resource use efficiency 47-49
CHAPTER VII MAJOR PROBLEMS AND CONSTRAINS OF T.AMAN RICE CULTIVATION IN NARAIL
DISTRICT
50-54
7.1 Economic Problems 51-52
7.2 Technical Problems 52-53
7.3 Marketing Problems 53-54
7.4 Social and Other Problems 54
7.5 Others 54
Page | VI
TABLE OF CONTENTS (Contd.)
CHAPRER TITLE PAGE NO.
CHAPTER VIII SUMMARY, CONCLUSION AND RECOMMENDATIONS
55-61
REFERENCES 62-65
APPENDICES 66-76
Page | VII
LIST OF TABLES TABLE
NO.
TITLE PAGE
NO.
Table 1.1 Varieties of Aman cultivated in Narail district 3 Table 1.2 Nutrient content of Rice per 100 g portion 4 Table 1.3 Production of Aman Rice in Bangladesh for last few
years
5
Table 4.1 Upazilas of Narail district 25
Table 4.2 Number of Establishments and Population Engaged by Activity
27
Table 5.1 Age Distribution of the Sample T.Aman Farmers 29
Table 5.2 Level of Education of the Respondents 30
Table 5.3 Family Size of the Respondents 31
Table 5.4 Distribution of Family Member by Literacy 32 Table 5.5 Farmer’s occupation during off-agricultural season 33 Table 5.6 Amount of Land Ownership of T.Aman Rice
Cultivation
33
Table 6.1 Comparative Input Use Pattern of T.Aman Cultivation in Study Area
37
Table 6.2 Comparison of Cost and Return between local T.aman and HYV T.aman in Study Area
40
Table 6.3 Estimated coefficients and their Related Statistics of Production function of local and HYV T. Aman rice
46
Table 6.4 Resource use efficiency of Local and HYV T.Aman 48
Page | VIII
LIST OF FIGURE FIGURE
NO.
TITLE PAGE
NO.
Figure 4.1 Map of Narail district 24
Figure 5.1 Age Distribution of the Sample Local and HYV T.Aman rice Farmers
30
Figure 5.2 Level of Education of the Respondents 31
Figure 6.1 Sources of Fund 34
LIST OF APPENDIX FIGURE
NO.
TITLE PAGE
NO.
Appendix I Interview Schedule 66-74
Appendix II Cobb-Douglas production function output for Local T.Aman
75 Appendix III Cobb-Douglas production function output for HYV
T.Aman 76
Page | IX
LIST OF ABBREVIATED TABLE
$ Dollar
% Percentage
< Less Than
> Greater Than
BCR Benefit Cost Ratio
BBS Bangladesh Bureau of Statistics
BINA Bangladesh Institute of Nuclear Agriculture BRAC Bangladesh Rural Advancement Committee BRRI Bangladesh Rice Research Institute
Cm Centimeter
Contd. Continued
EC Emulsifiable concentrate
et al. et alia (for others)
etc. et cetra
EU European Union
GDP Gross Domestic Product
MLE Maximum likelihood estimation
MS Master of Science
MVP Marginal Value Product
MFC Marginal Factor Cost
N/ha Nitrogen per hectare
NGO Non-Government Organization
SAU Sher-e-Bangla Agricultural University SPSS Statistical Package for the Social Sciences
Tk Taka, Bangladeshi currency
USA United States of America
USG Urea Super Granule
Π Profit per hectare
Page | 1
CHAPTER I
INTRODUCTION
Page | 2 CHAPTER I
INTRODUCTION 1.1 Background
Bangladesh is agriculture based country. In this country about 63 percent people are employed in agriculture and 19.6% GDP of the nation comes from agriculture. (Nations Encyclopedia, 2019) The majority of rural poor people depend on agricultural practice.
The livelihood of this major portion of population is directly and indirectly engaged and fluctuates with agriculture. Agriculture is the part and parcel of Bangladeshi tradition, culture and customs. The land of Bangladesh is very much congenial and fertile for producing different types of cash and food crops. The rain fed river siltation of the land makes it beneficial for producing crops here. Rice is the major food crop and staple food of about 135 million people of Bangladesh. It provides nearly 48 percent of rural employment, about two-third of total calorie supply and about one half of the total protein intake of an average person in the country. Rice sector contributes one half of the agricultural GDP and one sixth of the national income in Bangladesh. (Bangladesh Rice Knowledge Bank)
Rice is the seed of the grass species Oryza glaberrima (African rice) or Oryza sativa (Asian rice). As a cereal grain, it is the most widely consumed staple food for a large part of the world's human population, especially in Asia and Africa. Rice is a monocot plant. It is normally grown as an annual plant but in tropical areas it can survive as a perennial and can produce as ratoon crop for up to 30 years. Rice cultivation is well-suited to countries and regions with low labor costs and high rainfall, as it is labor-intensive to cultivate and requires ample water. However, rice can be grown practically anywhere, even on a steep hill or mountain area with the use of water- controlling terrace systems. The climatic condition of Bangladesh is very much helpful for rice production.
There are three main production seasons of rice named – Aus, Aman and Boro. In Bangladesh, summer, monsoon and winter rice are named after this three rice production seasons. Rice sown in summer along with pre monsoonal rains and harvested in autumn are called as Aus rice. They are mainly rice of summer. Rice sown in rainy season (July -
Page | 3 August) and harvested in winter is called Aman rice. There are also two types of Aman depending on cultural operation. They are transplant Aman and broadcast Aman.
Transplant Aman is named because its seedlings are grown in seedbed then transplanted to the main land after land preparation. But broadcast Aman is directly sown in the main land. Boro rice is sown in winter and harvested in summer. If we distribute the months of a year in this three season of rice production seasons then they are like: Aus (May to July), Aman (August to November) and Boro (December to April).
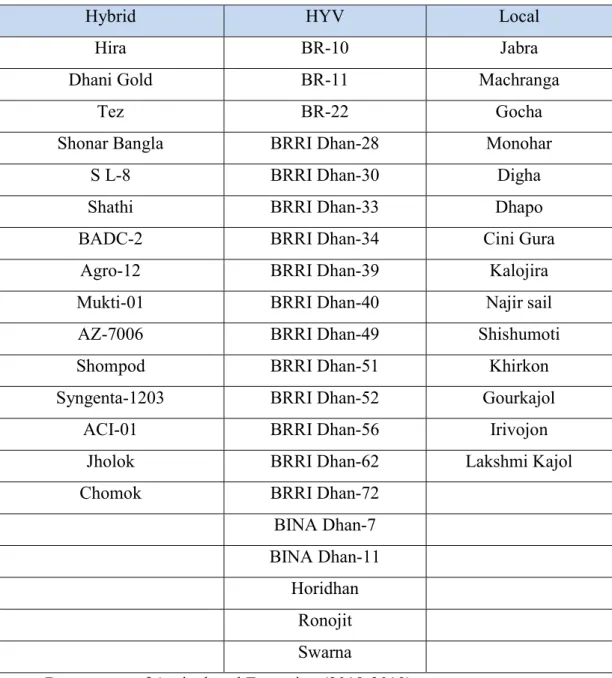
Table 1.1 Varieties of Aman cultivated in Narail district.
Hybrid HYV Local
Hira BR-10 Jabra
Dhani Gold BR-11 Machranga
Tez BR-22 Gocha
Shonar Bangla BRRI Dhan-28 Monohar
S L-8 BRRI Dhan-30 Digha
Shathi BRRI Dhan-33 Dhapo
BADC-2 BRRI Dhan-34 Cini Gura
Agro-12 BRRI Dhan-39 Kalojira
Mukti-01 BRRI Dhan-40 Najir sail
AZ-7006 BRRI Dhan-49 Shishumoti
Shompod BRRI Dhan-51 Khirkon
Syngenta-1203 BRRI Dhan-52 Gourkajol
ACI-01 BRRI Dhan-56 Irivojon
Jholok BRRI Dhan-62 Lakshmi Kajol
Chomok BRRI Dhan-72
BINA Dhan-7 BINA Dhan-11
Horidhan Ronojit Swarna
Source: Department of Agricultural Extension (2018-2019)
Page | 4 From the table 1.1 we found that different local varieties along with HYV Aman varieties were grown in Narail district. Rice has a wide range of uses all over the world. People use it as main source of calories. Boiled rice is directly consumed with curry in Bangladesh and other Asian countries. Cira, Muri, Khoi are popular food item of rice consumed in Bangladesh.
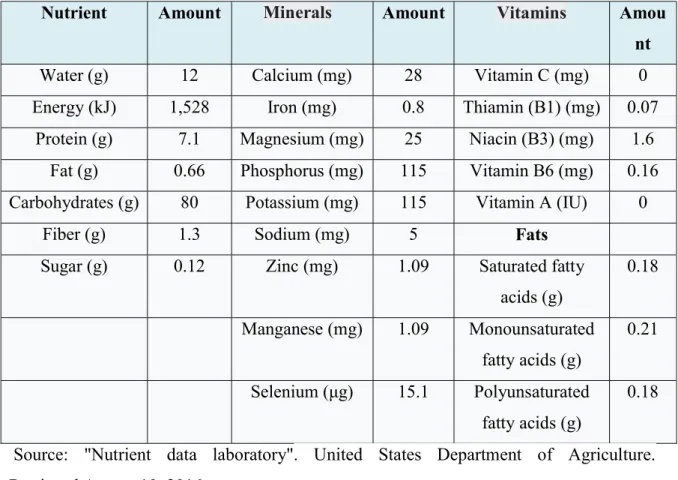
“Fish and rice make a Bangali”, it is a very common maxim for Bangladesh as the people cannot think about their meal without rich. Rice has different food values-
Table 1.2 Nutrient content of Rice per 100 g portion
Nutrient Amount Minerals Amount Vitamins Amou nt
Water (g) 12 Calcium (mg) 28 Vitamin C (mg) 0
Energy (kJ) 1,528 Iron (mg) 0.8 Thiamin (B1) (mg) 0.07 Protein (g) 7.1 Magnesium (mg) 25 Niacin (B3) (mg) 1.6
Fat (g) 0.66 Phosphorus (mg) 115 Vitamin B6 (mg) 0.16 Carbohydrates (g) 80 Potassium (mg) 115 Vitamin A (IU) 0
Fiber (g) 1.3 Sodium (mg) 5 Fats
Sugar (g) 0.12 Zinc (mg) 1.09 Saturated fatty
acids (g)
0.18
Manganese (mg) 1.09 Monounsaturated fatty acids (g)
0.21
Selenium (μg) 15.1 Polyunsaturated fatty acids (g)
0.18
Source: "Nutrient data laboratory". United States Department of Agriculture.
Retrieved August 10, 2016.
For Bangladeshi farmers, producing rice is a very old profession. Farmers associated with rice production needs assistance from other organs of nation like government and non- government organizations. Research organizations like BRRI, BARI, BINA etc. are providing assistance through their improvement of different high yielding varieties of rice day by day. BADC provides direct training and seed support to the farmers. Officers of
Page | 5 Ministry of Agriculture, department of Agricultural Extension (DAE) are providing physical support to farmers for better production of this rice crops. NGO’s like Asha, BRAC, proshika ets are also providing support to farmers.
The production of Aman rice is increasing year to year in Bangladesh. The increasing production scenario of Aman rice is given below here.
Table 1.3 Production of Aman Rice in Bangladesh for last few years Variety 2014-2015
Production (M.tons)
2015-2016 Production (M.tons)
2016-2017 Production (M.tons)
2017-2018 Production (M.tons) Broadcast
Aman
384411 392331 3,96,272 442201
Local Transplant
1917882 1851163 1820241 1340511
High Yielding Variety (HYV)
10887870 11239943 11439541 12210162
Total Aman 13190163 13483437 13656054 13992874
Source: Yearbooks of agricultural statistics 1.2 History of Rice Cultivation in Bangladesh
In the history of rice cultivation, around 10,000-14,000 years ago, Oryza sativa was first grown from the wild grass Oryza rufipogon. Indica (prevalent in tropical regions) and japonica (prevalent in the subtropical and temperate regions of East Asia) were considered as two main subspecies of rice. In West Africa, another cultivated species, O.
glaberrima, was popular much later. Based on recent genetic evidence all forms of Asian rice including indica and japonica come from a single domestication event around 8,200–
13,500 years ago in the Pearl River valley region of China. (Ricepedia, 2019)
In China, archeologists point out that the middle Yangtze and upper Huai rivers were the two ensuing places in the country for O. sativa cultivation. Evidence proves that Rice and
Page | 6 farming ingredients were found at least 8,000 years back. Over the 2,000 years, cultivation spread down following these rivers. (Ricepedia, 2019)
At first, soil is paddled to turn into mud and then it is broken to prevent too much water percolating away then the seedlings are transplanted. These are the undivided parts of rice farming. This process was firstly practiced in China. Through the evolution of the two process- paddling and transplanting have also popularized and developed.
Rice was the leading crop in Sri-Lanka nearly 1000 B.C. The crop may have been well circulated to Greece and adjacent areas of Mediterranean. It took place around 344-324 B.C by revolving members of Alexander the Great’s expedition to India. In all respects rice spread consecutively Southern Europe and to a few positions in Northern Africa from a center in Greece and Sicily. (Ricepedia, 2019)
New lands to the west became available for suction because of Europe’s Great Age of Exploration. The early European settlers initiated rice farming to the new world. At first, the Portuguese paddled it to Brazil and the Spanish inaugurated rice cultivation to several places in Central and South America. In 1685 North America firstly records to propagate corn on the costal lowlands and islands named South Carolina at present. It is imagined in the mid-18th century that the transported slaves to the Carolinas from West Africa induced the complicated agricultural technology needed to fructify rice. Then a ascending rice industry was assured by their labor. After that the cultivators revealed rice in California’s Sacramento Valley in 20th century. With the timing of the first successful crop in Australia’s New South Wales, the introduction into California assembled almost exactly. (Ricepedia, 2019)
Archeological evidence shows that rice was grown first in the region of the Yangtze River valley in China. Based on morphological studies of rice phytoliths from the Diaotonghuan archaeological site it is clearly found that the transmigration of wild rice to the cultivation of domesticated rice. In the history of rice cultivation, about 12,000–
Page | 7 11,000 BP wild rice collection was an important part of their livelihood. By the time from 10000-8000 BP through the morphological transformation of Diaotonghuan phytoliths rice had been domesticated. Then the two major subspecies of rice indica and japonica rice were being cultivated in Central China. Rice farming into mainland of Southeast Asia and Westwards across India and Nepal was quickly spread in the late 3rd millennium BC. (Ricepedia, 2019)
In 2003, Korean archaeologists demanded that they had brought to light the world’s ancient rice species. They disagreed with the accepted view that rice cultivation was originated in China about 12,000 years ago. These findings were accepted by academia with potential skepticism. The results and their publicizing has been excerpted as a combination of nationalist and regional interests. In 2011, the Stanford University, New York University, Washington University in St. Louis, and Purdue University claimed that in the Yangtze Valley of China yet that there was only one single origin of cultivated rice. (Ricepedia, 2019)
In 7000-6000 BC, the earliest remnants of the corn in the Indian subcontinent have been found in Indo Gangetic plain. But around 3000-2500 BC the earliest extensively accepted date for cultivated rice is placed with findings in regions associating to the Indus Valley Civilization. In Assam and Nepal, perennial wild subspecies of rice are still cultivated. At first it was grown in the northern parts then it was farmed in southern India around 1400 BC. After that it was spread to all the prolific plains watered by rivers. Southern Europe considered rice as a hearty corn and so the cultivation and cooking methods are quickly expanded to the west by medieval times. (Ricepedia, 2019)
Today, China, India, Indonesia, Pakistan, Bangladesh, Vietnam, Thailand, Myanmar, Philippines, and Japan provided the majority of all rice production. Asian farmers still contribute 92% of the world's total rice production. (FAO, 2019)
Page | 8 1.3 Objectives of the Research work:
i) To investigate the demographic profile of T.aman rice farmers.
ii) To estimate the profitability of HYV T.Aman and local T.Aman rice varieties and compare the results.
iii) To examine the resource use efficiency of HYV T.Aman and local T.Aman rice varieties and compare with one another.
iv) To identify the production problems and constrains associated with production of HYV T.Aman and local T.Aman rice varieties.
1.4 Justification of the Study
The districts of Khulna division have come forward in rice production because of modern rice varieties and modern technology application. Previously people of Narail district were very much dependent on primitive technology for rice production. It has not been fully abolishing in the present time also. Some very poor farmers are practicing the local varieties cultivation using the primitive technologies.
The land of Narail district is very low. In the rainy season most of the lands goes under 2- 4 feet of water. The climatic and land condition of this area favor for the local Aman production. That’s why farmers are not interested in HYV Aman rice cultivation. This study was conducted to know the economic reasons behind this situation. For this purpose, study was conducted in this area.
There were many local varieties of T.Aman in Narail district. Beside this people are practicing modern varieties cultivation now a day. Main local T.aman varieties cultivated in this area are Dighe, Jabra, Monohor, Ratol, Moiskandi, Dhapo etc. and main modern T.aman varieties were BR-10, BR-11, BR-22, BRRI Dhan-28, BRRI-33, BRRI-39, BRRI-49, BRRI-62, BRRI-72, BINA-7, BINA -11 etc..
The research would add new knowledge in the field of T.Aman rice cultivation in this area and build a foundation for further research. As no such study was conducted in this area previously, the ideas about the profitability level of HYV and local T.Aman rice
Page | 9 varieties and comparison of the results would help farmers to take production decisions in Aman season.
The comparative input use information for both local and HYV T.Aman had generated from the work. This information would help the producers and policy makers to take their decision.
Findings of demographic characteristics of farmers would help to know about the social status of the T.Aman rice cultivators in this selected area. The study might provide valuable information for the policy makers of Government and Non-Government Organizations to formulate policy in order to improve socio-economic position of the T.Aman rice cultivators.
This study might search information about resource use efficiency of local and hybrid T.Aman. That would help farmers to increase production efficiency of Aman rice.
Besides this study might provide ideas about the potential factors that effects on Aman rice cultivation.
At last this study might provide ideas about the production problems and constraints associated with production of modern and local T.Aman rice varieties.
Page | 10
CHAPTER II
REVIEW OF
LITERATURE
Page | 11
CHAPTER II
REVIEW OF LITERATURE
Review of literature in any research is essential because it provides a scope for reviewing the stock of knowledge and information relevant to the proposed research. But there is little information regarding knowledge and information relevant to the present research.
Literature and research of the major past works in connection with the present study were searched because this knowledge and information provide guideline in designing the future research problem and validation of the new findings. Some studies relating to T.Aman rice are reviewed here.
Islam (2001) studied on economic potential of Bina-6 rice production in Mymensingh district with a sample of 55 farmers considering Cobb-Douglas production function and found that BINA-6 rice production was profitable because the total return was much higher than total cost of production.
Anik (2003) studied on economic and financial profitability of aromatic and fine rice production in Dinajpur and Sherpur district with a sample of 100 farmersand found that aromatic rice was more profitable than fine rice as the net return was higher than fine rice.
Shamsuddula (2004) studied on comparative economics of local Boro and Hybrid rice production in terms of profitability and efficiency in Mymensingh district with 160 samples of rice developing farmers and found that net return from Hybrid rice was much higher than local boro rice.
Siddiqui (2008) studied on economic profitability of BRRI Dhan33 and BR-11 rice production in Kurigram district with 60 farmers and found that gross return for BRRI Dhan33 was higher than BR-11.
Page | 12 Ullah (2008) studied on comparative profitability and technical efficiency of aromatic and non-aromatic aman rice production in Dinajpur district with a sample of 60 farmers using stochastic frontier analysis and found that profitability of BRRI Dhan 34 (aromatic) was much higher than BR-11 rice (non-aromatic) as the total return from BRRI Dhan 34 was higher than BR-11.
Hanifa (2009) studied on economic analysis of BR-29 and Hybrid Hira rice production in Netrokona district with a sample of 80 farmers and found that total returns from Hybrid Hira rice per hectare was higher than BR-29
Kana (2011) studied on economic analysis of salt tolerant Binadhan-8 and HYV BRRI Dhan28 rice production in Satkhira district with a sample of 60 respondents and found that total return of Binadhan-8 was greater than total return of BR-28.
Akter (2011) studied on profitability and resource use efficiency of BRRI Dhan29 in old Brahmaputra floodplain area of Tangail district with a sample of 60 farmers using Cobb- Douglas production function and found that total return of BRRI Dhan29 was higher than total cost.
Kamruzzaman (2011) studied on economic potential of BRRI Dhan-51 and BR-11 rice production in Rangpur district with a sample of 60 farmers considering Cobb Douglas production function and found that BRRI Dhan-51 had higher gross return than BR-11.
Banu (2011) studied on economic analysis of BR-28, BR-29 and Hybrid Hira rice production in Kurigram district with a sample of 90 farmers considering Cobb-Douglas production function and found that Hybrid Hira was more profitable than BR-28 and BR-29 rice as the net return was much higher than BR-28 and BR-29.
Shelley et al. (2016) had performed a study on Rice Cultivation in Bangladesh: Present Scenario, Problems, and Prospects. In conclusion they found although Bangladesh is self- sufficient in rice production, yield is low. Bangladesh has the potential to boost rice production and export, which can contribute to the national economy. Targeted breeding
Page | 13 was essential to accommodate the diverse environments of Bangladesh. The development of more high-yielding, early-maturing, drought-resistant, salt-tolerant, disease-resistant, submergence-resistant, cold-tolerant, high-temperature-tolerant, and nutrient-rich varieties would further boost rice production and nutrition. In addition, proper crop management strategies would enhance rice production.
Rafiqul et al. (2017) completed a study on Technical Efficiency of Farm Producing Transplanted Aman Rice in Bangladesh: A Comparative Study Of Aromatic Fine and Coarse Varieties. The variance parameters estimated through maximum likelihood estimation (MLE). The yield gaps observed between the frontier and actual farmer’s yield of aromatic, coarse, and fine rice were 5.3%, 16.9%, and 2.6%, respectively. The estimated technical efficiency of each individual farmer varied within the range from 65.5% to 99.88% with a mean technical efficiency of 96.5% for aromatic rice farmers, 85.3% for coarse rice farmers, and 97.6% for fine rice farmers.
Khalique et al. (2019) conduct a study on Economic Analysis Of Rice Production In Bangladesh. They foundgrowth rates of area, production, yield and nominal price of three seasons of rice were estimated by fitting the exponential trend function. Growth rates of an area which were significantly negative for Aus, Aman that were-4.6 percent and-0.3 percent and positive for Boro rice it was 4.5 percent over the whole period. The growth rates of yield for Aus, Aman and Boro were increased significantly at the rate of 2.2, 1.9 and 1.9 percent respectively during the entire time period. There was an upward trend observed in the nominal price for Aus, Aman, and Boro over the period. The short-run and long-run price elasticity of Aus were 0.010 and 0.210 and short-run and long-run elasticity of Aman and Boro rice were 0.091, 0.112 and 0.051 and 0.395 respectively.
Policy related to technological advancement, improving varieties, extension services, fertilizer distribution, high yielding variety seeds, and production management research may increase the productivity of food grains in Bangladesh.
Page | 14 Chapter summary
The above reviews indicate that there were different research works on Aman Rice. But none of this research regards with the financial comparison between local T.Aman and HYV T.Aman. None of these researches finds why farmers still culturing Local varieties along with HYV’s. That’s why in this study we are financially comparing this two Aman rice. So, the present study aims to gather information on profitability and potential factors of Aman rice cultivation in Narail district of Bangladesh.
Page | 15
CHAPTER III
METHODOLOGY
Page | 16
CHAPTER III METHODOLOGY
Methodology is an indispensable and integral part of any study. The reliability of a specific study finding depends to a greater extent on the appropriate methodology used in the study. Improper methodology very often leads to misleading result. So careful considerations are needed in this area. This chapter describes clearly what sorts of method and procedure had followed in selecting the study area, the source of data and the analysis.
3.1 Selection of the Study Area
Narail district is very well known for rice cultivation. The low land of this district is used for Aman cultivation. Both local and HYV varieties were cultivated here. That’s the reason for selecting this district. In Narail district there are three upazilas they are Narail Sadar Upazila, Kalia Upazila and Lohagara Upazila. All upazilas are equally important area for T. Aman rice cultivation. So the three Upazilas under Narail District were selected purposively as study area. Purposive and multi-stage sampling techniques were taken into consideration. Firstly, Narail district of the Southwest region of Bangladesh was deliberately selected. All these three upazillas, were selected purposively. Then villages were purposively selected. Finally, 60 farmers were selected (30 for modern HYV’s and 30 for local variety) randomly from farmers list of this upazilas.
3.2 Sample Size and Sampling procedure
The total sample sizes from three upazilas were 60 T. aman rice cultivators. The number of sample from each upazila was 20 rice cultivators. A simple random sampling procedure was used to select the farmer who cultivates T. aman rice in these areas for collecting the data. Names of 20 farmers from each upazila were chosen out by the lottery method (10 for local and 10 for HYV T.Aman). Each of the farmers had assigned a number, after which 20 of those numbers had been chosen at random.
Page | 17 3.3 Data Collection
Primary data were collected through structured interview schedule which were filled up by the researcher. Data was collected July to December 2019. Additionally, secondary data were also collected from various sources like Encyclopedia, Bangladesh Rice knowledge bank of Bangladesh Rice Research Institute (BRRI), Bangladesh Bureau of Statistics (BBS) and Ministry of Agriculture.
3.4 Data Processing and Analysis
In this study, a statistical tool and technique both descriptive and inferential was used to analyze the data. Besides, some descriptive tools and techniques were also used in the study. Primary data were recorded into Microsoft Excel and economic analysis was carried out for determining costs and returns. In this study, cost and return analysis were done on both variable and total cost basis. A profit equation was used to assess the profitability of both HYV and Local T. Aman cultivation.
3.5 Analytical Technique
In this study, descriptive and inferential statistical tools both were used to analyze the data especially for the analysis of Cob-Douglas production function. Both tabular and functional methods of analysis were employed in this study. At first, the collected data were edited and summarized for analysis. The tabular method of analysis involved different descriptive statistics like mean, percentage, ratio, etc. Land use cost was calculated on the basis of five months’ lease value of land. The profitability of local and HYV T.Aman cultivation was estimated by using gross margin, net return, and benefit cost analysis.
Cob-Douglas production function analysis was used to estimate the significance level of inputsfor both HYV and Local T. Aman rice cultivation.
To determine the contribution of the most important variables in the production process, the following specification of the model was applied:
Page | 18 Y=aX1b1 X2b2 X3b3 X4b4 X5b5 X6b6 X7b7 X8b8 X9b9 X10b10 X11b11 X12b12 X13b13 eui … … … (i)
The empirical production function was the following:
lnY = a + b1lnX1 + b2lnX2 + b3lnX3 + b4lnX4 + b5lnX5 + b6lnX6 + b7lnX7 + b8lnX8 + b9lnX9 + b10lnX10 + b11lnX11 + b12lnX12 + b13lnX13 + Ui .. … … … ..(ii) Where,
Y = Yield (Mound/ha); X1 = Human Labor (Man-day/ha); X2= Land preparation cost (Tk/ha); X3= Seedling (Tk/ha); X4 = Urea (kg/ha); X5 = TSP (kg/ha); X6 = SSP (kg/ha);
X7 = DAP (kg/ha); X8 = MOP (kg/ha); X9 = Gypsum(kg/ha); X10 = ZnSO4 (Kg/ha); X11
=Manure(md/ha) X12 = Insecticide cost (Tk/ha); X13 = Irrigation cost (Tk/ha); a = Intercept; b1, b2--- b13 coefficients of the respective variables to be estimated. Ui = Error term.
Net value of the produce and cost involved were estimated. Cost of variables inputs such as land preparation, labor, seed, fertilizer, manure, irrigation, and insecticides were calculated. The tabular method of analysis involved different descriptive statistics like mean, percentage, ratio, etc. Land use cost was calculated on the basis of five months lease value of land.
Variable costs
1. Land preparation cost 2. Hired labor cost 3. Seed cost
4. Organic manure cost 5. Chemical fertilizer cost
Fixed costs
1. Interest on operating capital cost 2. Land use cost
3. Family labor cost
Gross Margin
GM = TR - VC … … … …… … … …… … (iii) Where,
Page | 19 GM = Gross Margin (The gross margin represents the amount of total sales revenue that the farm retains after incurring the direct costs associated with producing)
TR = Total Revenue (Total revenue is the full amount of total sales of goods and services. It is calculated by multiplying the total amount of goods and services sold by the price of it)
VC = Variable Cost (Variable costs are expenses that vary in proportion to the volume of goods or services that a farm produces.)
Π = Gross return − (Variable cost + Fixed cost) Here, Π = Profit per hectare
Gross return = Total production × per unit price Net Return
NR = TR - TC … … … …… … … …… … (iv) Whereas,
NR = Net Return TR = Total Revenue TC = Total Cost
For estimating net income total cost was subtracted from total revenue. Total cost includes variable cost plus fixed cost.
Benefit Cost Ratio (Undiscounted): The BCR was computed by this method.
BCR = TR/TC … … … …… … … …… … (v) Whereas BCR = Benefit Cost Ratio
TR = Total Revenue TC = Total Cost
Per hectare profitability of local and HYV T. Aman rice cultivation from the view point of individual farmers were measured in terms of gross return, gross margin, net return and benefit cost ratio. Then gross return, gross margin, net return and benefit cost ratio for local and HYV’s T.Aman rice compared.
Page | 20 The resource use efficiency of the farmers was judge on neo-classical criteria. Neo- classical theory states that, to achieve the efficient resource use condition, the Marginal Value Product (MVP) should be equal to Marginal Factor Cost (MFC) under perfect competition. The producer used to select the variable input level that maximizes the profit. Marginal Value Product (MVP can be obtained by following formula:
MVP= ∗bi … … … …… … … …… … (vi) Where,
bi = regression co-efficient of input xi
xi = mean value (Geometric mean) of xi variable inputs y = mean value (Geometric mean) of return.
In the model, Marginal factor Cost of all the inputs are measured in terms of additional taka expensed for using individual inputs.
To measure the efficiency, we would compare and test the ration of Marginal Value Product (MVP) and Marginal Factor Cost (MFC) for them for each of the inputs for its quality to 1(one).
= 1 … … … …… … … …… … … (vii)
The resource was thought to be efficiently used and profit would be maximized in Aman rice cultivation when the ratio of Marginal Value Product and Marginal Factor Cost was equal to 1 or MVP is equal to MFC for each input i.e. MVP=MFC.
1. MVP/MFC were greater than 1 or MVP>1, it would imply that the farmer was inefficient on their average in using their resources. In this case inputs are underused compared to the optimum level.
2. If the ratio were equal to 1, that is, MVP =1, it meant the resources were optimally and efficiently used.
3. If the ratio were less than 1, that is, MVP<1, it would mean the resources were not used efficiently but overused. To get the optimal level farmers were required to lessen the use of resources.
Page | 21
CHAPTER IV
DESCRIPTION OF
THE STUDY AREA
Page | 22 CHAPTER IV
DESCRIPTION OF THE STUDY AREA
Study area is important element for a study. This chapter focuses on the demography geography, location climate and economy of this area. It indicates the reliability of the study. Climate, land and soil condition are important factors of any study area because the production depends on these.
Khulna Division History
Khulna Division is one of the seven divisions of Bangladesh and is located in the south- west of the country. The Division was established in 1960. It has an area of 22,285 km2 and a population of 15,563,000 at the 2011 Census (preliminary returns). Its headquarters is Khulna city in Khulna District. Khulna is the third largest city in Bangladesh.
Geography
The Khulna division borders the Indian state of West Bengal to the west, the Rajshahi Division to the north, the Dhaka and Barisal Divisions to the east, and has a coastline on the Bay of Bengal to the south. It is part of the Ganges River delta or Greater Bengal Delta. Some main rivers of this area include the Madhumati River, the Chitra River, the Bhairob River and the Kopotokkho River. The region also includes several islands in the Bay of Bengal.
Administrative districts are of this division are:
1. Bagerhat District 2.Chuadanga District 3. Jessore District 4.Jhenaidah District 5. Khulna District
6.Kushtia District 7. Magura District 8.Meherpur District 9. Narail District and 10.Satkhira District
Page | 23 Narail District
Narail was a sub-division of former Jessore Zila. It was upgraded to a district in 1984.
Nothing is definitely known about the origin of the district name. It is believed that the district was named Narail after the name of the Zamindar family popularly known as Narail family. Narail District has an area of 990.23 square kilometres (382.33 sq mi). It is located to the south of Magura District, north of Khulna District, with the Faridpur District and Gopalganj District on the east, and Jessore District to the west. It lies between 23°02´ and 23°19´ north latitudes and between 89°23´ and 89°48´ east longitudes.
Indigo Revolt was organized in this district during 1859-60; in 1946 Tebhaga movement was held in the district. Narail district was liberated on 10 December 1971.
Total population of this district for both male and female is 7,21,668, male is 3,53,527 and female is 3,68,141. (District Statistics 2011)
Through the district flow the Madhumati, Nabaganga, Bhairab, and Chitra rivers. There are many beels and baors, the most noted of which is Chachuri Beel.
Annual average temperature of this district varies from Maximum 37.1°C to minimum 11.2°C. Annual rainfall is 1467 mm.
Geography
Narail is a district in the southwestern region of Bangladesh. Narail district is bounded on the north by Magura district, on the east by Faridpur and Gapalganj districts, on the south by Khulna and Bagerhat districts and on the westy by Jessore district.
Narail district was established in 1984. The district consists of 3 upazilas, 38 unions, 445 mauzas, 635 villages, 3 paurashavas, 27 wards and 67 mahallas. The upazilas are Narail Sadar, Kalia and Lohagara.
Total Cultivable area of this district is 176,504-acre (714 km2). Fallow land contains 25,090-acre (102 km2) of total land. Total forest area of this district is 10 acres. The irrigated land for agriculture is 36,208-acre (147 km2). And the river system takes 8,562- acre (35 km2) of land.
Page | 24 Figure 4.1 Map of Narail district
Source: Internet Search engine Google
Main cereals produced in Narail are rice and then wheat. Other cereals are jab, barley, cheena, maize, kaun, bajra and joar. Main and common pulses are gram, mung, lentil, arhar, gari kalai, khesari and pea.
Farmers of Narail district also produce oil seeds named rape and mustard, sesamum, linseed, groundnut, soybean, sunflower and castor. Farmers grow both summer and winter vegetables. Main vegetables are potato, brinjal, raddish, arum, lady's finger, cauliflower, cabbage, bean, tomato, patal, gourd, cucumber, pumpkin, knollkal-turnip, dhundal, barbati, khirai, chichinga, carrot, kakrol and sak.
Main cash crops produced here are jute, mesta, sunhemp, cotton, sugarcane and tobacco.
Page | 25 Beside this people also produce spices include turmeric, ginger, chillies, onion, garlic, corriander, black cumin and cui jhal.
Dhaincha, jute stick, dry leaf of plants and other smaller plants used as cooking-fuel here.
Demography
Total population of this district is 7,21,668. The population is divided by religion Muslim-586588, Hindu- 134594, Buddhist- 6, Christian- 258 and Other religion 222 people. There are 1572 Mosques, 453 Temples (Mandir), 2 Churches (Girza) and 1 Pagoda in this district. Literacy of this district for both male and female is 61.3%, male is 63.3% and female is 59.3%. The average literacy rate is 61.3%, very low compared to the rest of the world.This district consists of the following three Upazilas.-
Table4.1 Upazilas of Narail district
Upazila Area
in km2
2011 Census population
Male Female
Kalia 317.64 220202 80906 84465
Lohagara 381.76 228594 72006 81490
Narail Sadar 290.83 272872 105653 110086
Total 990.23 721668 268078 286588
Source: Yearbook of Agricultural Statistics, (2018-2019) Climate
Annual average temperature of this district varies from Maximum 37.1°C to minimum 11.2°C. Annual rainfall is 1467 mm.
Archaeological Heritage and Relics:
Mosque at Village Goalbathan (1654), Kadamtala Mosque, Ghazir Dargah at Naldi, Homestead of Raja Keshab Roy at Wazirpur, Radha Govinda Mandir at Jorbangla
Page | 26 (eighteenth century), Kalibari at Lakshmipasha, Math at Baradia of Nihinathtala are remarkable archaeological heritage and relics of this district.
Famous Personalities of the District:
1. Sheikh Mohammed Sultan (1923-1994): heikh Mohammed Sultan better known as SM Sultan, was a Famous Bangladeshi Painter. Sultan was born on 10 August 1923 in Masimdia, Narail district, Bangladesh.
2. Mashrafe Bin Mortaza: He is a Bangladeshi cricketer and former captain of the Bangladesh national cricket team.
3. Bijay Sarkar (1903-1985) He was a Baul Singer, lyricist and composer. He was born in Dumdi in Narail District
4. Suvra Mukherjee: She was the first lady of India, wife of Indian President, Pranab Mukherjee.
Economic Situation:
The economy of Narail is predominantly agricultural. Out of total 151,052 holdings of the district, 72.51% holdings are farms and produce varieties of crops mainly local and HYV paddy, sugarcane, wheat, vegetables, spices, jute, pulses, and other minor cereals.
Various fruits like mango, banana, jackfruit, guava, coconut etc. are grown in the district.
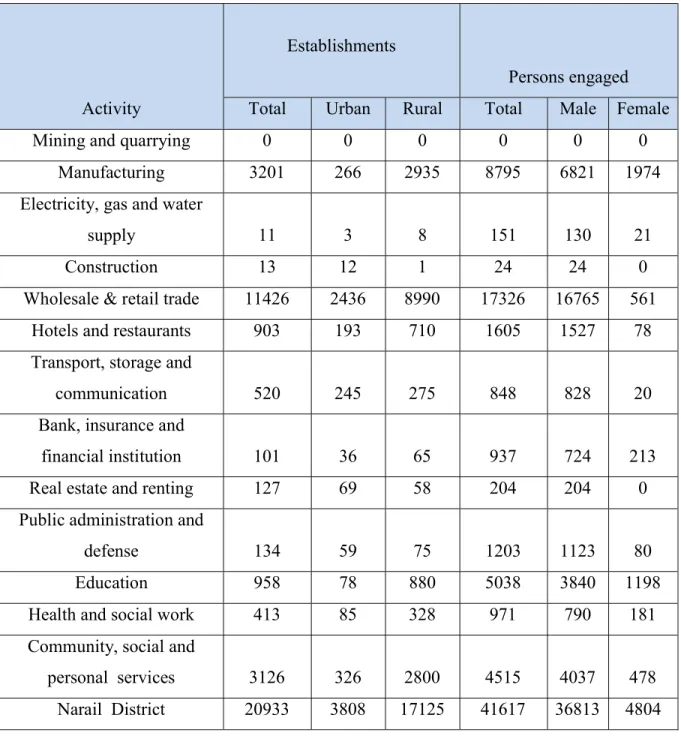
Almost all kinds of vegetables are cultivated particularly bitter gourd or karala, pumpkin or misti kumra, potato and brinjals are abundantly grown. Pisciculture and rearing of livestock and poultry adds an additional income to rural households. Fish of different varieties are abundant in this district. Moreover, varieties of fish are caught from rivers, tributary channels, even from paddy field during the rainy season. Some valuable timber and forest trees are grown in the district. Non-farm activities are also significant in Narail district. According to the following table-4.2, there are 20,933 establishments in the district of which 41,617 persons are engaged in different types of non-farm activities.
Female participation in non-farm activities is very poor. They constitute about11.54% as against 88.46% of the males. Wholesale & retail trade emerges as the single largest
Page | 27 activity (54.58%) with 11,426 establishments and 17,326 persons engaged (41.63%) in the establishments of Narail district.
Table 4.2 Number of Establishments and Population Engaged by Activity
Activity
Establishments
Persons engaged Total Urban Rural Total Male Female
Mining and quarrying 0 0 0 0 0 0
Manufacturing 3201 266 2935 8795 6821 1974
Electricity, gas and water
supply 11 3 8 151 130 21
Construction 13 12 1 24 24 0
Wholesale & retail trade 11426 2436 8990 17326 16765 561
Hotels and restaurants 903 193 710 1605 1527 78
Transport, storage and
communication 520 245 275 848 828 20
Bank, insurance and
financial institution 101 36 65 937 724 213
Real estate and renting 127 69 58 204 204 0
Public administration and
defense 134 59 75 1203 1123 80
Education 958 78 880 5038 3840 1198
Health and social work 413 85 328 971 790 181
Community, social and
personal services 3126 326 2800 4515 4037 478
Narail District 20933 3808 17125 41617 36813 4804 Source: Yearbook of Agricultural Statistics, (2018-2019)
Page | 28
CHAPTER V
SOCIO-ECONOMIC CHARACTERISTICS OF
THE T.AMAN RICE
FARMERS
Page | 29 CHAPTER V
SOCIO-ECONOMIC CHARACTERISTICS OF THE T.AMAN RICE FARMERS
Socio-economic condition of the sample farmers is very important in use of research planning because there are numerous interrelated and constituent attributes characterizes an individual and profoundly influences development of his/her behaviors and personality. People differ from one another for the variation of socio-economic aspects.
However, for the present research a few of the socio-economic characteristics have been taken into consideration for discussion.
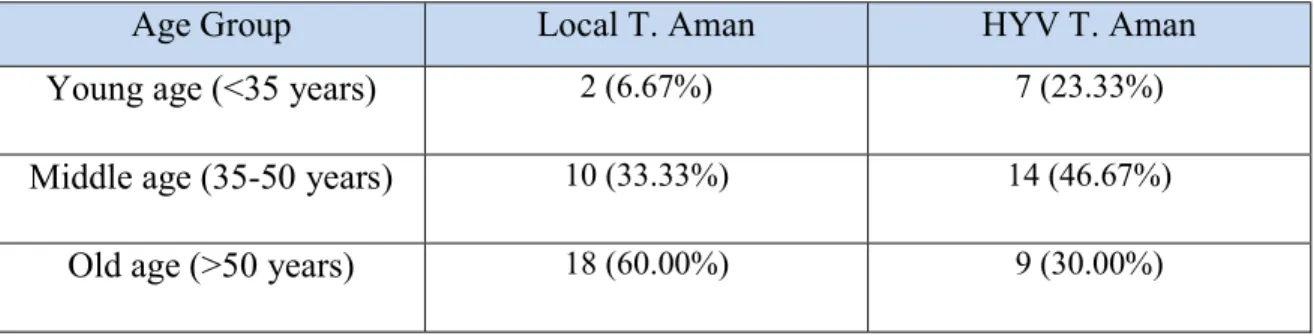
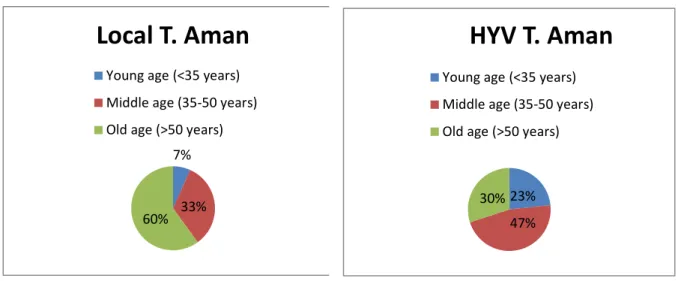
5.1 Age and Sex Distribution of the T.Aman Rice Farmers
The age structure of the sample farmers was examined by classifying into three age groups that were Young age (<35 years), Middle age (35-50 years), and Old age (>50 years). The different age groups of the farmer are presented in Figure 5.1. There were three groups because almost all respondent covers these three categories. For local T.
Aman, it was found that the highest number of the respondents (60%) belongs to the Old age (>50 years) followed by the Middle age (35-50 years) (33.33%) and only 2%
respondents were in the young age (<35 years). On the other hand for HYV T.Aman that the highest number of the respondents (46.67%) belonged to the Middle age (35-50 years) followed by the Old age (>50 years) (30.00%) and 23.33% respondents were in the young age (<35 years years).
Table 5.1 Age Distribution of the Sample T.Aman Farmers
Age Group Local T. Aman HYV T. Aman
Young age (<35 years) 2 (6.67%) 7 (23.33%)
Middle age (35-50 years) 10 (33.33%) 14 (46.67%)
Old age (>50 years) 18 (60.00%) 9 (30.00%)
Source: Field survey, 2019
We found that young energetic farmers are interested in HYV’s Cultivation. But the experienced farmers are interested in Local varieties cultivation. It is also found that 100 percent T. Aman farmers were male in the study area.
Page | 30 23%
47%
30%
HYV T. Aman
Young age (<35 years) Middle age (35-50 years) Old age (>50 years)
Figure 5.1: Age Distribution of the Sample Local and HYV T.Aman rice Farmers Source: Field survey, 2019
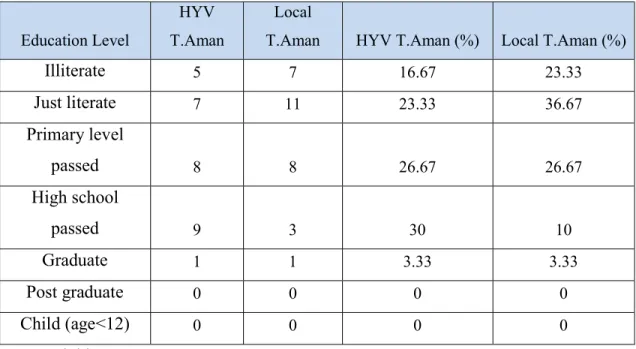
5.2 Level of Education of the Respondents
On the basis of education, the respondents were classified into six categories as 0=
Illiterate, 1=Just literate, 2=Primary level passed, 3=High school passed, 4=Graduate, 5=
Post graduate and 6=Child (age<12).
Table 5.2 Level of Education of the Respondents Education Level
HYV T.Aman
Local
T.Aman HYV T.Aman (%) Local T.Aman (%)
Illiterate 5 7 16.67 23.33
Just literate 7 11 23.33 36.67
Primary level
passed 8 8 26.67 26.67
High school
passed 9 3 30 10
Graduate 1 1 3.33 3.33
Post graduate 0 0 0 0
Child (age<12) 0 0 0 0
Source: Field survey, 2019
For local T. Aman, the highest numbers of the respondents (26.67%) were primary level passed. On the other hand, for HYV T. Aman, the majority of the respondents (36.67%) were just literate.
7%
60% 33%
Local T. Aman
Young age (<35 years) Middle age (35-50 years) Old age (>50 years)
Page | 31 Figure 5.2: Level of Education of the Respondents
Source: Field survey, 2019 5.3 Family Size
Data presented in Table 5.3 indicate that most of the respondent’s family (61.67%) belonged to small size family categories. Rest (33.33%) belonged to medium size family.
Only 5% of the respondents belonged to large family size category. Average family size of T.Aman farmers is 4.43. On the basis of the report of national household survey (2011) average family size in total was 4.35 where in rural it was 4.36 and urban was 4.29. In this study most of the respondent hold small family belonging to the members of 1to 4. It means farmers were aware of birth control.
Table 5.3 Family Size of the Respondents
Family Size Number of Family Frequency (%)
Small Sized Family (1-4 Members) 37 61.67
Medium Sized Family (4-6 Members) 20 33.33
Large Sized Family (>6 Members) 3 5
Total 60 100
Source: Field survey, 2019
5
7 8 9
1 0 0
7
11
8
3
1 0 0
Illiterate Just literate Primary level
passed High school
passed Graduate Post graduate Child (age<12)
Education Level
HYV T.Aman Local T.Aman
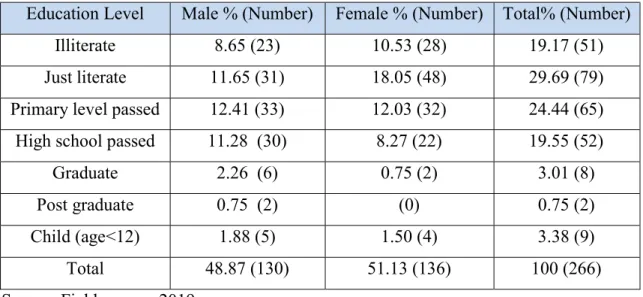
Page | 32 5.4 Distribution of Family Member by Literacy and Sex
The literacy levels of the farm family members of the T.Aman cultivators are given in Table 5.4. It appears from the table that 19.17 percent family members were not enrolled of which 8.65 percent were male and 10.53 percent were female. From that table we also find that 29.69 percent family members were just literate, 24.44 percent family members were primary level passed, 19.55 percent family members were high school passed, 3.01 percent family members were graduate and only 0.75 percent family members were post graduate. Rest 3.83 percent family members were child (age<12).
Table 5.4 Distribution of Family Member by Literacy
Education Level Male % (Number) Female % (Number) Total% (Number)
Illiterate 8.65 (23) 10.53 (28) 19.17 (51)
Just literate 11.65 (31) 18.05 (48) 29.69 (79)
Primary level passed 12.41 (33) 12.03 (32) 24.44 (65) High school passed 11.28 (30) 8.27 (22) 19.55 (52)
Graduate 2.26 (6) 0.75 (2) 3.01 (8)
Post graduate 0.75 (2) (0) 0.75 (2)
Child (age<12) 1.88 (5) 1.50 (4) 3.38 (9)
Total 48.87 (130) 51.13 (136) 100 (266)
Source: Field survey, 2019
5.5 Occupational Status of T.Aman Rice Farmers
T.Aman farmers of Narail dristrict were not solely dependent on rice cultivation. Beside this they also took part in other occupations also. They practiced fisheries beside T.
Aman about 18.33% of the total respondent. The farmers who raised livestock’s takes 20% of the total farmers. Respectively 10% and 15% involved in poultry rearing and business. Highest portion (31.67%) acted as day labor during non-agricultural season.
And rest 5% migrated for their livelihood
Page | 33 Table 5.5 Farmer’s occupation during off-agricultural season
Occupation Number Frequency
T.Aman Rice + Fisheries 11 18.33%
T.Aman Rice + Livestock 12 20.00%
T.Aman Rice + Poultry rearing 6 10.00%
T.Aman Rice + Business 9 15.00%
T.Aman Rice + Day Labor 19 31.67%
T.Aman Rice + Migration 3 5.00%
Source: Field survey, 2019
5.6 Amount of Land Ownership of T.Aman Rice Cultivators
On the basis of farm size, the respondents were classified into five categories (according to National Agricultural Extension Policy- NAEP) as shown in Table 5.6. From the table we can get the amount of land ownership of T.Aman Rice cultivators. Here 18.92 percent land occupied by 21 respondents who were marginal sized farmers (0.50-1.49 acres).
Majority of the farms were medium sized farms (2.50-7.49 acres) occupied 42.86 percent of total land. Rest 38.23 percent of land occupied by small sized farms (1.50-2.49 acres). There was no large and landless farmer. Average operated land was 1.92 acres. And total operated lands by these 60 farmers were 115.36 acres.
Table 5.6 Amount of Land Ownership of T.Aman Rice Cultivation
Amount of land ownership
Number of Farms
Occupied Area ( Acre)
Percentage of total land
Landless (<0.49 acres) 0 0 0.00
Marginal sized farm (0.50-1.49 acres) 21 21.82 18.92
Small sized farm (1.50-2.49 acres) 24 44.10 38.23
Medium sized farm (2.50-7.49 acres) 15 49.44 42.86
Large sized farm (>7.49 acres) 0 0 0.00
Total 60 115.35 100.00
Source: Field survey, 2019, (Scale- National Agricultural Extension Policy- NAEP)
Page | 34 5.7 Sources of Fund
According to this field survey, 5% of the cultivators have their own fund as well as they also take loan. 86% of the cultivators have their own fund. Only 9% cultivators use others fund like friends, kith and kin. No cultivators started their cultivation by only loan. They take loan from local NGOs (BRAC and Grameen Bank).
Figure 5.3: Sources of Fund Source: Field survey, 2019
5.8. Yearly Income of farmers
Average yearly income of HYV aman farmers was tk. 87624.46. And highest income was found tk. 241050. For local T.Aman average yearly income was tk. 83888.00. And highest income was tk.155640.00.
Loan from Financial Orhanization
5%
Own fund 86%
Friends, kith and kin 9%
Page | 35
CHAPTER VI
COMPARATIVE
PROFITABILITY
ANALYSIS OF LOCAL
T.AMAN AND HYBRID
T.AMAN CULTIVATION
Page | 36 CHAPTER VI
COMPARATIVE PROFITABILITY ANALYSIS AND RESOURCE USE EFFECIENCY OF LOCAL T.AMAN AND HYBRID T.AMAN CULTIVATION
6.1 Comparative Input Use Pattern of local and HYV T.Aman rice Human labor requirement (Man-days)
Human labor is an important input for T.Aman rice production. The number of labor used in local T.Aman rice production was only 57.68 man-days per hectare. Some local varieties were cultivated with other crops as shathi foshol. That was the reason behind the low number of man-days for local T.Aman than its recommended level. On the other hand for HYV T.Aman the average number of labor was 172.76 man-days per hectare.
This was almost three times of local T.Aman rice production.
Land Preparation cost (tk./ha)
The land ploughing cost was same for both T.Aman varieties as it was done by tractor or power tiller. For preparing one decimal of land by the machine operator took Tk.19- Tk.20 at fixed rate for Local T.Aman. And for preparing one decimal of land by the machine operator took Tk.26-Tk.27 at fixed rate for HYV T.Aman. Land preparation cost of local T.Aman is less because of one less number of plowing provided here. For preparing one hectare of land for Local T.Aman it costs tk. 4939.28. On the other hand for HYV T.Aman it costs tk. 6568.32 per hectare.
Machine for (weeding spraying/thrashing) (tk./ha)
For local T.Aman Tk. 850.64 needed for per hectare land weeding, spraying and thrashing machine. For HYV T.Aman Tk. 2064.47 needed for per hectare land weeding, spraying and thrashing machine.
Fretilizer and Manure
For Local T.Aman Urea, TSP, DAP, Gypsum, ZnSO4 and Manure used at the rate of 27.30 kg, 9.69 kg, 10.49 kg, 2.14 kg, 0.54 kg and 2.09 mound per hectare. No SSP and MOP is used here. On the other hand for HYV T.Aman Urea, TSP, SSP, DAP, MOP Gypsum, ZnSO4 and Manure used at the rate of 46.58 kg, 31.37 kg, 4.04 kg, 5.84 kg, 12.30 kg, 1.96 kg, 1.73 kg and 2.62 mound per hectare.
Page | 37 Pesticides and Supplementary Irrigation
For Local T.Aman Pesticides and Supplementary Irrigation cost was tk. 120.23 and tk.
118.92 per hectare. On the other hand for HYV T.Aman Pesticides and Supplementary Irrigation cost was tk. 302.04 and tk. 643.77 per hectare.
Table 6.1 Comparative Input Use Pattern of T.Aman Cultivation in Study Area Items Average Amount for
local T.aman
Average Amount for HYV T.aman Human labor requirement
(Man-days/ha)
57.68 172.76
Land Preparation cost (tk./ha) 4939.28 6568.32 Machine for (weeding
spraying/thrashing) (tk./ha)
850.64 2064.47
Seeds(kg/ha) 20.25 20.65
Fertilizers
Urea (kg/ha) 27.30 46.58
TSP(Kg/ha) 9.69 31.37
SSP(Kg/ha) 0 4.04
DAP(Kg/ha) 10.49 5.84
MOP(Kg/ha) 0 12.30
Gypsum(Kg/ha) 2.14 1.96
ZnSO4 (Kg/ha) 0.54 1.73
Manure (md/ha) 2.09 2.62
Pesticides(tk./ha) 120.23 302.04
Irrigation/ Supplementary Irrigation (tk/ha)
118.92 643.77
Source: Field survey, 2019
Page | 38 6.2 Cost and return Comparison of local T.aman and HYV T.aman
All variable cost incurred for human labor, land preparation, seedling, organic manure, fertilizers, insecticides, and irrigation were considered for calculating the cost of T.Aman rice cultivation. The cost of land use calculated on the basis of prevailing local lease value of land.
6.2.1 Variable cost
A variable cost is that expense which changes with proportion to production output. Variable costs increase or decrease depending on a farms production volume.
Variable cost is an important part of economic or financial analysis. To compute the profitability, we need to calculate the variable cost. The items included in variable cost is land preparation cost, hired labor cost, seed cost, organic manure, all chemical fertilizer cost (Urea, TSP etc.), irrigation and insecticide cost. From the table 6.2 we found that the total variable cost for local T.aman and HYV T.Aman was respectively Tk. 16921.83 and Tk. 42115.42 per hectare of land.
For local T.Aman it was 52.32 percent of its total cost and for HYV T.Aman variable was 57.48 percent of its total cost. For local T.Aman land preparation cost, hired labor cost, seed cost, organic manure, all chemical fertilizer cost (Urea, TSP etc.) , insecticide and irrigation cost were Tk. 4993.63, Tk. 9989.37, Tk. 777.93,Tk. 99.68, Tk. 1061.22 Tk.
207.45 and Tk. 213.24 which were15.44 percent , 30.98 percent, 2.40 percent, 0.30 percent, 3.28 percent, 0.64 percent and 0.66 percent of the total cost respectively.
For HYV T.Aman land preparation cost, hired labor cost, seed cost, organic manure, all chemical fertilizer cost (Urea, TSP etc.) , insecticide and irrigation cost were Tk.
6568.32, Tk. 30060.06, Tk. 2632.30,Tk. 193.64, Tk. 2661.1 Tk. 1423.29 and Tk. 2845.83 which was 8.96 percent , 41.02 percent, 3.59 percent, 0.26 percent, 3.36 percent, 1.94 percent and 3.88 percent of the total cost respectively.
6.2.2 Fixed cost
Fixed costs are those expenses that are not dependent on the level of output and does not change with an increase or decrease with the level of output change. The producers have to bear the expense even if the production is not undertaken. Total fixed cost for producing Local T.Aman and HYV T.aman was estimated Tk. 15415.96and Tk.
Page | 39 31153.84per hectare. This was 47.67 percent and 42.51 percent of total productin cost.
Fixed costs included land use cost and interest on operating capital which is described below.
6.2.2.1 Land use cost
Most of the farmers in the study area had own land for producing T.Aman rice. Land use cost was a fixed cost for the producers. Table 6.1 shows that the land use cost for local T.Aman and HYV T.aman was estimated Tk. 8,333.33 per hectare. The land use cost for loca T.Aman and HYV T.aman was 25.76% and 11.37% of total production cost respectively.
6.2.2.2 Interest on operating capital (IOC)
Interest on operating capital was calculated for 5 months for both local T.Aman