FACTORS AFFECTING PARTICIPATION IN RDA DEVELOPED IRRIGATION AND WATER DEVELOPMENT PROJECT: CASE
OF RICE GROWERS IN NORTHERN BANGLADESH
SURAIYA YESMIN
DEPARTMENT OF MANAGEMENT AND FINANCE SHER-E-BANGLA AGRICULTURAL UNIVERSITY
DHAKA-1207
JUNE, 2021
FACTORS AFFECTING PARTICIPATION IN RDA DEVELOPED IRRIGATION AND WATER DEVELOPMENT PROJECT: CASE
OF RICE GROWERS IN NORTHERN BANGLADESH
BY
SURAIYA YESMIN Reg. No. 19-10091
A thesis Submitted to
The Faculty of Agribusiness Management Sher-e-Bangla Agricultural University, Dhaka In partial fulfillment of the requirements for the degree of
MASTER OF SCIENCE (MS) IN
MANAGEMENT AND FINANCE SEMESTER: JAN-JUNE, 2021
APPROVED BY
Dr. Md. Sadique Rahman Mosammod Mahamuda Parvin Associate Professor Associate Professor
Supervisor Co-Supervisor
Dept. of Management and Finance Dept. of Management and Finance Sher-e-Bangla Agricultural
University
Sher-e-Bangla Agricultural University
Dhaka-1207 Dhaka-1207
Mosammod Mahamuda Parvin Chairman
Examination committee Dept. of Management and Finance Sher-e-Bangla Agricultural University
Dhaka-1207
CERTIFICATE
This is to certify that the thesis entitled “FACTORS AFFECTING PARTICIPATION IN RDA DEVELOPED IRRIGATION AND WATER DEVELOPMENT PROJECT: CASE OF RICE GROWERS IN NORTHERN BANGLADESH” submitted to the
Department of Management & Finance, Faculty of Agribusiness Management, Sher-e-Bangla Agricultural University, Sher-e-Bangla Nagar, Dhaka in partial fulfillment of the requirements for the degree of Master of Science (M.S.) in Management & Finance, embodies the result of a piece of bona fide research work carried out by SURAIYA YESMIN, Registration No. 19-10091 under my supervision and guidance. No part of the thesis has been submitted for any other degree or diploma.
I further certify that any help or source of information, as has been availed of during the course of this investigation has been duly acknowledged by the Author.
Dated:
Dhaka, Bangladesh Assoc. Prof. Dr. Md. Sadique Rahman Department of Management & Finance Sher-e-Bangla Agricultural University Sher-e-Bangla Nagar, Dhaka-1207
Department of Management & Finance Sher-e-Bangla Agricultural University
Sher-e-Bangla Nagar, Dhaka-1207, Bangladesh
DEDICATED TO MY
BELOVED MOTHER
ACKNOWLEDGEMENT
All praises are due to Almighty Allah, the Great, Gracious and Merciful, Whose blessings enabled the author to complete this research work successfully. Guidance, help and co- operation have been received from several persons or authority during the tenure of the study, the author is grateful to them all who made a contribution to this research work. Although it is not possible to mention all by names it will be an act of ungratefulness if some names are not mentioned here for their immense contribution to the accomplishment of this study.
In particular, the author takes the opportunity to express her deepest sense of gratitude her honorable supervisor Associate Professor Dr. Md. Sadique Rahman, Department of Management & Finance, Sher-e-Bangla Agricultural University, Dhaka for his continuous inspiration, valuable suggestions, constructive criticism, constant guidance and intensive supervision through the period of the study and preparation of this thesis without her intense- operation this work would not have been possible.
The author deems proud privilege to extend her extreme gratefulness and best regards to her venerable Co-supervisor Mosammod Mahamuda Parvin, Associate Professor, Department of Management & Finance, Sher-e-Bangla Agricultural University, Dhaka for her keen interest, valuable advice, creative suggestions, co- operation and encouragement to bring this thesis up to its present standard.
It is also a great pleasure for the author to express hearty appreciation and regard to all teachers of Department of Management & Finance, Sher-e- Bangla Agricultural University, Dhaka for their affectionate feelings and valuable suggestions during the research work.
The author deeply acknowledges the cooperation and sincere help of Md. Fedush Hossain Khan, project director, RDA, Upazila Agriculture Officer, Agriculture Extension Officer of Shajahanpur Upazila. The author also expresses her heartfelt gratitude to the respondents of the study area who patiently provided the information during the interview with the author.
ii
The author expresses her grateful thanks to all staff and employees of the Department of Management & Finance, Sher-e-Bangla Agricultural University, Dhaka-1207 for their co- operation and encouragement to prepare this thesis.
Last but not least, the author expresses her deepest sense of gratitude, indebtedness and profound respect to her beloved mother, grandmother, uncles, brothers, sister, relatives and friends for their blessings, encouragement and moral support in all phases of this academic pursuit from beginning to the end. At the end, I beg pardon to my well-wishers, for my inability to provide them all of the time they might have wanted from me.
The Author
ii
iii r
LIST OF CONTENTS
CHAPTER TITLE
ACKNOWLEDGEMENT
PAGE i TABLE OF CONTENT
LIST OF TABLES LIST OF FIGURES
iii vi vii LIST OF APPENDICES
ACRONYMS ABSTRACT
vii viii ix
CHAPTER I
1.1
INTRODUCTION General Background
1-05 1-3
1.2 Justification of the Study 3
1.4 Specific Objectives of the Study 4
1.5 Assumptions of the Study 4
1.6 Limitations of the Study 5
CHAPTER II REVIEW OF LITERATURE 06-10
CHAPTER III METHODOLOGY 11-19
3.1 Locale of the Study 11
3.2 Population and Sampling Design 11-14
3.3 Instrument for Data Collection 15
3.4 Measurement of Variables 15
3.5 Measurement of Independent Variables 15
3.5.1 Age 15
3.5.2 Education 16
3.5.3 Family size 16
3.5.4 Farm size 16
iv
3.5.6 Drought severity 17
3.5.7 Access to agricultural related credit 17
3.5.8 Total income of farmers 17
3.5.9 Total expenditure of farmer 17
3.6 Statement of the hypothesis 18
3.7 Collection of Data 18
3.8 Data Processing 19
3.9 Model Specification 19
Chapter CHAPTER IV
Title
RESULT AND DISCUSSION
Page 20-32
4.1 Socio-economic characteristics 20
4.1.1 Age 20
4.1.2 Educational status 21
4.1.3 Family size 21-22
4.1.4 Farm size 22
4.1.5 Training received 23
4.1.6 Access to agriculture related credit 23
4.1.7 Access to agriculture related information 24
4.1.8 Annual income status 24-25
4.1.9 Annual expenditure 25
4.2 Farmers Perception on RDA water developed project 26-30
4.2.1 Farmers Perception on fairness of institutional monitoring system
26
4.2.2 Farmers Perception fair distribution 27
4.2.3. Farmers Perception on reasonable water charges 28
4.2.4 Farmers Perception on increase of profit 29
4.2.5 Farmers Perception on increase income 30
v
4.3 Econometric Model Results 31
4.3.1 Significant contribution of education 32 4.3.2 Significant contribution of farm size 32
CHAPTER V SUMMARY, CONCLUSIONS AND RECOMMENDATIONS
PAGE
5.1 Summary 33-34
5.2 Conclusions and Recommendations 35
REFERENCES 36-39
APPENDIX 40-43
LIST OF TABLES
Table no Title Page 3.3 Distribution of populations, sample and reserve list 09
4.1.1 Age distribution 17
4.1.2 Education level distribution 18
4.1.3 Family size distribution 19
4.1.4 Farm size distribution 20
4.1.5 Farmers training received 20
4.1.6 Access to agriculture related credit 21
4.1.7 Access to agriculture related information 21
4.1.8 Annual income status 22
4.1.9 Annual expenditure status 22
4.4.1 Factors affecting project participation 26
vi
i
LIST OF FIGURES
Figure Title Page
3.1 A map of Sherpur upazila 10
3.2 A map of Shajahanpur upazila 11
4.2.1 Farmers perception on fairness of institutional monitoring system
23
4.2.2 Farmers perception on fair distribution 23
4.2.3 Farmers perception on reasonable water charges 24 4.2.4 Farmers perception on increase of profit 24
4.2.5 Farmers Perception on increase income 25
vii
13
ACRONYMS
RDA Rural Development Academy
DTW Deep Tube-well Water
FIM Faculty of Irrigation Management BBS Bangladesh Bureau of Statistics SPSS Statistical Package for Social Sciences ICT Information and Communication Technology FAO Food and Agriculture Organization
GDP Gross Domestic Product
UNFPA United Nations Population Fund BNFE Bureau of Non-formal Education
viii
1
FACTORS AFFECTING PARTICIPATION IN RDA DEVELOPED IRRIGATION AND WATER DEVELOPMENT PROJECT: CASE
OF RICE GROWERS IN NORTHERN BANGLADESH
SURAIYA YESMIN ABSTRACT
Northern regions of Bangladesh are particularly exposed to droughts. Rural Development Academy (RDA) situated in that part is engaged to deliver sustainable rural development through innovation and practices. This study identified the factors driving the participation of farmers in RDA developed irrigation project by employing descriptive statistics and logistic regression model. Primary data were collected from 100 respondents from Bamunia, Rohimabad, Katabaria, Shotibari and Chockpahari villages of Shajahanpur and Sherpur Upazilla under Bogura district through face-to-face interview.
Approximately, 77% of the respondents were under water development project.
The findings indicated that education of the respondent and farm sizes were crucial for project participation. To increase the project participation, this study also draws some recommendations such the relevant authority could invest on improving the knowledge of the farmers by educating them through training, ensuring the availability of such project in different locations can also help farmers to deal with water crisis during drought season.
ix
CHAPTER 1 INTRODUCTION
1.1 General Background
Bangladesh is made up of a flat, alluvial plain with apparently homogenous land resources. Bangladesh is an agricultural country that forms the world’s largest delta, with a total area of about 14.4 million hectors; 9.03 million hectors are used for agriculture, whereas 2.23 million hectors are covered by forest.is under forest.
7.56 million Hectors of the agricultural land are suitable for irrigation (BBS, 2020). Agriculture is usually the country’s main source of revenue. Around 90%
of country’s population lives in rural areas, with agriculture accounting for 80%
of their income. It is Asia’s fifth most populous country and the world eight largest. Bangladesh’s population growing at a rate is 1.37 percent with a current population of 164,689,383 (Sep, 2020) and a predicted population of 254,100,000 according to UNFPA. As a result the growing necessitates more food, putting a greater strain on the agriculture sector. Agriculture is the single largest producer, accounting for 12.68 percentages of the country’s overall Gross Domestics Products (GDP). Bangladesh’s GDP growth rate is mostly determined by the agricultural sector’s performance.
The northern region of Bangladesh in recent decades has been afflicted by recurrent and severe droughts, which in turn often led to intense food insecurity, known locally as Manga. Every year, generally from mid-September through mid-November, this crisis occurs. People call the period Mora Kartik, meaning the month of death and disaster. Too little water in the rivers during the dry seasons and less rainfall creates drought situations. Statistics show that 92% of water in Bangladesh comes via external rivers and only 8% is local rainfall (k Roy, 2015). The initial watersheds of all the major rivers in the region run through neighboring India, making Bangladesh is heavily dependent on India for the availability of water resources. These rivers are the lifeline for agriculture, industry and the domestic sectors.
However, the construction of barrages, hydroelectric dams, and other structural interventions in the upstream of these rivers heavily obstruct the normal flow of water towards Bangladesh. India often exploits these structures to withdraw water
in the dry months (generally from March to May) for irrigation, energy production and economic uses. It not only creates tremendous stress on surface water resources in the northern districts of Bangladesh, but also causes a significant decrease in groundwater recharge, resulting in the depletion of soil moisture.
The scarcity of water in these areas has also been exacerbated by the low and uneven distribution of rainfall in recent years due to the effects of climate change.
Drought is one of the major environmental stresses in the north that drastically limits the grain yield of rice, a staple food of Bangladeshi people. This causes a lot of people to become unemployed and fall into acute food shortage between late July and early November.
Ground water, renewable and dynamic natural resources serves the present civilization as a dependable source of water supply for agricultural and domestic purposes. Surface water resource might be the potential means of irrigation to our agriculture but because of its alternating abundance and scarcity characteristics failed to be a regular and reliable source of irrigation. So, the scientists have no other obvious choice than abstracting sub- surface water for irrigation purpose.
Rural Development Academy (RDA), Bogra is a national level training and research institute of rural development established in 1974 under the Ministry of Local Government, has been working on a wide range of rural development activities with slightly more emphasis on exploring and managing water resources as a means of rural development.
CIWM a special wing of RDA conducts action researches by emphasizing irrigation and water management as means of improved agricultural practices for sustainable rural development. Since its inception, it has been continuing action research projects to generate additional employment opportunities in rural areas through irrigation and water management technologies. It has already successfully completed (2001-2016) nine action research projects. Irrigation and water management related projects have done a significant achievement in boosting up agricultural production and diversification of crops through improved water distribution system, improvement in the irrigation management programed, construction of appropriate irrigation channel and command area development of an irrigation equipment. Hence, the importance of irrigation is, however, the
availability of irrigation facilities which is highly inadequate in northern Bangladesh. Insufficient, uncertain and irregular rain causes uncertainty in agriculture. The period of rain is restricted to only four months in a year, June to September, when monsoon arrives. The remaining eight months are dry. There is some rainfall during the months of December and January in some parts of the country. Even during monsoon, the rainfall is scanty and undependable in many parts of the country. Sometimes the monsoon delayed considerably while sometimes they cease prematurely. This pushes large areas of the country into drought conditions. With the help of irrigation, droughts and famines can be effectively controlled. Irrigation Project facilities designed to provide water to land for the purpose of irrigation in the project areas. Irrigation projects impacts vary across countries and among beneficiaries. In most cases, benefit distribution of the projects is proportional to the amount of irrigated land worked by a farmer.
Farmers with larger landholdings have benefited more relative to small and marginal farmers, particularly irrigation tail-end users. Thus the factor that affects the project participants is important for further development.
1.2 Justification of the Study
Improved agricultural practices for sustainable rural development are still dominating our economy in terms of employment, though not in terms of GDP.
Agriculture traditionally had been dependent on rain fed irrigation. But with the advent of science and technology and under the pressure of a very fast growing population, modernization of agriculture became inevitable. Though the northern part of our country suffering water crisis Rural Development Academy (RDA), Bogura has successfully carried out experiments in the field of water resources management and development since 1982, especially, in respect of optimum utilization of scarce water resources and has developed multi-purpose models.
Needless to say that research is necessary to determine pattern of water development projects in agricultural sectors in order to formulate long-term strategy on crops production. As no research in this field so far, the researcher deemed it timely necessity to undertake the present study entitled “Factors affecting participation in RDA developed irrigation and water development project: case of rice growers in northern Bangladesh”.
1.3 Specific Objectives of the Study
The purpose of research objectives is to drive the research project, including data collection, analysis and conclusions. Research objectives also help you narrow in on the focus of your research and key variables, guiding you through the research process. The following specific objectives were set forth in order to proper direction to the study:
1. To assess the socio-economic profile of the respondents; and 2. To identify the factors affecting project participation
1.4 Assumptions of the Study
An assumption is the supposition that an apparent fact or principle in true in the light of the available evidence (Good and Hatt, 1945). The researcher has the following assumption in mind while undertaking this study:
1. The responses furnished by the respondents were reliable. They expressed the truth about their opinion and interest.
2. The researcher who acted as interviewer was adjusted to social and environmental conditions of the study area. Hence, the data collected by the researcher from the respondents where free from bias.
3. The respondents included in the sample for this study were competent enough to furnish proper responses to the queries included in the interview schedule.
It included in the sample for this study were competent enough to furnish proper responses to the queries included in the interview schedule.
1.5 Limitations of the Study
The present study was undertaken with a view to know the factors affecting RDA’s project participation by the farmers. In order to conduct the research in a meaningful and manageable way, it became necessary to impose some limitations as noted below:
1. Characteristics of the study are many and varied but only few were selected for investigation in this study as stated in the objectives. This was done to complete the study within limited resources.
2. Facts and figures were collected by the investigator applied to the present situation in the selected area.
3. The findings could be applicable for the study area and similar situations in physical, socio-economic cultural and geographic conditions only.
4. During the period of data collection, the researcher had to depend on the data furnished by the respondents during their interview with him. As none of the farmers kept records of their farming activities, they furnished information to the different questions by recall.
6. In some cases, the researcher faced unexpected interference from the over interested side talkers while collecting data from target respondents. However, the researcher tried to overcome the problems as far as possible with sufficient tact and skill.
CHAPTER II
REVIEW OF LITERATURE
Review of literature refers to the works already done in the general area provide an exposure, necessary to determine the priority of what ought to be studied. Literature and research of the major past works in connection with the present study were searched in the relevant libraries and research institutions, because this knowledge and information provide guideline in designing the future research problem and validation of new findings. To find out the factors affecting project participation and its relationship with selected characteristics of the farmers were the main task of the study. This Chapter contains synthesis of selected literature those were related to the present study. The researcher made an elaborate search of available literature for this purpose. There was no literature directly related to the present study. Therefore, the present researcher searched relevant studies conducted by different scientist and authors on the impact of the irrigation and water development project on rice productivity and employment generation. The findings of such studies related to the extent the farmers and other partial studies have been reviewed and discussed in this Chapter.
2.1 Literature Review on content of water development project:
KY Mohammed (2002) reviewed existing irrigation types in Nigeria and implications for sustainable food security in target communities. Also, it provides an insight into the catalogue of consequences that followed the project. Some of these include farmers' dispossessed of their productive farmlands, fraudulent reallocation processes, inadequate compensation and destruction of economic trees and crops as a result of the irrigation site. Evidences from the project shows that the project brought about certain positive developments in the lives of the target population. However, it was not devoid of undesirable challenges that require considerable attention in development project planning and implementation. These and many other issues surrounding the Bakolori irrigation project raises question on whether the project was a development or a catastrophe. Consequently, suggestions are made on how to design and implement development programs with an overall view to improving the existing circumstances of the intended beneficiaries.
Mukand et al. (2007) the general concepts and elements of integrated water resources Management and the status of their adoption in Bangladesh at the national level. It describes the situation of the country with respect to the duality in the seasonal pattern of rainfall, the geographic position and the topography of the study area, which are the main constraints to its socio-economic development. An assessment of the past management practices in water sector identifies hindrances in the implementation of integrated water resources management process.
Mohammad et al. (2016) examined that a monthly irrigation planning model is formulated for determining the optimal cropping pattern and the groundwater abstraction requirement in an existing groundwater development project. Two objectives, maximization of net economic benefit and maximization of irrigated area, aspired to by both the irrigation authority and the individual farmers in the Sukhothai Groundwater Development Project in Thailand are considered. To account for uncertainty in water resources availability, the model is solved for three levels of reliability of rainfall and groundwater resources (80, 50 and 20%). The selected decision makers in the Sukhothai Project collectively allocate almost half of the total weight to reliability (or risk) factors, while the remaining preference is almost equally divided between the two objectives of the study. On average, they seem to prefer the planning alternative corresponding to average (hydrologic) conditions and full irrigation without any deficit.
Ahmed et al. (2019) revealed that in Bangladesh ground water levels are highest from August from October and lowest in April and May. A sharp rise in water level generally begins in May and continues until July. The range of fluctuations is from three to six meters in most areas. After July, the rate of rise deceases and in many areas ground water levels remain almost stationary from August to October, including the rejection of recharge because the acquitter is failed to capacity. The rejected recharge varies from place to place and depends upon several factors, including permissibility of surface materials, rainfall amount and intensity and the time factor.
Highest potential recharge occurs in Dinajpur, Mymensigh, Sylhet, Noakhali and Chittagong and the lowest potential recharge occurs in Rajshahi, Kustia and Pabna.
Kumar et al. (2013) made a study show that the values of geometric means of all the inputs were relatively higher increase of beneficiary farmers. Thus, the beneficiary enjoyed a higher gain in the gross income as compared to the gain realized by the non-beneficiaries. The results of decomposition analysis revealed that the income from water management practices in respect of beneficiaries would be more, even if they use same levels of inputs when compared to non- beneficiaries indicating that the water practices brought about an immediate upward shift in income from rice production. The contribution of input use was found to be 4.45 percent. It was also observed that the beneficiaries were better allocators of inputs when compared to non- beneficiaries. This clearly brings about the impact of water management practices on rice crop using inputs without risk and harvesting better yields when compared to non-beneficiary farmers.
Parvin et al.(2009) examined the growth of irrigated area and its impact on food grain production during last three decades. Different statistical methods such as mean, percentage, linear and exponential growth model were applied for get-ting meaningful findings. Various technologies have been used for irrigating crops. The conventional irrigation methods were replaced by modern methods. In addition, surface water irrigation also sharply declined, losing its importance due to lack of new surface irrigation project and the ineffectiveness of earlier project. Groundwater covered 77 percent of total irrigated area and major (62%) extractions occurred STWs. The rapid expansion of ground water irrigation in respect to STWs irrigationwas due to government’s withdrawal on restrictions on tube well setting rule, encouraging private sector and the cost effectiveness of Chinese engine which have been affordable to the small and medium farmers. Irrigated area thus, increased by about three times and cropping intensity also increased from 154 to 176 percent. Boro rice, an irrigated crop, consumed 73 percent of the total crop irrigation and contributed to a greater extent in total rice production in Bangladesh. The higher productivity of boro rice has almost helped the nation to meet her food requirements (about 24 Million MT). Boro rice production was highly correlated (r = .978) with irrigated area. Expansion of one hectare of irrigated area added 3.22 MT of boro rice in Bangladesh. Finally, the study suggested for expansion of irrigated areas (ground water and surface water), adoption of modern technologies and formulation of farmers’ friendly policy.
Zahid et al. (2011) reported on groundwater resources development in Bangladesh and also found out the contribution to irrigation for food security and constrains to sustainability. This study revealed that the groundwater resources are one of the key factors in making the country self-sufficient in food production. Ground water irrigated agriculture plays an important role in poverty alleviation and has greatly increased food production. Authors also mentioned that until now, availability of groundwater has not been a constraint to agricultural development. But this resource is increasingly facing varies problems including quality hazards in many areas.
Matin et al. (2000) conducted a research that the total cost of RDA developed varies ranges 0.5 to 5 lac and 100% owner’s favored this RDA developed low cost DTW technology due to its low cost, local quality materials and simple drilling technique.
Again 64% of owner/users advocated in favors of this technology for its fully automatic system low power consumption and over the benefits.
Uddin et al.(2019) conducted a that study examined the effectiveness of groundwater service providers of Bogura and Chapainawabgonj districts in Northwest Bangladesh by employing qualitative approach. Findings reveal that though majority of the farmers are dependent on institutional groundwater service providers, namely Barind Multipurpose Development Authority, Bangladesh Agriculture Development Corporation, and Rural Development Academy for groundwater irrigation, the share of individual tube-well owners is increasing noticeably. Provider specific effectiveness was assessed based on managerial, operation, and economic efficiencies.
It is found that water buyers mostly prefer individually owned tube- wells for irrigation instead of institutional providers. Good service delivery, good operational and managerial practices, comparatively low irrigation charges, and regular water supply are the important factors motivated water buyers to choose individual service providers over institutional providers.
Aung, et al.(2017),conducted a research in Myanmar, the government has made a vast investment in the construction of dams to improve crop productivity and to ensure socioeconomic development. This study explores the differential impacts, in terms of socioeconomic conditions, of these investments for paddy farmers in Yedashe Township, in the Bago region in the south-central part of Myanmar. A farm survey
among 95 respondents is used to compare the situation before and after the construction of a dam. It is observed that after the installation of the dam, the farmers could practice double rice cropping enabling them to gain higher income. The income of the farmers increased by benefiting from higher crop productivity, more crops per year and more benefits over variable costs. However, the study additionally explored the problems of unequal water access and farmer-oriented solutions to these problems.
Hedaytul (2018) explained that, Irrigation and water management related projects like ITRTT, IMP and TCAD have done a significant achievement in boosting up agricultural production and diversification of crops through improved water distribution system, improvement in the irrigation management program, construction of appropriate irrigation channel and command area development of an irrigation equipment.
It is clear from above study that very little information is available regarding the factors affecting participation in an irrigation project. Therefore, in this study the factors behind the participation in an irrigation project are identified. Findings will help the policymaker to identify the facts which will also help to formulate the future policy. Findings also help the extension workers to rearrange the extension techniques.
CHAPTER III METHODOLOGY
Research methodology is a systematic way to solve a research problem. It deserves a very careful consideration and its importance can’t be undermined in conducting any research. Methodology deserves a very careful consideration in conducting scientific research. Importance of methodology in conducting any research cannot be undermined. Methodology enables the researcher to collect valid and reliable information and to analyze them properly to arrive at correct decisions. Keeping this point in view, the researcher took utmost care for using proper methods in all the aspects of this piece of research work. Methods and procedures followed in conducting this study has been described in this chapter.
Research design a roadmap for the research formulating a research hypothesis, then some related research was viewed. For conducting the research the followings were to be considered.
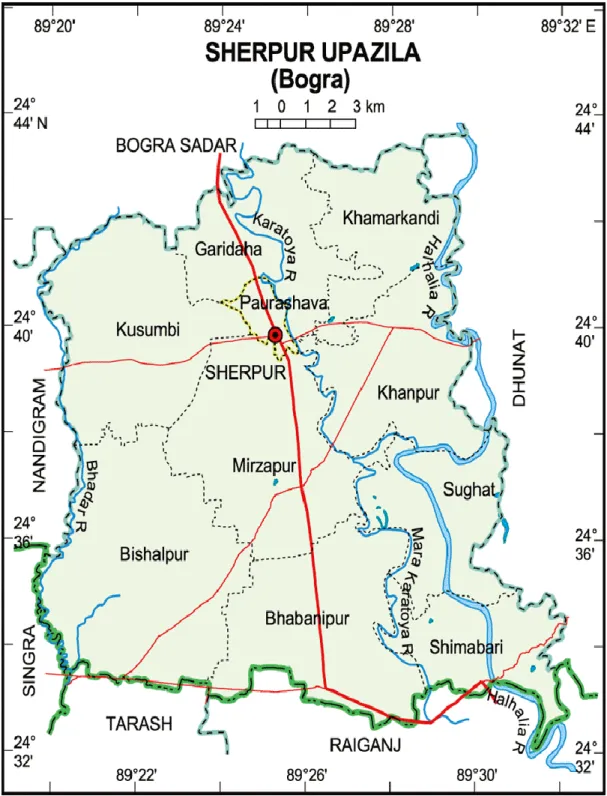
3.1 The Location of the Study
Bamunia, Rohimabad and Katabaria villages of Shajahanpur Upazilla and Shotibari and chockpahari villages of Sherpur upazilla under Bogura district was purposefully selected due to easy communication as well as easy contact with the farmers who are under the project or not. These locations are about 25km and 15km respectfully from Bogura town.
3.2
Population and Sampling design
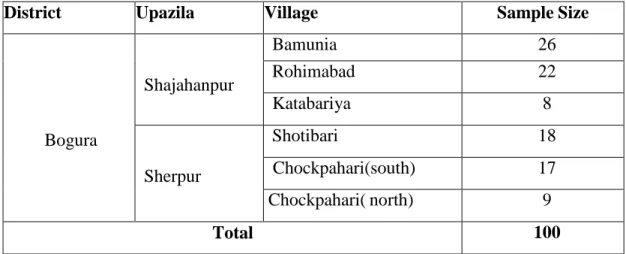
The farmers of the selected villages were the population of the study. A total of 100 farmers were selected for this study of which 77 farmers are project participants and rests of them were non-participants. If anyone included in the original sample were unavailable during the data collection in the study area under this research, the next farmers regarding that list were considered turn by turn for collecting data. The distribution of population sample and reserve list are shown in the Table 3.1
Table 3.1 Distribution of populations and sample
District Upazila Village Sample Size
Bogura
Shajahanpur
Bamunia 26
Rohimabad 22
Katabariya 8
Sherpur
Shotibari 18
Chockpahari(south) 17
Chockpahari( north) 9
Total 100
The farmers of the sected villages seen from the table Bamunia, Rahimabad and Katabaria under Shajahanpur Upazila and Shotibari, Chockpahari( South) and Chockpahari(North) under Sherpur upazilla were the population for that study.
Map for the both upazilla of Bogura district are given bellow-
Figure 3.1 a map of Sherpur upazila, Bogura
14
Figure 3.2 a map of Shajahanpur Upazila, Bogura
3.3 Instruments for Data Collection
In order to collect reliable and valid Information from the farmers, an interview schedule was prepared carefully keeping the objectives of the study in mind. The interview schedule contained both open and closed form questions. Appropriate schedule was also developed to operationalize the selected characteristics of the farmers. The draft interview schedule was prepared in English version and was pre- tested with the farmers. This pre-test facilitated the researcher to examine the suitability of different questions and statements in general. The interview schedule seen at Appendix-A
3.4 Measurement of Variable
A variable is any characteristic, which can assume varying, or different values in successive individual cases (Ezekiel and Fox, 1959). An organized research usually contains at least two important variables, viz. an independent and a dependent variable. An independent variable is that factor which is maintained by the researcher in his attempt to ascertain its relationship to an observed phenomenon. A dependent variable is that factor which appears, disappears or varies as the researcher introduces, removes or varies the independent variable (Townsend, 1953). According to the relevant research area, the researcher selected 9 characteristics of the project participants as independent variable and adoption of the project as the dependent variable.
3.5 Measurement of Independent Variables
The independent variables of the study were age, education, farm size, family size, and access information, access to credit, annual income, annual expenditure and drought severity. The procedures followed in measuring the independent variables are briefly discussed below.
3.5.1 Age
In the study, all categories of farmers of the study area were classified into different age groups. First group ages range between 20-30 years. Second group ages range from 31-50 years and the last group were selected who are more than 51 years. This variable appears in the interview schedule in Appendix-A.
16
3.5.2 Education
Education was measured in terms of successful years of schooling. Education for all farmers were categorize into four groups. First group present illiterate group (0-1), Second group indicated primary education (2-5), third group represent high school or secondary school (6- 10) and last group refers college or more (12).
This variable appears in the interview schedule as presented in Appendix-A.
3.5.3 Family size
In this study, family size was divided into three separate group namely small family (up to 4 people), medium family (5-7 people) and lastly large family (more than 7 people). This variable appears in the interview schedule as presented in Appendix-A.
3.5.4 Farm size
The farm size of farmer referred to the total area of land, on which his family carried out farming operations, in terms of full benefit to his family. The farm size was measured in hectares for each farmer using the following formula:
The data were first recorded in term of local unit i.e. bigha and then converted to hectare. Total farm size of each respondent was categorized into 5 types (Islam, 2007).
The farmers who had land bellow 0.02 hectare were considered as landless farmer.
The farmers who had land between 0.02-.20 hectare were considered as marginal farmers
the farmers who had the land between 0.2-1.00 hectare were considered as small farmers
The farmers who had land between 1.01-3.0 hectare of land considered as medium farmers and above 3hectare considered as large farmers This variable appears in the interview schedule as presented in Appendix-A.
3.5.5 Drought severity
In this study, severity of extreme event were classified into different category namely extreme severe (4), moderate severe (3), low severe (1) and lastly none for zero. This variable appears in the interview schedule as presented in Appendix-A.
3.5.6 Training received
In the study, all categories of farmers of the study area were classified into different training receive group. The first group indicated lower training received group (less than 4 days), second group were medium training received group (5-7 days) and last group of training receive group is high training receive group (above 8 days). This variable appears in the interview schedule as presented in Appendix-A.
3.5.6 Access to agriculture related credit
This independent variable is categorized into only two types. The farmers who receive agriculture related credit were defined yes and on the other hand the farmers who didn’t receive any agriculture related credit mentioned it no. This variable appears in the interview schedule as presented in Appendix-A.
3.5.7 Total annual income of the farmers
In this study, the annual income of farmers is divided into different categorized.
The first category were the group of farmers whose annual income is less than Tk.500000, second category referred the farmers group whose income is ranges from Tk.500001-2500000, and the last group were categorized into the group of farmers whose income is more than Tk.251000. This variable appears in the interview schedule as presented in Appendix-A.
3.5.8 Total expenditure of the farmers
In this study, the annual income of farmers is divided into different categorized.
The first category were the group of farmers whose annual expenditure is less than Tk.100000, second category referred the farmers group whose expenditure is ranges from Tk.101000- 300000 and the last group were categorized into the group of farmers whose expenditure is more than Tk.800000. This variable appears in the interview schedule as presented.
3.6 Statement of the Hypotheses
In order to guide relevant data collection, analysis and interpretation of data, a set of hypothesis would be formulated for empirical testing. As defined by Goode and Hatt (1952), "Hypothesis is a proposition which can be put to test to determine its validity. It may seem contrary to, in accord with common sense. It may prove to be correct or incorrect. In any event, however, it leads to an empirical test." In broad sense, hypothesis may be dividedinto two categories, namely, research hypothesis (HO) and null hypothesis (HA). In studying relationships between variables an investigator first formulates research hypothesis which states anticipated relationships between the variables. On the other hand, for statistical test, it becomes necessary to formulate null hypothesis. A null hypothesis states that there is no contribution with the concerned variables. The following null hypothesis would be formulated to explore the relationship of the selected characteristics of the growers and there is no significant contribution with the selected characteristics of the growers.
H0: There is no contribution of independent variable on project participation HA: There is a contribution of independent variable on non-participation.
3.7 Collection of Data
The researcher herself collected data from the farmers by using the interview schedule. The interviews were conducted individually in the houses of the respondents. Only ten farmers of the original list were not available during interview and hence ten farmers were replaced from the reserve list. Prior information was given to the respondents before going to them for interviewing.
The researcher took all possible care with the help of project field officer to establish rapport with them. She obtained excellent cooperation from the respondents and others concerned during the time of interview. The entire process of collecting data took 10 days from February 17 to February 27, 2021.
3.8 Data Processing
A detail coding plan was prepared. Data were coded into an excel sheet. These were then compiled, analyzed through strata software in accordance with the objectives of the study. Qualitative data were converted into quantitative form by means of suitable scoring for the purpose of analysis.
3.9 Model Specification
3.9.1 Factors affecting project participation
Binary logistic regression used for find out factors affecting project participation by seeing the marginal effect. Marginal effects are a useful way to describe the average effect of changes in explanatory variables on the change in the probability of outcomes in logistic regression and other nonlinear models. Marginal effects provide a direct and easily interpreted answer to the research question of interest.
Following logit regression model is used
Pr (Y=1/x) = F (z) =b0+b1X1+b2X2+…….+bnXn +ei Here,
F = is the logistic cumulative distribution function ei= Error term
X1, X2,…….,Xn= independent variables (Age, Education, Farm size, Family size, Training received, Access to credit, Access to Information, Total income, Total expenditure)
Marginal effect depends on all the variables, even without interaction effects.
Marginal effect is a useful way to describe the average effect of changes in explanatory variables on the change in the probability of outcomes in logistic regression and other nonlinear models.
CHAPTER IV
RESULTS AND DISCUSSION
This chapter provides results on socio-economic characters and logit regression model for assessing the factors determining participation choices.
4.1 Socio-economic characteristics
4.1.1Age Distribution
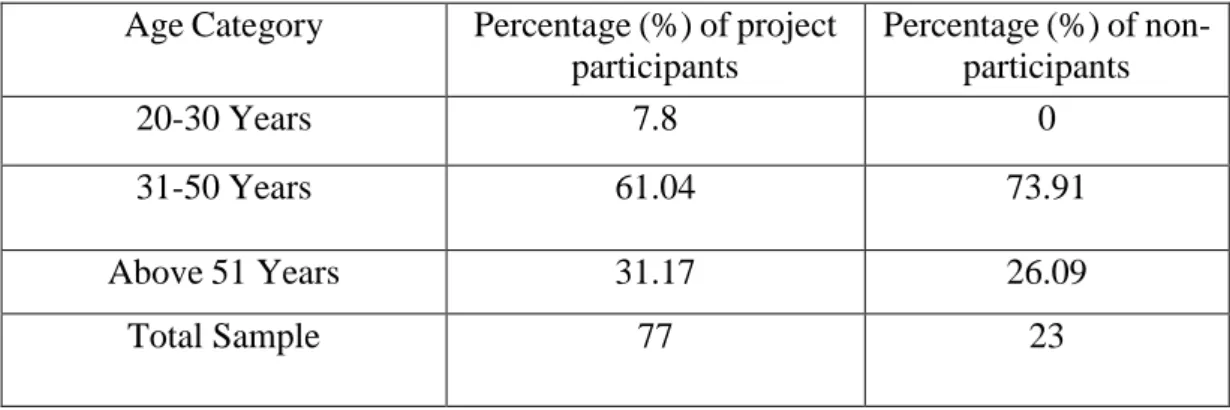
In the study, all categories of farmers were classified into different age groups as presented in table 4.2.1. It is evident from the table that most of the farmers were middle aged in the study area. Out of the 77 sample farmers 7.8 percent belonged to the age group of20-30 years, 61 percent belonged to the age group of 31-50 years and 31.2 percent fell into the age group of above 51 for project participants. Out of total 23 sample farmers 73.9 percentages belonged to the group of 31-50 years and 26.1 percentages fell into the age group of above 50 years old. This finding imply that majority of the sample farmers were in the most active age group of 31-50 years indicating that they provided more physical efforts for farming.
Table 4.1.1 Age Distribution
Age Category Percentage (%) of project participants
Percentage (%) of non- participants
20-30 Years 7.8 0
31-50 Years 61.04 73.91
Above 51 Years 31.17 26.09
Total Sample 77 23
Source: Field Survey, 2021
4.1.2 Educational status
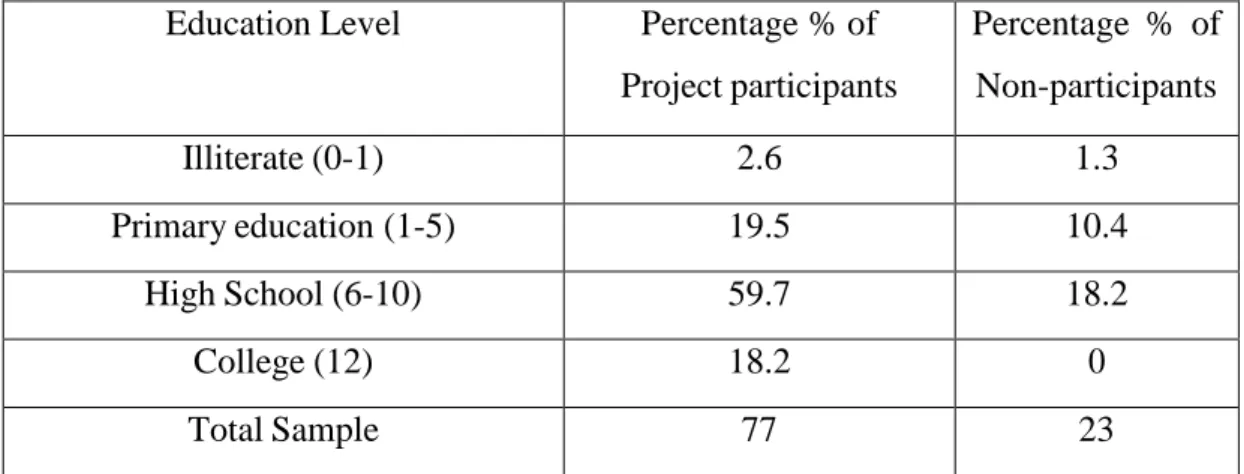
Bangladesh it has, an adult literacy rate of 76.20% (BBS, 2021). Table 4.2.2 shows for project participants 2.6 percent farmers were illiterate, 19.5 percent farmers had primary education,
59.7 percent farmers had completed secondary level education, 18.2 percent farmers had completed their higher secondary level education. For non- participants, 1.3 percent farmers were illiterate, 10.4 percent farmers had primary education, 18.2 percent farmers had completed secondary level education and no farmer had completed their higher secondary level education.
.
Table 4.1.2 Education Level Distribution
Education Level Percentage % of Project participants
Percentage % of Non-participants
Illiterate (0-1) 2.6 1.3
Primary education (1-5) 19.5 10.4
High School (6-10) 59.7 18.2
College (12) 18.2 0
Total Sample 77 23
Source: Field Survey, 2021
4.1.3 Family Size
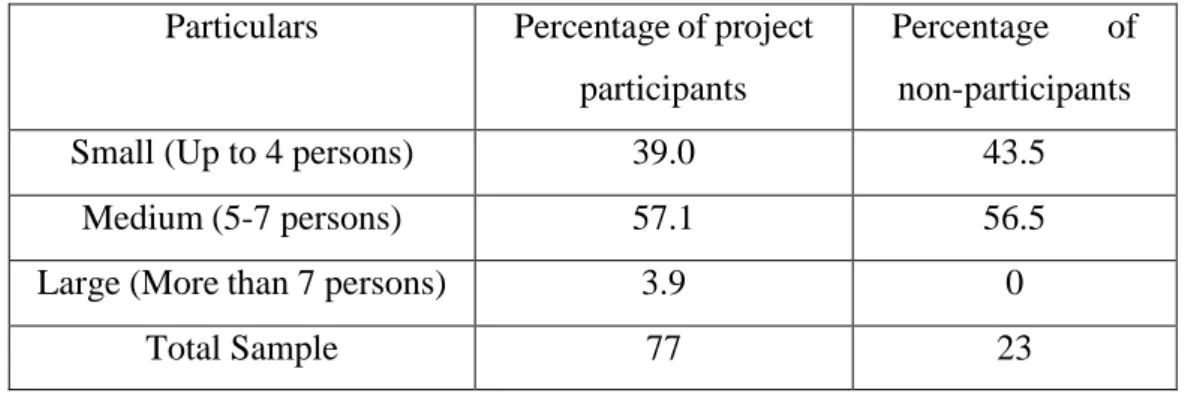
In the study, all categories of farmers of the study area were classified into different family size as presented in table 4.1.3. Out of the 77 sample farmers 39 percent belonged to the group of small family, 57.1 percent belonged to the group of Medium family and 3.9 percent fell into the group of large family for project participants. Out of total 23 non-participant farmers 43.5 percentages belonged to the group of Small family, 56.5 percentages belonged to the group of Medium family and zero percentage fell into the age group of large family. These findings imply that majority of the sample farmers were Medium family.
Table 4.1.3 Family Size distribution
Particulars Percentage of project participants
Percentage of non- participants
Small (Up to 4 persons) 39.0 43.5
Medium (5-7 persons) 57.1 56.5
Large (More than 7 persons) 3.9 0
Total Sample 77 23
Source: Field Survey, Feb 2021
4.1.4 Farm Size
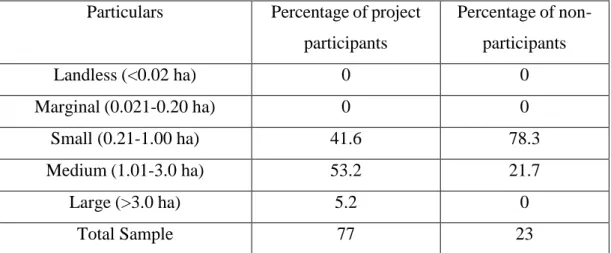
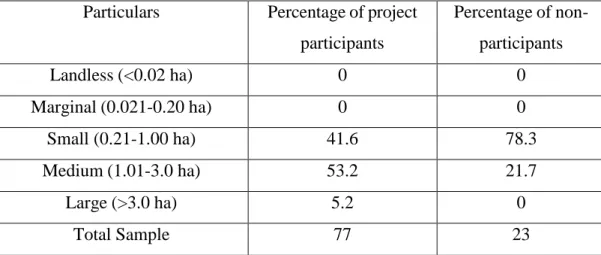
Table 4.2.6 indicates that for project participants the medium farm holder constitutes the highest proportion 53.2 percent followed by small farm holder 41.6 percent, whereas 5.2 percent was large farm holder. Again for non-participants the small farm holder constitute the highest proportion 78.3 percent followed by medium farm holder 21.7 percent where other holding zero percent. The findings of the study reveal that majority of the farmers were small to medium sized farm holder.
Table 4.1.4 Farm Size distribution
Particulars Percentage of project participants
Percentage of non- participants
Landless (<0.02 ha) 0 0
Marginal (0.021-0.20 ha) 0 0
Small (0.21-1.00 ha) 41.6 78.3
Medium (1.01-3.0 ha) 53.2 21.7
Large (>3.0 ha) 5.2 0
Total Sample 77 23
Source: Field survey, 2021
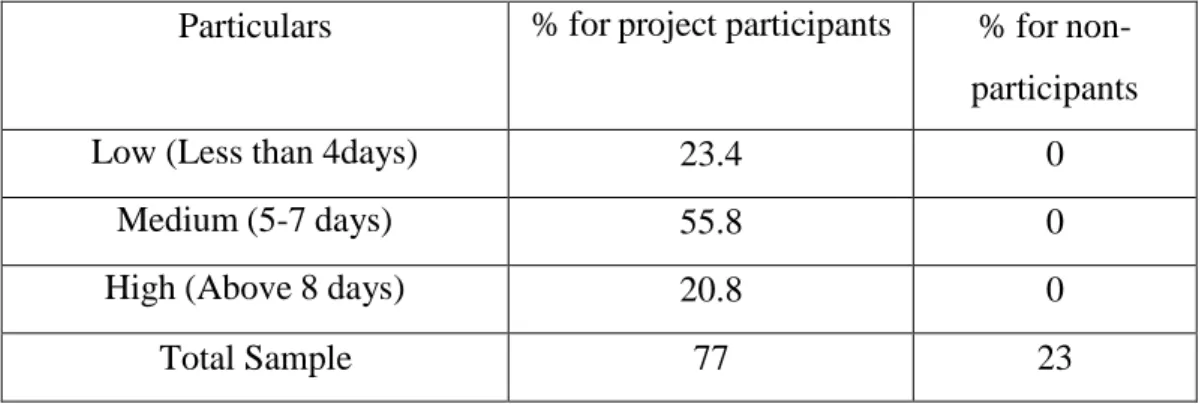
4.1.5 Training received
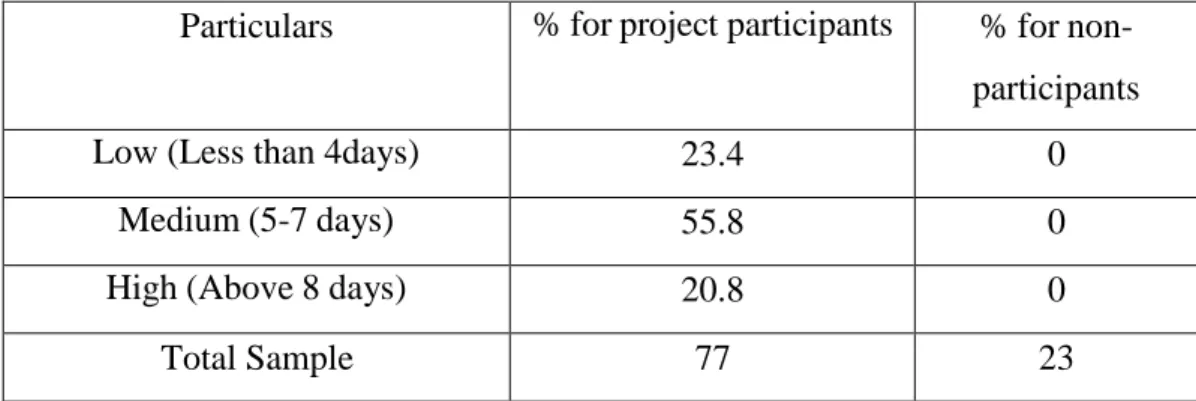
Table 4.1.5 indicates that most of the (55.8%) received training for 5 to 7 days whereas non- participants didn’t received training from RDA. About 20% of farmer received training for more than 8 days. The findings of the study reveal that majority of the farmers were small to medium training holder.
Table 4.1.5 Farmers training received
Particulars % for project participants % for non- participants
Low (Less than 4days) 23.4 0
Medium (5-7 days) 55.8 0
High (Above 8 days) 20.8 0
Total Sample 77 23
Source: Field Survey, 2021
4.1.6. Access to agricultural credit
Table- 4.1.6 showed that only 14.3% of the participants had access to credit, while about 17% of non-participants had access to agricultural training.
Table-4.1.6 Access to agriculture related credit
Particulars
% for project participant % non-participant
YES NO YES NO
Access to Ag. Related credit 14.3 85.7 17.4 82.6
Total Sample 77 23
Source: Field survey, 2021
4.1.7 Access to agriculture related information
Accurate weather forecasting and its accessibility to farmers play a very important role, particularly in determining planting and harvesting times of crops. However, table 4.1.7 shows that for project participant the major source of getting information was from Extension worker and that is 61%, where other farmer got information from radio & TV (2.6%), NGO worker (15.6%), Neighbor (1.3%) , Service Provider (5.2%) and 14.3% farmer got information from others source like through mobile phone. One the other hand for non- participant, Most of the farmers got information from NGO worker (29.1%), Others services like mobile phone (20.1%), extension worker (17.4%), radio & TV (8.7%) and from neighbor (2.6%) respectively.
Table 4.1.7 Access to agriculture related information
Particulars % for participants % for non-participants
Radio & Television 2.6 8.7
NGO Worker 15.6 29.1
Extension Worker 61 17.4
Neighbor 1.3 2.6
Service provider 5.2 20.1
Others 14.3 6.1
Total Sample 77 23
Source: Field survey, 2021
4.1.8 Annual income status
Almost 20.80 percent of the population lives in poverty, and 10.30 percent of the population live in extreme poverty (BBS, 2020). The $1.90/person/day Purchasing Power Parity (PPP) line is the current definition of extreme poverty (World Bank, 2011). For project participants it is evident from the table 4.2.14 that 5.2% farmers are below the extreme poverty line, which indicates that their yearly income below Tk.
56000.
Most of the farmer’s yearly income belonged to the category of Tk. 57000-250,000 and it is 50.6% and we can also see 44.2% of the farmer income was above 251000tk.
On the other hand for non-participants table 4.1.8 also shows 24.4% farmers were below the poverty line, which is much higher than participants. About 56.5% and were under the category of 57000- 250000. So from this we can conclude that the farmers who under the project are more income than non-participants.
Table 4.1.8 Annual income status (tk.)
Level of Income (Tk) % for project participant % for non-participant
Less than 56000 5.2 24.4
57000-250000 50.6 56.5
More than 251000 44.2 19.1
Total Sample 77 23
Source: Field Survey, 2021
4.1.9 Annual expenditure
:These findings show that most of the farmer’s annual expenditure was under the group of Tk. 100000 to 200000.
Table 4.1.9 Annual expenditure status (tk.)
Level of Expenditure (Tk) % for project participant % for non-participant
Less than 100000 47.83 35.06
100000-200000 52.17 62.34
200001-300000 0 0
More than 300000 0 2.6
Total Sample 77 23
Source: Field survey, 2021
4.2 Farmers Perception on RDA Water Developed Project
4.2.1 Farmers perception on fairness of institutional monitoring system
The observed perception scores of the respondents ranged from 1 to 5. The mean score was 4.83 with the standard deviation of 0.44. Based on their perception, the respondents were classified into five categories namely, strongly agree, agree, no opinion, disagree, strongly disagree. The distribution of the farmers according to their perception shown in the Figure no 4.2.1 that shows 86% of farmers strongly agree that institutions monitoring system is fair.
Figure 4.2.1 farmers perception on fairness of institutional monitoring system
4.2.2 Farmers Perception on fair distribution
The distribution of the farmers according to their perception shown in the Figure no 4.2.2 that shows 74% of farmers generally agree that the project ensure a fair distribution system
Figure 4.2.2 Farmers perception on fair distribution
4.2.3 Farmers Perception on reasonable water charges
The distribution of the farmers according to their perception shown in the Figure no 4.2.3 that shows 64.9% of farmers strongly agree and 35.1% of the farmer are agree that water charges are reasonable.
Figure 4.2.3 Farmers perception on reasonable water charges
4.2.4 Farmers Perception on increase of profit
The distribution of the farmers according to their perception shown in the Figure no 4.2.4 that shows 36.4% of farmers strongly agree and 63.6% of the farmer are agree that the project make a significant impact on increase of profit.
Figure 4.2.4 Farmers perception on increase of profit
4.2.5 Farmers Perception on increase income
The distribution of the farmers according to their perception shown in the Figure no 4.2.5 that shows 90.9% of farmers strongly agree and 7.8% of the farmer are agree that the water development project has a great impact on increasing income of farmers.
Figure 4.2.5 Farmers perception on Increase Income
4.3 Econometric Model Results
Table 4.3.1 presents the results of the logistic regression of estimated parameters and marginal effects. Overall, the model offers a good fit with factors predicting the participation of the project by the study farmers. The significant statistics indicate the strong explanatory power of the model. Goodness of fit of the model given by the pseudoR2 also indicates good fit of the model. Out of 7 independent variables, education of the respondent and farm size significantly affected project participation.
Table 4.3.1 Factors affecting project participation Independent
variable
Dependent variable ( project participation)
Coefficient Standard error Z value Marginal effect
Constant -4.166 2.678 -1.560 -
Age 0.028 0.045 0.610 0.003
Education of respondent
0.244* 0.130 1.880 0.027
Education of spouse
-0.027 0.105 -0.260 -0.003
Family size -0.160 0.369 -0.430 -0.017
Farm size 2.258*** 0.836 2.700 0.250
Drought severity 0.406 0.547 0.740 0.045
Total income 0.069 0.292 0.210 0.060
Model diagnostic
No. of observation: 100 Pseudo 𝑅2=0.21
LR Chi squre= 22.79**
Log Likelihood= =42.53
Note: ***p<0.01 *p<0.1
4.3.1 Significant contribution of education on the farmers’ project participation
The following observations were made on the basis of the value of the concerned variable of the study under consideration.
The influence of farmers education participation in RDA developed irrigation and water development project was measured by the testing the following null hypothesis. There is no influence of education on farmer’s participation in RDA developed irrigation and water development project.”
The z-value of variable is 1.88 which is significant at 10%level of significance that means the null hypothesis is rejected. It indicates that the education has effects on farmer’s project participation.
The marginal effect indicates that 1-year additional schooling will increase the likelihood of participation by 2.7%. Farmers with a higher level of education may be aware of the negative effects of drought on crop productivity and the benefits of timely irrigation. Therefore, participated in the project.
4.3.2 Significant contribution of farm size on the farmers’ project participation
The following observations were made on the basis of the value of the concerned variable of the study under consideration.
The influence of farm size on the farmers project participation was measured by the testing the following null hypothesis; “There is no contribution of farm size to the farmers RDA developed irrigation and water development project participation.”
The z-value of independent variable farm size is 2.70 which is significant at 1% level of significance that means we will reject the null hypothesis. It indicates that farm size has a positive significant relationship with farmers RDA developed irrigation and water development project participation.
The findings indicate that 1 unit increase in farm size will increase the likelihood of participation by 25%. This could be because larger farms require more water to irrigate their cropland in a timely manner, and hence may be interested in participating in the project.
CHAPTER V
SUMMARY, CONCLUSIONS AND RECOMMENDATIONS
5.1 Summary
The northern region of Bangladesh experienced one of the most severe droughts that led to a shortfall of rice production of 3.5 million tons. It is not possible to avoid drought but drought preparedness can be developed and drought impacts can be managed. Rural Development Academy (RDA), Bogura (northern region) is a national level training and research institute of rural development established in 1974 under the Ministry of Local Government, Rural Development and Co-operatives.
Rural Development Academy (RDA), Bogra has successfully carried out experiments in the field of water resources management and development since 1982, especially, in respect of optimum utilization of scarce water resources and has developed several water development projects.
A total 100 farmers of the study areas were selected and interviewed to see the factors affecting the participation in RDA’s irrigation and water development project. Binary logistic regression used to analyze the data. In logit model, marginal effects tells us how a dependent variable (project participation) changes when a specific independent variable (Age, Education of respondent, Education of spouse, Family size, Farm size, Drought severity, Total income) changes.
For project participant’s farmers 7.8 percent belonged to the age group of 20-30 years, 61 percent belonged to the age group of 31-50 years and 31.2 percent fell into the age group of above 51 for project participation. Again, for project non-participants 73.9 percentages belonged to the group of 31-50 years and 26.1 percent fell into the age group of above 50 years old.
The level of educational scores of the farmers ranged from 0 to more than 12 with a mean and standard deviation for project participants is 2.93 and 0.69 respectively.
Again mean and standard deviation for non-participants is 2.56 and 0.58 respectively.
Respondent under secondary education category constitute the highest proportion (59.7 percent) for project participants.
For project participants 39 percent belonged to the group of small family, 57.1 percent belonged to the group of medium family and 3.9 percent fell into the group of large family. Again, for non-participants farmers, 43.5 percent belonged to the group of small family, 56.5 percent belonged to the group of medium family.
The farm sizes of the farmers ranged from 0.02 ha to 3.00 ha with a mean and standard deviation for project participants is 3.63 and 0.58, and for non- project participants the mean and standard deviation is 3.21 & 0.42 respectively. The findings of the study reveal that majority of the project participants and non- project participant were small to medium sized farm holder.
Access to credit facilities indicated that only around 14 percent of farmers got agricultural related credit and remaining 85.7 percent of farmer didn’t receive any kind of agricultural credit from any organization.
For project participants the major source of getting information was extension worker (61%), followed by NGO worker (15.6%). One the other hand for non- project participants, most of the farmers got information from NGO worker (29.1%) followed by extension worker (17.4%).
For project participants 5.2% farmers are below the extreme poverty line, which indicates that, their yearly income below Tk. 56000. Most of the farmer’s yearly income belonged to the category of Tk. 57000-250,000. On the other hand, for non- participants, about 24.4 percent of farmers were below the poverty line. The farmers who are under the project were in better position in terms of annual income than non- participants.
The findings also indicated that 1-year additional schooling will increase the likelihood of participation by 2.7%. Similarly, 1 unit increase in farm size will increase the likelihood of participation by 25%. This could be because larger farms require more water to irrigate their cropland in a timely manner, and hence may be interested in participating in the project.
5.2 Conclusions and recommendations
Findings indicated that most of the farmers are in middle aged group. Education level and income are higher for participants than non-participants. Participants also have bigger farm size compared to non-participants. Based on the findings following recommendations can be made:
Since farmers are participating in project, the area coverage of the project can be enhanced in other drought affected areas of the country.
Findings indicated that large farmers are more interested to participate; RDA authority should take necessary steps to bring all farmers under coverage.
Educating farmers can be quite beneficial. Awareness-raising programs, trainings, and field days can assist all farmers gain a better understanding of the project and hence participate in it, ensuring irrigation water supply and increasing output.
36
REFERENCES
Aung Tun Oo, Guido Van Huylenbroeck, and Stijn Speelman. (2017). Differential Impacts of an Irrigation Project : Case Study of the Swar Dam Project in Yedashe, Bago Region of Myanmar. Journal of Development and Agricultural Economics 9(7): 178–189.
Anwar Zahid, Kazi M. Ahmed, Richard G. Tayloret and Mohammad Shamsudduha.
(2011). The impact of intensive groundwater abstraction on recharge to a shallow regional aquifer system: evidence from Bangladesh. Hydrogeology Journal, 19:901–916
ADB, (2020). Project Performance Audit Report on the Northeast Minor Irrigation Project in Bangladesh (Loan 1125-BAN[SF]).
Afrin. R. (2017). Status of irrigation water facility and use of modern technology in selected study area. M.S. Thesis, Department of Agroforestry and Environmental Science, Sylhet Agricultural University, Sylhet-3100, Bangladesh
Al-Amin, Tasmiah Fatema Tanni, Dr.Md. Habibur Rahman, Miah Md. Asaduzzaman, Md. Abdullah Al Matin (2018). A Study on the Present Scenario of Solar Irrigation in Bangladesh. International Journal of Scientific & Engineering Research, 8:229-318
Ahmed Minhaz, Masaru Matsumoto and Kiyoshi Kurosawa (2018). Heavy Metal Contamination of Irrigation Water, Soil, and Vegetables and the Difference between Dry and Wet Seasons Near a Multi-Industry Zone in Bangladesh.
International Journal of Environmental Research 12: 531–542
Ali, M.K., S.A. Chowhdury, M.A. Kader and M.O. Gani (1986). Factors Influencing Adoption of Improved Rice Production Technologies Among the Growers.
Bangladesh Journal of Extension Education, 1(2): 25-31
Angel C, Asha S. (2015). A study on developing a smart environment in agricultural irrigation technique. International Journal Ambient Stys Appl. 3(2/3):11–7 BBS, (2021). Statistical Year Book of Bangladesh. Bangladesh Bureau of Statistics.
Statistics Division, Ministry of Planning, Government of the People's Republic of Bangladesh.
BBS, (2017). Statistical Year Book of Bangladesh, Bangladesh Bureau of Statistics.
Statistics Division, Ministry of Planning, Government of the People's Republic of Bangladesh.
BBS, (2018). Yearbook of agricultural statistics of Bangladesh. Dhaka: Bangladesh bureau of statistics, statistical division, Ministry of planning, Government of the People’s Republic of Bangladesh.
BBS, (2011). Bangladesh Beraue of Statistics. Bangladesh Population and Housing Census 2011: Zila Report:Bogra. Statistics and Informatics Division (SID), Ministry of Planning, Government of the People’s Republic of Bangladesh.
BBS, (2014). Statistical Year Book of Bangladesh. Bangladesh Bureau of Statistics.
Statistics Division, Ministry of Planning, Government of the People's Republic of Bangladesh.
Babul B Sarkar, Rahul Karmakar, (2021). A Prototype Modeling of Smart Irrigation System Using Event-B.
Chowdary VM, Rao NH , Sarma PBS (2003). GIS-based decision support system for groundwater assessment in large irrigation project areas. Agricultural Water Management, 67: 229-252
Carnel Maji. C. (1978). Intertemporal allocation of irrigation water in the Mayurakshi Project (India):An application of chance-constrained linear programming Water Resource.
Cramer, J.S. (2002). The Origins of Logistic Regression. Tinbergen Institute Working