A COMPARATIVE PROFITABILITY ANALYSIS BETWEEN AROMATIC AND AMAN RICE IN SOME SELECTED AREAS OF DINAJPUR DISTRICT
SYEDA ROWSHAN ARA MOSTOFA
DEPARTMENT OF AGRICULTURAL ECONOMICS SHER –E- BANGLA AGRICULTURAL UNIVERSITY
DHAKA 1207 DECEMBER, 2018
A COMPARATIVE PROFITABILITY ANALYSIS BETWEEN AROMATIC AND AMAN RICE IN SOME SELECTED AREAS OF DINAJPUR DISTRICT
BY
SYEDA ROWSHAN ARA MOSTOFA REGISTRATION NO.: 12-05180
A Thesis
Submitted to the Faculty of Agribusiness Management, Sher-e-Bangla Agricultural University, Dhaka,
in partial fulfillment of the requirements for the degree of
MASTER OF SCIENCE IN
AGRICULTURAL ECONOMICS SEMESTER: JULY-DECEMBER, 2018
Approved by:
Gazi M A Jalil Professor
Department of Agricultural Economics Sher-e-Bangla Agricultural University, Dhaka
Supervisor
Professor Dr. Jahangir Alam Khan Vice-Chancellor
University of Global Village Barishal, Bangladesh
Co-supervisor
Professor Gazi M A Jalil Chairman
Department of Agricultural University, Sher-e-Bangla Agricultural University, Dhaka
DEDICATED TO
MY BELOVED PARENTS
DEPARTMENT OF AGRICULTURAL ECONOMICS
Sher-e-Bangla Agricultural University Sher-e-Bangla Nagar, Dhaka-1207
CERTIFICATE
This is to certify that thesis entitled, "A COMPARATIVE PROFITABILITY ANALYSIS BETWEEN AMAN AND AROMATIC RICE IN SOME SELECTED AREAS OF DINAJPUR DISTRICT" submitted to the faculty of Agribusiness Management, Sher-e-Bangla Agricultural university, Dhaka, in partial fulfillment of the requirements for the degree of MASTER OF SCIENCE IN AGRICULTURAL ECONOMICS, embodies the result of a piece of bona fide research work carried out by Syeda Rowshan Ara Mostofa bearing Registration No. 12-05180 under my supervision and guidance. No part of this thesis has been submitted for any other degree.
I further certify that such help or source of information, as has been availed of during course of this investigation has duly been acknowledged.
Date:
Sher-e-Bangla Agricultural University Gazi M A Jalil
Dhaka-1207, Bangladesh Professor
Department of Agricultural Economics Sher-e-Bangla Agricultural University.
A COMPARATIVE PROFITABILITY ANALYSIS BETWEEN AROMATIC AND AMAN RICE IN SOME SELECTED AREAS OF DINAJPUR DISTRICT
ABSTRACT
This study was undertaken to determine the comparative profitability of Aman and Aromatic rice production. The objectives of the present study were to examine socio- demographic profile of Aman and Aromatic rice growers, to assess the profitability of producing Aman and Aromatic rice, to identify factors affecting the yield of Aman and Aromatic rice and to identify the problems faced by the farmers. A total of 60 farmers (30 for Aman rice growers and 30 for Aromatic rice growers) were selected randomly from two upazila namely Hakimpur and Ghoraghat in Dinajpur district. Both Tabular technique and statistical analysis was done to achieve the objectives of the study. The Cobb-Douglas production function was used in this study to determine the effects of different inputs on Aman and Aromatic rice production. The major findings of the study were that the cultivation of Aman and Aromatic rice was profitable from the view point of farmers. The gross returns per hectare for Aman and Aromatic rice were Tk.
109578.13 and Tk. 141222.04, respectively. The total cost of Aman production was Tk.
81697.99 and for Aromatic rice was Tk. 80796.12. Again the net returns of Aman and Aromatic rice were Tk. 27880.14 and Tk. 60425.92, respectively. The undiscounted Benefit Cost Ratio (BCR) was 1.34 and 1.74 for Aman and Aromatic rice production, respectively. The results indicated that Aromatic rice production was more profitable than Aman rice production. Production function analysis suggested that among the variables included in model namely: human labor, MoP, TSP and manure had a positive and significant effect on yield of Aman rice and human labor, gypsum, insecticides and pesticide had a positive and significant effect on the yield of Aromatic rice except for, urea had a negative and significant effect on the yield of Aromatic rice. The study also showed that farmers producing Aman and Aromatic rice faced some problems. It may be concluded that the farmers should be encouraged to grow more Aromatic rice than Aman rice as a means of increasing farm income in the area under study.
i
ACKNOWLEDGEMENT
At first, I would like to thank almighty Allah to whom every praises is due and to His prophet Mohammad (SM) for enabling me to complete my higher studies in Agricultural Economics and to complete the research work for the degree of Master of Science in Agricultural Economics.
I wish to express my deepest gratitude to my respected supervisor Gazi M. A. Jalil, Professor, Department of Agricultural Economics, Sher-e-Bangla Agricultural University, Dhaka-1207, for his valuable suggestions, constant encouragement and guidance throughout the whole research work. Without his involvement, this work would never have come to life.
I would like to express my gratitude to my honorable co-supervisor, Professor Dr.
Jahangir Alam Khan, Vice-Chancellor, University of Global Village, Barishal, Bangladesh, for his proper guidance and co-operation during the research work.
I feel proud to extend my deepest gratitude to all of my honorable teachers for their valuable advice and co-operations during the whole research work.
I would like to express my special thanks to all of my dear friends and classmates, especially to Arifa Akter for their support, love and understanding.
I would like to extend my gratitude to the farmers in the study area who participated during the period of data collection.
I have no words to thank my beloved parents for their never ending support and efforts to make my dreams of higher education fulfill. I also want to express special thanks to my husband for his admirable cooperation.
December, 2018
Syeda Rowshan Ara Mostofa
ii
CONTENTS
CHAPTER TITLE PAGE NO.
ABSTRACT i
ACKNOWLEDGEMENT ii
CONTENT iii-v
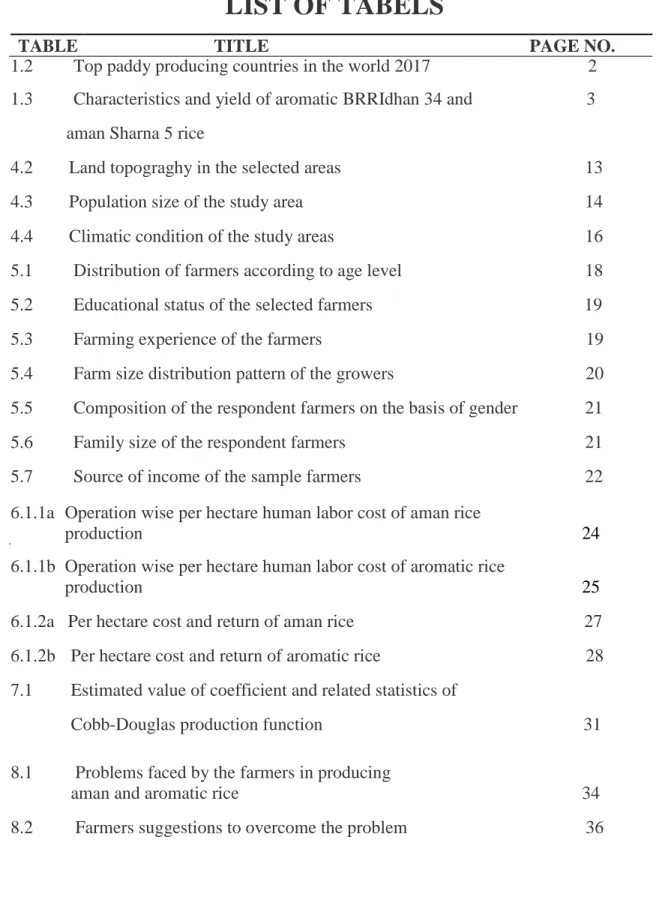
LIST OF TABLES vi
LIST OF FIGURES vii
ABBRIVEATIONS AND ACRONYMS viii
CHAPTER 1 INTRODUCTION 1-4
1.1 Background of the study 1
1.2 Importance of rice in the economy of Bangladesh 2 1.3 Characteristics and yield of Aromatic BRRIdhan-34
and Aman Sharna-5 rice varieties 3
1.4 Justification of the study 4
1.5 Objectives of the study 4
CHAPTER 2 REVIEW OF LITERATURE 5-7
CHAPTER 3 METHODOLOGY 8-12
3.1 Selection of the study area 8
3.2 Sampling technique 8
3.3 Preparation of the interview schedule 9
3.4 Period of the study 9
3.5 Methods of data collection 9
3.6 Analytical technique 9
3.7 Tabular analysis 9
3.8 Functional analysis 10
iii
CONTENTS
(Continued)CHAPTER TITLE PAGE NO.
3.9 Major cost items 11
CHAPTER 4 DESCRIPTION OF THE STUDY AREA 13-17
CHAPTER 5 SOCIO-DEMOGRAPHIC PROFILE OF FARMERS 18-21
5.1 Age 18
5.2 Educational status of the respondent’s household 18
5.3 Farming experience 19
5.4 Farm size 20
5.5 Family composition of the respondent farmers
on the basis of gender 20
5.6 Family size of the respondent farmers 21
5.7 Source of income of the respondent farmers 22
CHAPTER 6 COMPARATIVE PROFITABILITY ANALYSIS 23-28
6.1 Variable cost 23
6.2 Fixed cost 26
6.3 Total cost 26
6.4 Gross return 26
6.5 Gross margin 26
6.6 Net return 26
6.7 Undiscounted BCR 26
6.8 Comparative profitability between Aman and
Aromatic rice 26
iv
CONTENTS
(Continued)CHAPTER TITLE PAGE NO.
CHAPTER 7 FACTORS AFFECTING THE YIELD 29-32 7.1 Interpretation of the result of Aman rice 29 7.2 Interpretation of the result of Aromatic rice 30
CHAPTER 8 PROBLEMS FACED BY FARMERS 31-36
CHAPTER 9 SUMMARY, CONCLUSION AND
RECOMMANDATIONS
37-38
9.1 Summary and conclusion 37
9.2 Recommendations 38
REFERENCES 39-41
APPENDICES 42-49
v
LIST OF TABELS
TABLE TITLE PAGE NO.
1.2 Top paddy producing countries in the world 2017 2
1.3 Characteristics and yield of aromatic BRRIdhan 34 and 3 aman Sharna 5 rice
4.2 Land topograghy in the selected areas 13
4.3 Population size of the study area 14
4.4 Climatic condition of the study areas 16
5.1 Distribution of farmers according to age level 18 5.2 Educational status of the selected farmers 19
5.3 Farming experience of the farmers 19
5.4 Farm size distribution pattern of the growers 20 5.5 Composition of the respondent farmers on the basis of gender 21
5.6 Family size of the respondent farmers 21
5.7 Source of income of the sample farmers 22
6.1.1a Operation wise per hectare human labor cost of aman rice
production 24
6.1.1b Operation wise per hectare human labor cost of aromatic rice
production 25
6.1.2a Per hectare cost and return of aman rice 27 6.1.2b Per hectare cost and return of aromatic rice 28
7.1 Estimated value of coefficient and related statistics of
Cobb-Douglas production function 31
8.1 Problems faced by the farmers in producing
aman and aromatic rice 34
8.2 Farmers suggestions to overcome the problem 36
vi
LIST OF FIGURES
FIGURE TITLE PAGE NO.
4.1 Map of Dinajpur district 15
vii
ABBREVIATIONS AND ACRONYMS
BRRI Bangladesh Rice Research Institute BBS Bangladesh Bureau of Statistics BCR Benefit Cost Ratio
BER Bangladesh Economic Review DRC Domestic Resource Cost
et al. and others
FAO Food and Agricultural Organization
GR Gross Return
GDP Gross Domestic Product
Ha Hectare
HYV High Yielding Variety IOC Interest on Operating Capital
Kg Kilogram
MoP Muriate of Potash
Mt Metric Ton
NGO Non-Government Organization
T Ton
TC Total Cost
TFC Total Fixed Cost TSC Triple Super Phosphate TVP Total Variable Cost
viii
CHAPTER 1 INTRODUCTION
1.1 Background of the study
Bangladesh is an agrarian country. Because of its very fertile land and favorable weather, varieties of crop grow abundantly in this country. Agriculture sector contributes about 14 percent to the country`s Gross Domestic Product (GDP) and employs more than 40 percent of total labor force (BBS, 2018).
Rice is one of the major cultivated crops in Bangladesh. Rice covered around 74.85 percent cultivated areas under crop production in Bangladesh (BBS, 2017). For the year 2016-17, 27184 acres of land was covered by rice cultivation and 33804 metric tons of rice was produced. In 2015-16, 28124 acres of land was covered by rice cultivation and 34710 metric tons of rice was produced. Similarly, in 2014-15 and 2013-14, rice was cultivated in 114.15 lac hectares and 113.72 lac hectares, respectively and produced 347.1 lac metric tons and 343.56 lac metric tons of rice, respectively (BBS, 2017).
There are three types of rice produced in Bangladesh such as Aus, Aman and Boro.
Aman is the second largest rice crop in respect to the volume of production in Bangladesh. For the year 2016-17, total area and production of Aman rice were 13797 acres and 13656 metric tons, respectively. Total area and production of Aman were 13814 acres and 13484 metric tons, respectively for the year of 2015-16. For the year 2014-15, total area and production of Aman rice were 55.30 lac hectares and 131.90 lac metric tons respectively. Total area and production of Aman rice were 55.30 lac hectares and 130.23 lac metric tons, respectively for the year of 2013-14 (BBS, 2017).
Dinajpur is one of the leading districts of Aman and Aromatic rice production in Bangladesh. In Dinajpur district, total area under Aman rice production from the year of 2015-16 to 2013-14 were 629293 acres, 300796 acres and 195229 acres, respectively and total production were 636936 metric tons, 339766 metric tons and 166802 metric tons, respectively (BBS, 2017). Most of the Aromatic rice varieties are grown in Aman season and a few are grown in Boro season. The total area under Aromatic rice cultivation in
1
T. aman season was 12.5% and total production of 1.42 million metric tons (Tama et al., 2015). Production of Aromatic rice in Dinajpur district was gaining popularity with its high profit margin and low production cost. Total area under Aromatic rice cultivation in Dinajpur district was 90 thousand hectares (BBS, 2018).
1.2 Importance of rice in the economy of Bangladesh
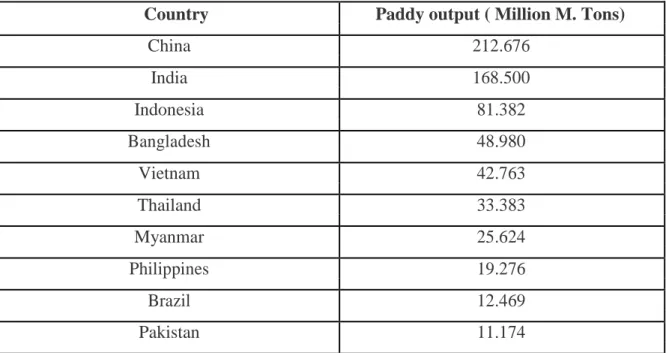
Rice is the major cereal crop and staple food in Bangladesh. Bangladesh is the fourth largest rice producer in the world following China, India and Indonesia (FAO, 2017).
Table 1.2: Top paddy producing countries in the world 2017
Country Paddy output ( Million M. Tons)
China 212.676
India 168.500
Indonesia 81.382
Bangladesh 48.980
Vietnam 42.763
Thailand 33.383
Myanmar 25.624
Philippines 19.276
Brazil 12.469
Pakistan 11.174
Source: FAO, 2017
About 135 million people of Bangladesh have been taking rice as food. It provides nearly 48% of rural employment, about two-third of total calorie supply and about one-half of the total protein intake of an average person in the country (BER, 2018). Rice covered 74.85 % of total cropped area in Bangladesh (BBS, 2018). Aman is one of the main crops in Bangladesh. The rice which is harvested in the month of November and December is said to be Aman rice. At present it is the second largest crop in the country in respect of the volume of production (BBS, 2018). In rice, aroma or scent is an inherent characteristic. Aromatic rice attracts premium prices because it is highly valued by consumers, who use it for special purposes like feast and religious occasions, like Eid,
2
Puja, wedding ceremony, and so on. Most of the Aromatic rice varieties are low yielding but its higher price and low cost of production generate higher profit margins (Biswas et al., 2016).
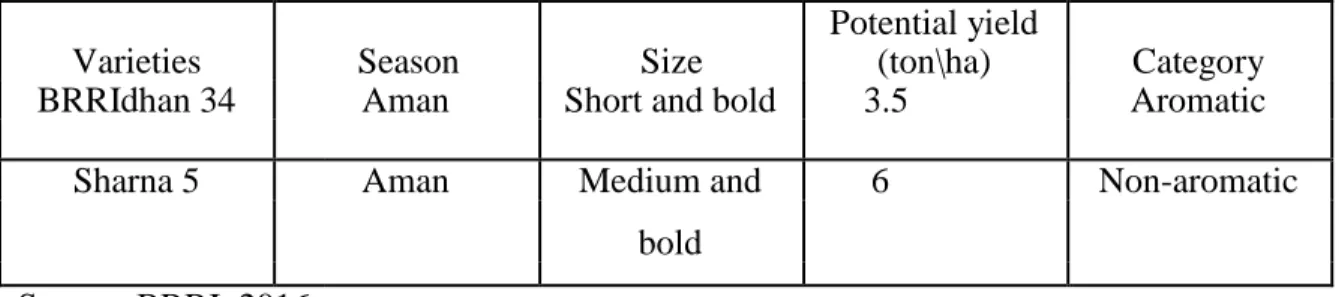
1.3 Characteristics and yield of Aromatic BRRI dhan-34 and Aman Sharna-5 rice varieties
Aromatic rice containing aroma and it is short bold and its plant is long in height and it has also low tillering habit. Non-aromatic rice grain size is medium bold, short in height.
Its plant is nitrogen responsive and it has also high tillering habit. It does not contain aroma. Aromatic and Non-aromatic fine rice are those varieties of rice which are short in size and their shapes are bold and round.
BRRIdhan-34 is an aromatic rice variety. It was developed by Bangladesh Rice Research Institute (BRRI) in 1997. It was originated from khaskani. Its plant height is 117 cm. It produced approximately double yield than other local variety, that’s why this is the popular Aromatic variety to farmers. Sharna-5 is a non aromatic aman rice variety. It is an Indian variety. Bangladesh Rice Research Institute (BRRI) developed BRRIdhan 93, BRRIdhan 94 and BRRIdhan 95 from sharna-5 variety. Because of its high yield, low price and availability makes it popular among farmers. Characteristics and yield of aromatic BARRIdhan-34 and Aman sharna-5 rice varieties are given below.
Table 1.3: Characteristics and yield of Aromatic BRRIdhan-34 and Aman Sharna-5 rice varieties
Varieties Season Size
Potential yield
(ton\ha) Category
BRRIdhan 34 Aman Short and bold 3.5 Aromatic
Sharna 5 Aman Medium and 6 Non-aromatic
bold Source: BRRI, 2016.
3
1.4 Justification of the study
Agriculture of the Bangladesh is rice base. Aman is one of the main crops in Bangladesh. But Aromatic rice has high demand in both home and abroad, especially in festive and special events, such as wedding, eid, puja etc.
The present study will help to find the existing problems and develop a clear understanding on the interrelated aspects of Aman and Aromatic rice cultivation and choice making of the profitable one. The present study will help in providing a picture of the benefits and costs of these two initiatives, which will help individual researchers who will conduct further studies of the similar nature and encourage in conducting more comprehensive and detailed investigation in this particular field of the study. The study may be helpful to learn about various problems related to Aromatic and Aman rice production and to suggest the farmers how to overcome those problems.
However, only a few field level studies conducted in Bangladesh to determine the comparative profitability between Aman and Aromatic rice production. Finally, as far my knowledge, no such kind of study was conducted in the past on the selected areas on the selected topic. So, such kind of study was necessary to help the policy makers for formulating appropriate policy.
1.5 Objectives of the study
The specific objectives of this study are as follows to:
1. To assess the present socio-demographic characteristics of Aman and Aromatic rice growing farmers
2. To estimate and compare the profitability of producing Aman and Aromatic rice 3. To identify the factors affecting the yield of producing Aman and Aromatic rice 4. To identify the problems faced by the farmers producing Aman and Aromatic rice
4
CHAPTER 2
REVIEW OF LITERATURE
The purpose of this chapter is to provide a selective review of the past research work which are relevant to the present study. Comparative profitability analysis of Aman and Aromatic rice is hardly ever found in this country. Such types of research did not take place in the research area. This study will help in providing a picture of benefits and costs of these two initiatives, which will help individual researchers who will conduct further study of the similar nature and encourage in conducting more comprehensive and detailed investigation in this particular field. However, some relevant studies which are directly or indirectly related to this study are described below:
Tama et al. (2018) conducted an experiment to assess the export potential of Aromatic rice in Bangladesh as well as identify the factors affecting gross return from Aromatic rice production. The study suggested that the price of fertilizer, seeds and others inputs should be maintained and marketing and trade related costs and barriers should be minimized to amplify the potential of Aromatic rice production in Bangladesh.
Rashid et al. (2017) conducted a study to evaluate the yield performance of seven Aromatic rice varieties of Bangladesh viz. Jirakatari, Chiniatab, Chinigura, Kataribhog, Kalizara, Badsgabhog and BRRIdhan 34. It was observed that the highest grain yield (2.54 t/ha) was obtained from kataribhog and the lowest grain yield (1.83 t\ha) was obtained from kalizara. Among the seven Aromatic rice varieties under North West condition kataribhog and BARRIdhan 34 were suitable in respect of yield.
Tama et al. (2015) examined the financial profitability of Aromatic rice production. In this study it was evident that Aromatic rice is a profitable farming venture, because such rice cultivation did not generally require additional expenditure on fertilizer, pesticides and irrigation and gross return from this cultivation was much higher as the product price was higher than any other rice varieties.
5
Islam et al. (2013) examined the performance of local Aromatic rice cultivars viz.
Kalijira, Khaskani, Kachra, Raniselute, Morichsail and Badshabhog. The rice cultivars varied considerably in terms of crop growth characteristics as well as yield and yield contributing characters. It was proven that the variety Morichsail produced the highest grain yield and the lowest grain yield was obtained from Kalijira.
Nasrin (2013) conducted a study to examine the financial profitability of Aromatic rice and its impact on farmer livelihood in selected areas of Tangail district. The study revealed that the total cost if Aromatic rice production was Tk. 51299.5 per hectare. The average per hectare gross return of Aromatic rice was Tk. 82666.4. The undiscounted benefit-cost ratio of Aromatic rice production was 1.61 which implies that the Aromatic rice production was profitable. Moreover, the study revealed that the Aromatic rice producer had higher income and better livelihood than those who are producing Non- aromatic rice in the study area.
Ashrafuzzaman et al. (2009) examined the growth performance and grain quality of six Aromatic rice varieties BR34, BR38, Kalizira, Chiniatop, Kataribhog and Basmati grown under rainfed conditions. The rice varieties differed significantly with respect to leaf chlorophyll content, plant height, internode length, thousand grain weight and grain and straw yields. Thousand grain weight and grain yield both was highest in BR38. Basmati required shorter days to maturity and Kalizira required longest days to maturity.
Ullah (2008) was conducted a study to estimate the comparative profitability and technical efficiency of Aromatic BRRIdhan 34 and Non-aromatic BR 11 rice varities of Transplanted aman rice in some selected areas of Dinajpur district. Researcher observed that the yield of BRRIdhan 34 rice found lower compared to that of BR11 rice. Gross
6
returns from BRRIdhan 34 was much higher (Tk. 82467/ha) than that of BR11 rice (Tk.
66455/ha). Gross margin was found higher for BRRIdhan 34 (Tk. 58869/ha) than by BR 11 rice (Tk. 39013/ha). Return over per taka investment (BCR) were 1.87 and 1.37 for BRRIdhan 34 and BR 11 rice, respectively implying that BRRIdhan 34 rice cultivation was more profitable than BR 11 rice cultivation.
Razzaque and Rafiquzzamzn (2007) attempted to measure a comparative analysis of T.aman rice cultivation under different management practice in coastal area. They were found that farmers were found to obtain lower level of yield potentials following poor management practice as a result yield was not satisfactory. They suggested that if farmers would use recommended package like closer spacing, lower number of seedling per hill, use of balance fertilizer, pest control in proper time then they would be able to get optimum yield.
Anik (2003) examined that aromatic rice production is more profitable than fine rice. The study identified some constraints such as high domestic cost of production and higher marketing and trade related costs and barriers which need to be reduced for improving the production environment of Aromatic and fine rice.
Domestic Resource Cost (DRC) ratios showed that Bangladesh had comparative advantage in the production of aromatic and fine rice both from the point of view of export and import substitution, except the nizershail variety which was marginally unprofitable under export proposition. The study also identified some problems faced by the farmers in producing aromatic and fine rice. Finally, some policy guidelines were suggested.
Kabir (2000) conducted a study on an economic analysis of Aromatic and Non-aromatic rice cultivation in some selected areas of Dinajpur district. The result of the study state that Aromatic rice is more profitable than Non-aromatic rice. In the study gross return were found to be TK. 37466.88, TK. 32291.63,TK. 29881.00 and TK. 30860.97 per hectare for kataribhog, kalijira, Sharna and panjam\BR varieties, respectively. Gross return from Aromatic (kataribhog) rice was highest (TK. 37466.88\ha) followed by Non- aromatic (pajam\BR varieties) rice (TK. 30860.97\ha).
7
CHAPTER 3 METHODOLOGY
This chapter deals with the tools & techniques used for collecting the necessary information of this study. It also addresses the methodology through which the collected data were categorized and analyzed in order to achieve the objectives of the study. The design of research involved in the present study has been described in this chapter.
3.1 Selection of the study area: The area where the selected varieties of the rice have been grown successfully was considered as the study area. The Dinajpur district was selected because it is one of the leading district of Aromatic and Aman rice producing area in Bangladesh. The following considerations were kept on mind for selecting Dinajpur as a study area.
1. There were a large number of Aromatic and Aman rice producers in that particular area.
2. Researcher had an easy access in this area.
3. The locality has easy accessibility and communication facilities.
4. It is less prone to natural calamities.
5. As per my knowledge, no related study was conducted in the past.
3.2 Sampling technique: It was not possible to include all the farmers in the area studied due to limitation of time, money and personnel. A simple random sampling technique was followed in the present study for minimizing cost, time and to achieve the ultimate objectives of the study. Two Upazila namely Hakimpur and Ghoraghat in Dinajpur district were selected. Two lists of farmers, who cultivated Aromatic and Aman rice, were collected with the help of agricultural extension personnel and elderly farmers of the study area. A total number of 60 farmers, 30 (7 from krishnapur moricha, 8 from shalgram, 7 from nikharia and 8 from pathanpara farmers) for Aromatic and 30(8 from krishnapur moricha, 7 from shalgram, 8 from nikharia and 7 from pathanpara farmers) farmers for Aman rice, were randomly selected from the lists. Thus the selected farmers were interviewed to achieve the ultimate objectives of the study.
8
3.3 Preparation of the interview schedule: To achieve the objectives of the study, a preliminary interview schedule was designed for recording data to be obtained from the selected farmers. After preparing a draft interview schedules it was pretested. On the basis of pretest, its consistency and applicability in actual field condition was checked.
The necessary adjustments were made and a final survey schedule was developed.
3.4 Period of the study: The data was collected though survey during the months of January to February 2019 by several visits by the researcher herself.
3.5 Methods of data collection: The data were collected by interviewing the selected respondents. As farmers did not keep any written records of their farm activities, it was difficult to collect accurate data. To overcome this problem, farmers were requested to provide correct information so far as they could remember. Before taking interview the aims and objectives of the study were explained to the farmers so that they could understand that the study was purely academic one and was not likely to have an adverse effect.
3.6 Analytical technique: The collected data were analyzed with the purpose of achieving the objectives of the study. The following two technique of analysis were used:
1. Tabular analysis 2. Functional analysis
3.7 Tabular analysis: Arithmetic mean percentage was used to measure different cost, gross margins and net profit were calculated in the tabular form. Interpretation discussions of the findings were discussed in simple terms. Undiscounted Benefit Cost Ratio (BCR) was also calculated by using different costs.
3.7.1 Gross return: Per hectare gross return was calculated by multiplying the total amount of product and by product by their respective per unit prices.
Gross Return = Quantity of the product*Average price of the product + value of by- product.
9
3.7.2 Gross margin: Gross Margin is the difference between gross return and variable costs. Such as,
Gross Margin = Gross Return – Variable cost.
3.7.3 Net return: Per hectare net return was determined by subtracting per hectare total cost (variable cost and fixed cost) of production from per hectare total return.
Net return = Total Return- Total Cost (total variable cost + total fixed cost)
3.8 Functional analysis: Besides tabular analysis, Cobb-Douglas production function was used to estimate the effects of key variables. This model was proved the best-fit and more reliable on theoretical and econometric aspects in real world situation.
For Aromatic rice and Aman rice the model specification was as follows:
Yi = α X1iβ1
X2iβ2
X3iβ3
X4iβ4
X5iβ5
X6iβ6
X7iβ7
X8iβ8
e ui………..(i)
By taking log in both sides the Cobb-Douglas production function was transformed into the following logarithmic form:
ln Yi = ln α +β1 ln X1i + β2 ln X2i + β3 ln X3i + β4 ln X4i + β5 lnX5i + β6 lnX6i + β7 X7i + β8X8i + ui ………(ii)
Where, Y = Yield (Kg/ha)
α = Constant or intercept of the function
X1 =Amount of seed (Kg /ha) X2 = Human labor cost (Tk. /ha) X3 = Amount of urea (Kg/ha) X4= Amount of MoP (Kg/ha) X5 = Amount of TSP (Kg/ha) X6= Amount of gypsum (Kg/ha)
X7= Cost of insecticide and pesticide (Tk. /ha)
10
X8= Cost of manure (Tk. /ha) ln = Natural logarithm
i = 1,2, 3………, n(n=30) e = Base of natural logarithm
ui = Error term
β1, β2…... β8 = Coefficient of respective variables.
3.9 Major cost items: A list of cost items and their estimation procedure has been discussed under the following heads:
(a) Seed cost
(b) Human labor cost (c) Fertilizer cost (d) Manures cost (e) Irrigation cost
(f) Insecticides and pesticides cost (g) Interest on operating capital and (h) Land use cost
3.9.1 Seed cost: In the study area, both the home supplied and purchased seed were used.
Most of the farmers used purchased seed than home supplied seed. The cost of home supplied seeds was charged at the average market price and the cost of purchased seed was calculated according to the payment made by farmers.
3.9.2 Human labor cost: Human labor was one of the major important inputs used in the production process of both Aman and Aromatic rice. It was classified into two categories;
(1) own labor and (2) hired labor. The cost of own labor was estimated at the prevailing wage paid in cash to hired labor. The existing wage rate was considered for computing the cost of hired labor.
11
3.9.3 Fertilizer cost: In the study area, farmers generally used Urea, Triple Super Phosphate (TSP), Murate of Potash (MoP), Gypsum and Zinc for higher yield of Aman and Aromatic rice. Fertilizer cost represents the actual cost paid by the farmers.
3.9.4 Manure cost: In the study area, cow-dung was mostly used as manure. Cost of manure was estimated by the actual amount paid by the farmers.
3.9.5 Irrigation cost: In the study area, only a small number of farmers used irrigation for the production of Aman and Aromatic rice. Irrigation cost was estimated by the actual payment made by the farmers.
3.9.6 Insecticides and pesticides cost: In the study area, farmers used different insecticides and pesticides for the better production of Aman and Aromatic rice. The cost of insecticides and pesticides represented the amount of money, which the farmers actually paid to buy the items.
3.9.7 Interest on operating capital: Interest on operating capital was charged at the rate of 6 percent per annum and was estimated for the duration of six months for Aman and Aromatic rice production. It was estimated by using the following formula:
Interest on operating capital = AIit Where, AI= (Total investment)/2 i = Rate of interest
t = Total time period of a cycle
The period of crop cultivation was considered from the time of land preparation to harvest.
3.9.8 Land use cost: Land use cost varied from village to village depending upon the soil type, topography, location and security of the particular crop field. Land use cost may be calculated using one of the following concepts:
a) Interest on the value of land, b) Rental value of land and c) Forgoing income from the best alternative use.
The second method is the most popular. So, it was used in the present study.
12
CHAPTER 4
DESCRIPTION OF THE STUDY AREA
A short description of the study area has been presented in this chapter to know the overall features of the study area.
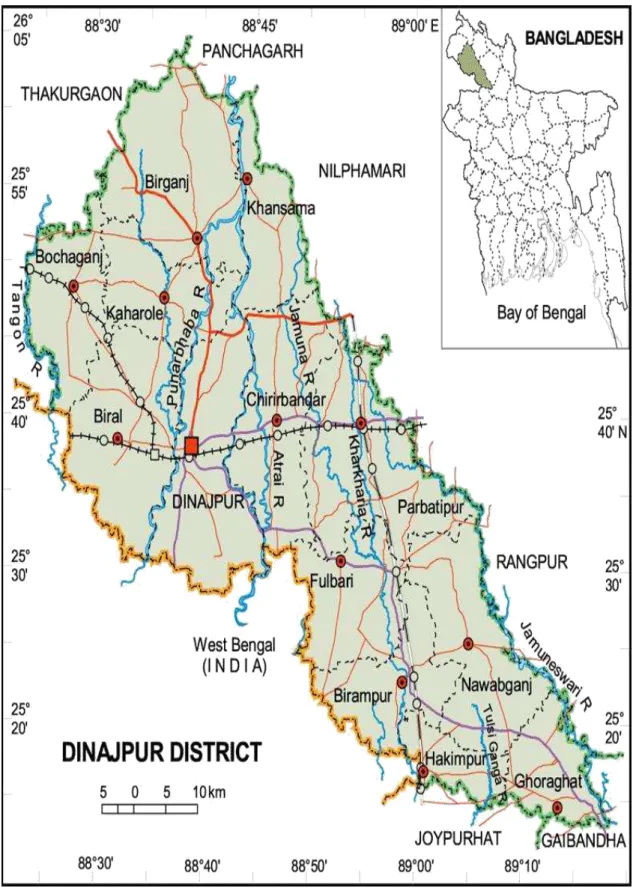
4.1 Location: In this study, sample farmers were selected from four villages namely krisnapur moricha, shalgram belonging to Ghoraghat upazila and nikharia and pathanpara belonging to the Hakimpur upazila of Dinajpur district. This two upazila are 17.4 km away from each other. Hakimpur upazila is located from 71.1 km away from Dinajpur and Ghoraghat upazila is located from 84.1 km away from dinajpur district. The location of the two upazilas of ghoraghat and hakimpur are shown in the figure of 4.1.
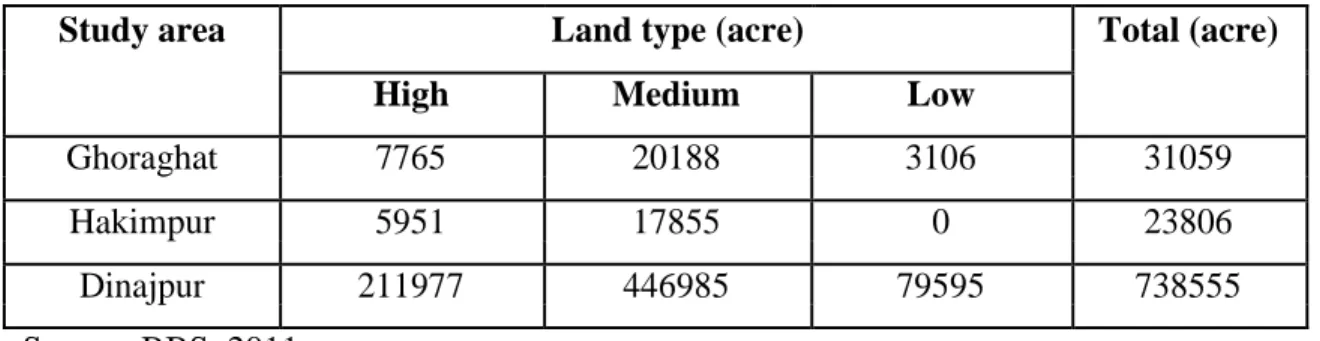
4.2 Topography and condition of the soil: Dinajpur is a district of Rangpur division. It is the largest district among all sixteen northern districst of Bangladesh. Dinajpur lies on the punarbhava river at the northeast part of the border of Sikkim state in India. Dinajpur is located on the point where flat alluvial plain intersected by rivers and broken by the slightly elevated barind region. Fertility level of soil is low to medium and organic matter content is low to medium in the soil of Dinajpur district. Amount of medium land is high in both ghoraghat and hakimpur upazila. Amount of doash kind of soil is high in both ghoraghat and hakimpur upazila, about 14312 acre and 14816 acre, respectively.
However, both upazila has different kind of soil such as bele, etel and kanker etc (BBS, 2011). The soil of the study area is very fertile and suitable for different crops cultivation.
Table 4.2 Land topography in study areas
Study area Land type (acre) Total (acre)
High Medium Low
Ghoraghat 7765 20188 3106 31059
Hakimpur 5951 17855 0 23806
Dinajpur 211977 446985 79595 738555
Source: BBS, 2011.
13
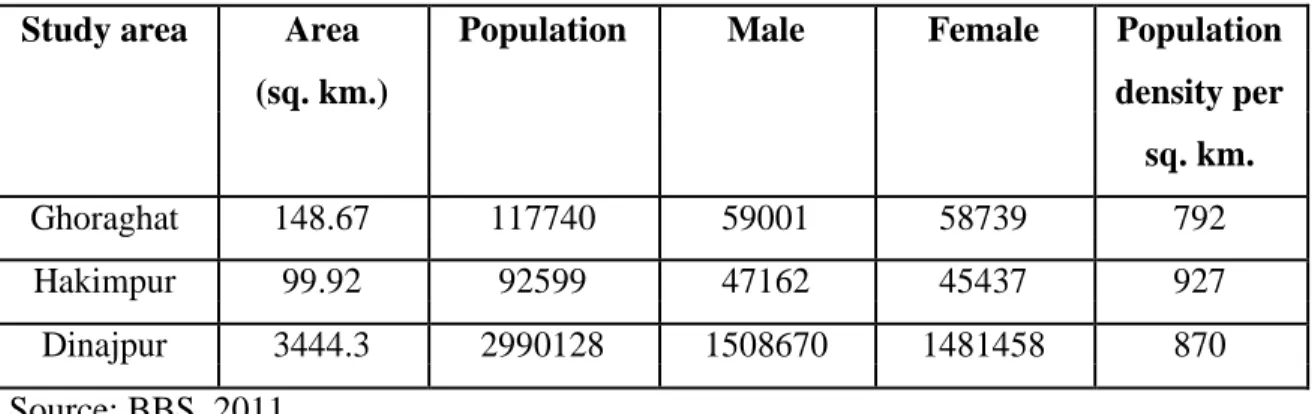
4.3 Population and area of the study area: Total area of Dinajpur district is 3444.3 sq.
km. According to the population census 2011, per sq. population density is 870 in Dinajpur district. In Hakimpur and Ghoraghat upazila per sq. population density is 927 and 792, respectively. However, total population of Dinajpur district is 2990128 among which number of male is 1508670 and number of female is 1481458.
Table 4.3 Population size of the study areas
Study area Area Population Male Female Population
(sq. km.) density per
sq. km.
Ghoraghat 148.67 117740 59001 58739 792
Hakimpur 99.92 92599 47162 45437 927
Dinajpur 3444.3 2990128 1508670 1481458 870
Source: BBS, 2011.
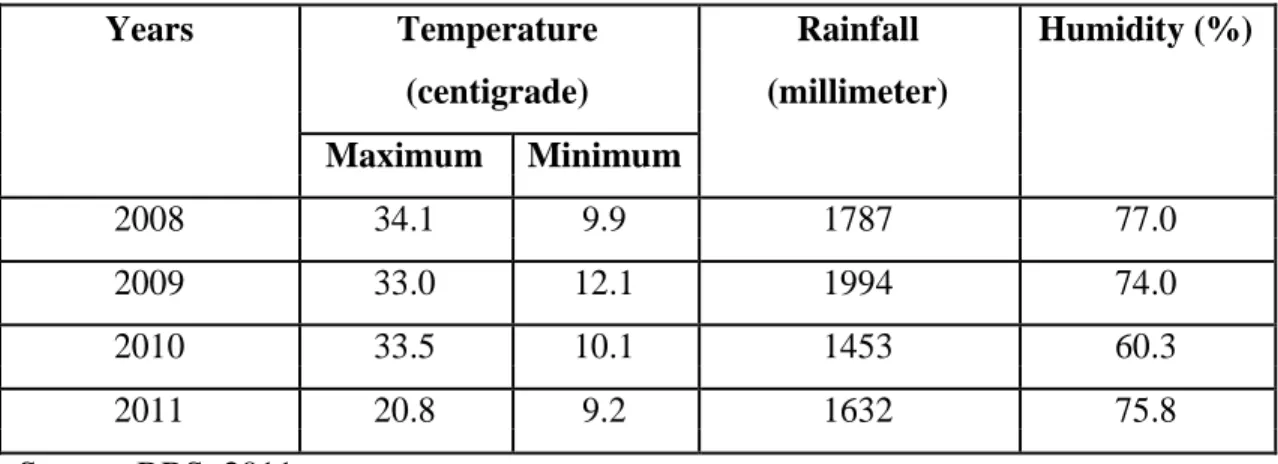
4.4 Climate conditions of the study area: Tropical hot, wet and humid climatic condition has seen in Dinajpur district. Annual average temperature and precipitation is 250C and 1795.6 mm, respectively. Climate of Ghoraghat upazila is tropical and summer has a good deal of rainfall than the winter. Average temperature of Ghoraghat upazila is 28.90C. Annually precipitation falls about 1902 mm. Most of the precipitation falls in july averaging 408 mm which is very helpful for aman and aromatic rice cultivation.
Climate of Hakimpur upazila is warm and temperate. Average temperature and rainfall in Hakimpur upazila is about 25.20C and 182 mm, respectively.
14
Figure 4.1: Map of Dinajpur district.
15
Table 4.4 Climatic condition of the study area
Years Temperature Rainfall Humidity (%)
(centigrade) (millimeter) Maximum Minimum
2008 34.1 9.9 1787 77.0
2009 33.0 12.1 1994 74.0
2010 33.5 10.1 1453 60.3
2011 20.8 9.2 1632 75.8
Source: BBS, 2011.
4.5 Economic and agricultural conditions of the study area: Economy of the Dinajpur district mainly depends on agriculture. There is a well known proverb about Dinajpur - 'paddy piled up high, sheds full of cows, ponds brimming with fish'. Dinajpur is famous for the production of 'Katarivog' and lychee. A large number of people of Dinajpur district depends upon agri based products. Dinajpur is also rich in natural resources like coal. Rice processing mill is the main industry in Dinajpur. Different types of crops grown in this district such as rice, wheat, maize, potato, brinjal and tomato. Different types of fruits are also grown such as lychees, mangoes, bananas and jackfruits (BBS, 2011).
4.6 Educational structure of the study area: Average literacy rate in Dinajpur district is 45.7%. Literacy rate of male and female is 51% and 40%, respectively. This district contains 1 university, 118 colleges, 617 secondary schools, 1713 primary schools, 29 NGO schools and 351 madrashas. Average literacy rate in Ghoraghat upazila is 26.1%.
Literacy rate of male and female is 32.8% and 19.2%, respectively. This upazila contains 8 colleges, 18 secondary schools, 53 primary schools, and 34 madrashas. Average literacy rate in Hakimpur upazila is 47.2%. Literacy rate of male and female is 52.5% and 41.6%, respectively. It has 5 colleges, 1 textile institute, 38 secondary schools, 162 primary schools and 28 madrashas (BBS, 2011).
16
4.6 Transport system and communication: Transport and communication system of a country is an important infrastructure for the development of the economy as well as agriculture by providing the marketing facilities. Study areas are communicated with pucca road, semi pacca road. Anyone can reach the study area by van, by cycle, motor cycle and also by car. Products are mainly carried by van. Some local bazaar and big hats are located around the study area. Hats are organized twice a week on different days.
Farmers can sell their product directly to those markets and hats.
17
CHAPTER 5
SOCIO-DEMOGRAPHIC PROFILE
The general socio-demographic characteristics of the sample farmers such as their age, educational level, farming experience, family size, farm size, agricultural informational source, income from agriculture and non- agriculture sector are discussed here.
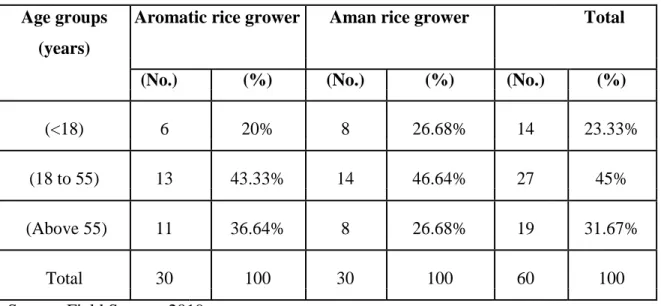
5.1 Age: The selected BRRIdhan-34 and Sharna-5 rice growers of the study area were categorize into 3 groups and presented in Table 5.1.
Table 5.1 Distribution of farmers according to age level
Age groups Aromatic rice grower Aman rice grower Total (years)
(No.) (%) (No.) (%) (No.) (%)
(<18) 6 20% 8 26.68% 14 23.33%
(18 to 55) 13 43.33% 14 46.64% 27 45%
(Above 55) 11 36.64% 8 26.68% 19 31.67%
Total 30 100 30 100 60 100
Source: Field Survey, 2019.
From Table 5.1 we can see that highest number of farmers both Aman and Aromatic rice belongs to the age group of (18 to 55). In this group, around 45% of total sample farmers belong.
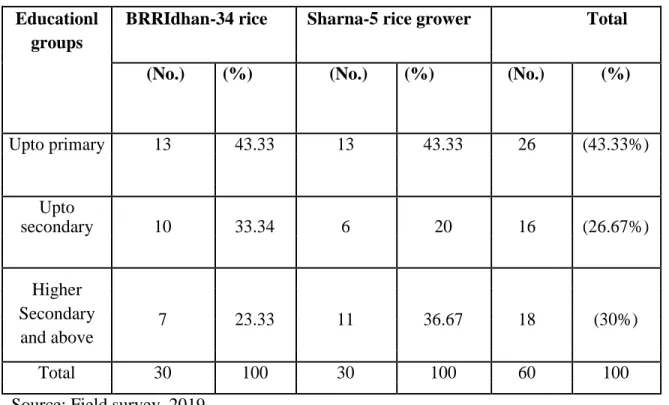
5.2 Educational status of the farmers: Educational status was categorized into three groups such as primary, secondary and higher secondary and above which are presented in table 5.2. From the table 5.2 we can see that highest number of farmers belong to the primary groups that is 26 (43.33%). And 26.66% farmers belong to the secondary educational group and rest 30% farmers belong to the higher secondary and above group.
18
Table 5.2 Educational status of the selected farmers
Educationl BRRIdhan-34 rice Sharna-5 rice grower Total groups
(No.) (%) (No.) (%) (No.) (%)
Upto primary 13 43.33 13 43.33 26 (43.33%)
Upto
secondary 10 33.34 6 20 16 (26.67%)
Higher Secondary and above
7 23.33 11 36.67 18 (30%)
Total 30 100 30 100 60 100
Source: Field survey, 2019.
5.3 Farming experience: The selected farmers of the study area were categorized into three groups according to their farming experience. They were low level of farming experience (up to 10 years), medium level of experience (11 to 20 years) and higher level of experience (above 20 years).
Table 5.3 Farming experience of the farmers
Farming BRRIdhan 34 rice Sharna 5 rice growers Total experience growers
(No.) (%) (No.) (%) (No.) (%)
Up to 10 2 6.67 4 13.33 6 10
years
11 -20 12 40 11 36.67 23 38.33
years
Above 20 16 53.33 15 50 31 51.67
years
Total 30 100 30 100 60 100
Source: Field survey, 2019.
19
From Table 5.3 we can see that highest number of farmers belong to the group of higher level of experience. About 51.67 % selected farmers belong to the group of higher level of farming experience and 38.33% farmers belong to the group of medium level of farming experience and finally only 10% farmers belong to the low level of farming experience.
5.4 Farm size
Based on own operated land holdings farmers were classified into three categories (BBS, 2008). These categories were:
1. Small (having 0.02 -1.0 hectare of own operated land) 2. Medium (having 1.01-3.0 hectare of own operated land) 3. Large (having above 3.0 hectare of own operated land) Table 5.4 Farm size distribution pattern of the growers
Farm BRRIdhan34 rice Sharna 5 rice Total
categories grower grower
(No.) (%) (No.) (%) (No.) (%)
Small 11 36.67 11 36.67 22 36.67
Medium 10 33.33 10 33.33 20 33.33
Large 9 30 9 30 18 30
Total 30 100 30 100 60 100
Source: Field survey, 2019.
From the table 5.4 we can see that the highest number of farmers belong to the group of small farm category that is 36.67%. 33.33% farmers belong to the group of medium farm category. 30% farmers belong to the group of large farm categories.
5.5 Family composition of the respondent farmers on the basis of gender
In this study, the family size was defined as the total number of persons living together and taking meals from the same kitchen under the administration of a single head of the
20
Table 5.5 Family composition of the respondent farmers on the basis of gender
Family BRRIdhan 34 rice grower Sharna 5 Total
composition rice grower
(number) (%) (number) (%) (number) (%)
Male 89 59.33 75 53.57 164 56.55
Female 61 40.67 65 46.43 126 43.45
Total 150 100 140 100 290 100
Source: Field survey, 2019.
5.6 Family size of the respondent farmers: The selected farmers of the study area were categorized into three groups. There are small (2-4), medium (5-6), large (above 6) based on their number of family member. It was examined that 28.33% respondent farmers belong to small family, 55% farmers belong to medium family and 16.66% farmers belong to large family. Average family size of the respondent farmers was 4.84 which was greater than national average family size 4.06. (BBS, 2016)
Table 5.6 Family size of the respondent farmers
Family BRRIdhan 34 rice Sharna 5 Total
size grower rice grower
(number) (%) (number) (%) (number) (%)
Small (2-4) 8 26.66 9 30 17 28.33
Medium (5-6) 16 53.33 17 56.66 33 55
Large (above 6) 6 20 4 13.33 10 16.66
Source: Field survey, 2019.
21
5.7 Source of income of the sample farmers
Agriculture was the main source of income of the people in the selected area. It was evident that 78.33% of the total respondents were involved in agriculture for their main income among which all people involved in crop cultivation, 51.06% involved in livestock and 10.63% involved in fisheries. 21.67% farmers involved in non-agriculture sector for their income among which 11.67% involved in business and 10% involved in service. Source of income of the farmers presented in table 5.6:
Table 5.7 Source of income of the sample farmers
Occupation
Aromatic rice
grower Aman rice grower Total
(No.) (%) (No.) (%) (No.) (%)
Agriculture 22 73.33 25 83.33 47 78.33
Crop 22 16.67 25 6.67 47 100
Livestock 13 59.09 11 44 24 51.06
Fisheries 2 9.09 3 12 5 10.63
Non agriculture 8 26.67 5 16.67 13 21.67
Business 5 16.67 2 6.67 7 11.67
Service 3 10 3 10 6 10
Source: Field survey, 2019.
22
CHAPTER 6
COMPARATIVE PROFITABILITY ANALYSIS
The costs, returns and profitability of Aman and Aromatic rice production are presented in this sector. For calculating the costs and returns of Aman and Aromatic rice production, the costs items were classified into two groups:
1. Variable cost and 2. Fixed cost
Variable cost included the cost of seed, human labor, fertilizer, manure, irrigation and insecticide and pesticide. Fixed cost was calculated for land use cost and interest on operating capital. In this chapter, gross margin, gross return, net return and Undiscounted Benefit Cost Ratio (BCR) were determined.
6.1 Variable cost
6.1.1 Cost of human labor:
Human labor was the most important and extensively used input for producing Aman and Aromatic rice. It shared a large portion of total cost of Aman and Aromatic rice production. It can be seen from the table 6.1.1a that the amount of human labor used for Aman rice production was 141 man-days per hectare. While this was 140 man-days per hectare for Aromatic rice cultivation (Table: 6.1.1b). Total cost of human labor for Aman rice cultivation was estimated Tk. 42300/ha and for Aromatic rice cultivation the cost was Tk. 42000/ha.
From the table it was found that the highest percentage of human labor was invested for harvesting and carrying for both Aman and Aromatic rice cultivation.
6.1.2 Cost of seed: Cost of seed of Aman and Aromatic rice depends on the quality and quantity of the seeds. It can be seen from the table 6.1.2a that per hectare ues of Aman seed was 30.97 kg and average cost of Aman seed per hectare was estimated Tk. 748.87.
Per hectare use of Aromatic rice was 11.15 kg and average cost of Aromatic rice seed per hectare was estimated Tk. 1066 (Table 6.1.2b). It was clear that cost of seed of Aromatic rice was relatively higher than that of Aman rice.
23
Table 6.1.1a Operation wise per hectare human labor cost of Aman rice production
Operations Total labor Total cost(Tk. /ha) Percentage of
(man/days) total cost
Seedbed preparation 8 2400 5.68
Mainland 19 5700 13.48
preparation
Uprooting & 20 6000 14.19
transplanting
Manure and fertilize 8 2400 5.68
Weeding 10 3000 7.09
Irrigation 1 300 0.70
Pest management 9 2700 6.38
Harvesting and 56 16800 39.71
carrying
Threshing and 10 3000 7.09
storing
Total 141 42300 100
Source: Field survey, 2019
6.1.3 Cost of fertilizer: Commonly used fertilizers were Urea, TSP, MOP, Gypsum and ZnSO4. It can be seen from the table 6.1.2a that the per hectare use of urea, TSP, MOP, Gypsum and ZnSO4 for Aman rice production were 148.3 kg, 140.23 kg, 106.5 kg, 35.84 kg, 1.76 kg and whose costs were estimated at Tk. 2427.7, Tk. 3354.5, Tk. 1604.5, Tk.
711.37and Tk. 176, respectively. Per hectare use of urea, TSP, MoP, Gypsum and ZnSO4
for Aromatic rice production were 67.57 kg, 104.9 kg, 84.8 kg, 17.1 kg, 0.54 kg and whose costs were estimated at Tk. 1100.89, Tk. 2509.13, Tk. 1272.41, Tk. 315.17 and Tk. 54, respectively (Table 6.1.2b).
24
Table 6.1.1b Operation wise per hectare human labor cost of Aromatic rice production
Operations Total Total cost(Tk.) Percentage of
labor(man/days) total cost
Seedbed preparation 8 2400 5.68
Mainland 18 5400 12.85
preparation
Uprooting & 19 5700 13.50
transplanting
Manure & fertilizer 9 2700 6.39
Weeding 10 3000 7.10
Irrigation 1 300 0.71
Pest management 10 3000 7.10
Harvesting & 54 16200 38.38
carrying
Threshing & storing 11 3300 7.81
Total 140 42000 100
Source: Field survey, 2019
6.1.4 Cost of manure: In the present study area cow dung was used as manure. The cost of manure for Aman and Aromatic rice production was Tk. 2675.3 and Tk. 2905, respectively (Table 6.1.2a and 6.1.2b).
6.1.5 Cost of irrigation: It can be seen from the table 6.1.2a and table 6.1.2b that the per hectare cost of irrigation for Aman and Aromatic rice production was Tk. 192.07 and Tk.
136.07, respectively. Irrigation was rarely used in the study area.
6.1.6 Cost of insecticides and pesticides: It was found that per hectare cost of insecticides and pesticides for Aman and Aromatic rice production were Tk. 3089.3 and Tk. 3096.07 (Table 6.1.2a and Table 6.1.2b).
25
6.2 Fixed costs
6.2.1 Interest on operating capital: Interest on operating capital was calculated by taking into account all the operating costs during the production period of Aman and Aromatic rice. Per hectare interest on operating capital was Tk. 1718.38 and Tk.
1641.384 for Aman and Aromatic rice production, respectively (Table 6.1.2a and Table 6.1.2b).
6.2.2 Land use cost: Average rental value of land per hectare for the study year was considered as land use cost. Per hectare value was estimated at Tk. 24700 for both Aman and Aromatic rice production (Table 6.1.2a and Table 6.1.2b).
6.3 Total cost: From the table of 6.1.2a and 6.1.2b it can be seen that the per hectare total cost of production of Aman and Aromatic rice were Tk. 81697.99 and Tk. 80796.12, respectively.
6.4 Gross return: Per hectare gross return of Aman and Aromatic rice was Tk.
109578.13 and Tk. 141222.04, respectively (Table 6.1.2a and Table 6.1.2b). Per hectare gross return of Aromatic rice was higher than Aman rice.
6.5 Gross margin: Gross margin is the gross return over variable cost. Per hectare gross margin was calculated Tk. 52298.46 and Tk.86767.3 for Aman and Aromatic rice, respectively (Table 6.1.2a & Table 6.1.2b). Gross margin was higher than that of Aman rice.
6.6 Net return: Per hectare net return of Aman and Aromatic rice were Tk. 27880.14 and Tk. 60425.92, respectively (Table 6.1.2a & Table 6.1.2b).
6.7 Benefit cost ratio (Undiscounted): Undiscounted Benefit Cost Ratio of Aman and Aromatic rice production was estimated 1.34 and 1.74, respectively, which implies that Tk. 1.34 and Tk. 1.74 will be achieved by expending every Tk. 1.00 (Table 6.1.2a and Table 6.1.2b).
6.8 Comparative profitability of Aman and Aromatic rice: From the Table 6.1.2a and Table 6.1.2b it was evident that both Aman and Aromatic rice productions were profitable. However, Aromatic rice cultivation was more profitable than Aman rice cultivation.
26
Table 6.1.2a: Per hectare cost and return of aman rice
Cost items Quantity(kg/ha) Price(Tk./kg) Value(Tk./ha) Percentage of Total
A.Gross Return 109578.13 100
Product 5278.24 18.6025 98188.4596 89.61
By product 11389.67 10.39
B. Total 57279.61 67.51
Variable Cost
Seed 24.17 30.97 748.87 0.88
Human Labor 141 300 42300 49.86
Total Fertilizer 8274.07 9.75
Urea 148.3 16.30 2427.7 2.86
TSP 140.23 23.71 3354.5 3.95
MOP 106.5 15.08 1604.5 1.89
Gypsum 35.84 15.83 711.37 0.84
ZnSO4 1.76 100 176 0.21
Manure 2675.3 3.15
Irrigation Cost 192.07 0.23
Insecticides & 3089.3 3.64
Pesticides
C. Total Fixed 24418.38 32.37
Cost
Interest on 1718.38 3.38
Operating Capital @ 6%
for 6 Months
Land Use Cost 24700 29.11
D. Total Cost 81697.99 100
(B+C)
E. Gross Margin 52298.46
(A-B)
F. Net Return 27880.14
(A-D)
G.BCR 1.34
(Undiscounted)
Source: Field survey, 2019
27
Table 6.1.2b: Per hectare cost and return of Aromatic rice
Cost items Quantity(kg/ha) Price(Tk./kg) Value(Tk./ha) Percentage of Total
A.Gross Return 141222.04 100
Product 3234.67 40.41 130713.01 92.56
By product 10509.03 7.44
B. Total Variable 54454.74 66.60
Cost
Seed 11.15 95.84 1066 1.29
Human Labor 140 300 42000 51.44
Total Fertilizer 5251.6 6.39
Urea 67.57 16.31 1100.89 1.34
TSP 104.9 23.71 2509.13 3.05
MOP 84.8 15.08 1272.41 1.55
Gypsum 17.1 18.43 315.17 0.38
ZnSO4 0.54 100 54 0.07
Manure 2905 3.54
Irrigation Cost 136.07 0.17
Insecticides and 3096.07 3.76
Pesticides
C. Total Fixed Cost 26341.38 33.40
Interest on 1641.384. 3.33
Operating Capital
@ 6% for 6 Months
Land Use Cost 24700 30.07
D. Total Cost 80796.12 100
(B+C)
E. Gross Margin 86767.3
(A-B)
F.Net Return (A-D) 60425.92
G. BCR 1.74
(Undiscounted)
Source: Field survey, 2019
28
CHAPTER 7
FACTORS AFFECTING THE YIELD
Cobb-Douglas production function has been chosen to determine the effects of selected variables. Estimated value of the coefficient and related statistics of the Cobb-Douglas production functions of Aman and Aromatic rice are given in Table 7.1.
7.1 Interpretation of the Result of Aman rice:
Amount of seed (X1): It can be seen from Table 7.1 that the regression coefficient of seed quantity was 0.2319 with a positive sign and it was insignificant.
Human labor cost (X2): From Table 7.1 the regression co-efficient of human labor cost was 0.7501 which was positive and was significant at 1 percent level, which indicated that an increase in one percent of human labor cost, remaining other factors constant, would result in an increase in yield by 0.7501 percent.
Amount of Urea (X3): From Table 7.1 that the regression coefficient of urea quantity was 0.2459 with a negative sign and it was insignificant.
Amount of MoP (X4): From Table 7.1 the regression coefficient of MoP quantity was 0.9721 with a positive sign and it was significant at 1 percent level, which indicated that an increase in one percent of MoP quantity, remaining other factors constant, would result in an increase in yield by 0.9721 percent.
Amount of TSP (X5): From table 7.1 the regression coefficient of TSP quantity was 0.5216 which was positive and was significant at 1 percent level, which indicated that an increase in one percent of TSP quantity, remaining other factors constant, would result in an increase in yield by 0.5216 percent.
Amount of Gypsum (X6): From Table 7.1 it can be seen that the regression coefficient of gypsum quantity was 0.15137 which had a positive sign and it was insignificant.
Insecticides and pesticides cost (X7): From the Table 7.1 it can be seen that the regression coefficient of insecticides and pesticides cost was 0.7621 which was positive and it was insignificant.
29
Manure cost (X8): It can be seen from Table 7.1 that the regression coefficient of manure cost was 0.2831 with a positive sign and it was significant at 1 percent level, which indicated that an increase in one percent of manure cost, remaining other factors constant, would result in an increase in yield by 0.2831 percent.
Coefficient of adjusted multiple determinations (R2): From Table 7.1 it was examined that the value of the adjusted multiple determination (R2) was 0.67 which indicated that about 67 percent of the variations of the yield were explained by the explanatory variables included in the model.
Goodness of Fit (F- value): The F value (7.42) of the estimated function was significant at 1 percent level, which implies good fit of the model.
7.2 Interpretation of the result of aromatic rice
Amount of seed (X1): It can be seen from Table 7.1 that the regression coefficient of seed quantity was 0.0363 with a positive sign and it was insignificant.
Human labor cost (X2): From Table 7.1 it can be seen that the regression co-efficient of human labor cost was 0.2513 which was positive and was significant at 1 percent level, which indicated that an increase in one percent of human labor cost, remaining other factors constant, would result in an increase in yield by 0.2513 percent.
Amount of Urea (X3): It can be seen from Table 7.1 that the regression coefficient of urea quantity was –0.17112 with a negative sign and it was significant at 1 percent level which indicated that an increase in 1 percent of urea quantity, remaining other factors constant, would result in a decrease of yield by 0.17112 percent.
Amount of MoP (X4): It can be seen from Table 7.1 that the regression coefficient of MoP quantity was 0.04628 with a negative sign and it was insignificant.
Amount of TSP (X5): From the table 7.1 it can be seen that the regression coefficient of TSP quantity was 0.05433 which had a negative sign and was insignificant.
30
Table 7.1: Estimated value of coefficient and related statistics of Cobb-Douglas production function
Exploratory Aman rice Aromatic rice
variables Estimated p-value Estimated p-value
Coefficient Coefficient
Constant 2.14 0.563376 7.382925*** 0.00961
Amount of Seed 0.2319 0.3729 0.036323 0.73152
(X1)
Human Labor Cost 0.7501*** 0.0031 0.251375*** 0.00315 (X2)
Amount of Urea -0.2459 0.3465 -0.17112*** 0.00427
(X3)
Amount of Mop 0.9721*** 0.0033 -0.04628 0.33827
(X4)
Amount of TSP 0.5216*** 0.0010 -0.05433 0.82503
(X5)
Amount of 0.15137 0.64376 0.251377*** 0.0033
Gypsum (X6)
Insecticides and 0.7621 0.3431 0.20453*** 0.01342
Pesticides Cost (X7)
Manure cost (X8) 0.2831*** 0.0096 -0.03935 0.14866
Adjusted R2 0.67 0.592
F-Value 7.42*** 3.59***
Source: Field survey, 2019
Note: *, ** and ***indicates significant at 10, 5 and 1 percent level respectively.
Amount of Gypsum (X6): From Table 7.1 it can be seen that the regression coefficient of gypsum quantity was 0.2513 which was positive and it was significant at 1 percent level which indicated that an increase in 1 percent of gypsum quantity, remaining other factors constant, would result in an increase of yield by 0.2513 percent.
31
Insecticides and pesticides cost (X7): From Table 7.1 it can be seen that the regression coefficient of insecticides and pesticides cost was 0.20453 which was positive and was significant at 1 percent level, which indicated that an increase in one percent of insecticides and pesticides cost, remaining other factors constant, would result in an increase in yield by 0.20453 percent.
Manure cost (X8): It can be seen from Table 7.1 that the regression coefficient of manure cost was -0.03935 with a negative sign and it was insignificant.
Coefficient of adjusted multiple determinations (R2): From the Table 7.1 it was examined that the value of the adjusted multiple determination (R2) was 0.59 which indicated that about 59 percent of the variations of the yield were explained by the explanatory variables included in the model.
Goodness of Fit (F- value): The F value (3.59) of the estimated function was significant at 1 percent level, which implies good fit of the model.
32
CHAPTER 8
PROBLEMS FACED BY FARMERS
The nature and extend of the problems faced by the farmers are discussed below:
8.1 Low price of output: It can be seen from Table 8.1 that low Price of output was the top most problem for rice growers. About 91.66 percent farmers of Amon and Aromatic rice faced this problem. It was 1st ranking problem faced by rice growers.
8.2 Absence of government declared price at market: About 83.33 percent farmers of Aman and Aromatic rice growers faced this problem (Table 8.1). It was 2nd ranking problem faced by Aman and Aromatic rice growers.
8.3 High amount of pest attack: We could see from Table 8.1 that it was the most faced problem by the Aromatic and Aman rice producers around 63.33 percent. It was 3rd ranking problem faced by Aman rice growers and Aromatic rice growers.
8.4 Lack of human labor at critical stage: Shortage of human labor at the critical stage is a seasonal problem and it occurs at the pick period of Aman and Aromatic rice production. About 60.55 percent of Aman and Aromatic rice growers faced this problem (Table 8.1). It was 4th ranking problem faced by respondent rice growers.
8.5 High wage of human labor: Labor wage was another problem faced by the farmers.
About 51.66 percent farmers of both Aman and Aromatic rice producers faced this problem (Table 8.1). It was 5th ranking problem faced by Aman rice growers and Aromatic rice growers.
33
Table 8.1 Problems faced by the farmers in producing Aman and Aromatic rice production:
Problems Farmers Rank
No %
Low price of output 55 91.66 1st
Absence of government declared price at market
50 83.33 2nd
High amount of pest attack 38 63.33 3rd
Lack of human labor at critical stage 33 60.55 4th
High wage of human labor 31 51.66 5th
Lack of storage facility 25 41.66 6th
High cost of transportation 23 38.33 7th
High distance of market 21 35 8th
Source: Field survey, 2019
34
8.6 Lack of storage facility: From Table 8.1 we could see that around 41.66 percent farmers of Aman and Aromatic rice producers, respectively faced this problem. It was 6th ranking problem faced by Aman rice and Aromatic rice growers.
8.7 High cost of transportation: About 38.33 percent farmers of Aman and Aromatic rice growers faced this problem (Table 8.1). It was 7th ranking problem faced by respondent rice growers.
8.8 High distance of market: About 35 percent farmers of aman and aromatic rice growers, respectively, faced this problem (Table 8.1). It was 8th ranking problem faced by aman and aromatic rice grower in the study area.
.
35