FINANCIAL PROFITABILITY AND RESOURCE USE EFFICIENCY OF BRINJAL CULTIVATION IN SOME SELECTED AREA OF
GAZIPUR DISTRICT
MOHAMMAD SHAHADAT HOSSEN
REG NO. 12-04873
DEPARTMENT OF AGRICULTURAL ECONOMICS SHER-E-BANGLA AGRICULTURAL UNIVERSITY
DHAKA -1207
DECEMBER, 2018
FINANCIAL PROFITABILITY AND RESOURCE USE EFFICIENCY OF BRINJAL CULTIVATION IN SOME SELECTED AREA OF
GAZIPUR DISTRICT
BY
MOHAMMAD SHAHADAT HOSSEN
REG NO. 12-04873
A Thesis
Submitted to the Department of Agricultural Economics, Sher-e-Bangla Agricultural University, Dhaka-1207
In partial fulfillment of the requirements for the degree of
MASTER OF SCIENCE (MS) IN
AGRICULTURAL ECONOMICS SEMESTER: JULLY-DECMBER, 2018
Approved by:
Prof. Gazi M. A. Jalil
Chairman Examination Committee
Department of Agricultural Economics Sher-e-Bangla Agricultural University,
Dhaka-1207
Supervisor
(Dr. Md. Abdur Rashid) Chief Scientific Officer Agricultural Economics Division Bangladesh Agricultural research
Institute
Joydebpur, Gazipur-1701
Co-supervisor
( Dr. Rokeya Begum) Professor
Department of Agricultural Economics Faculty of Agribusiness Management, Sher-e-Bangla Agricultural University,
Dhaka-1207
Bangladesh Agricultural Research Institute
Joydebpur, Gazipur- 1701
FAX: 88-02-9261415Bangladesh
WEB: www.bari.gov.bdCERTIFICATE
This is to certify that thesis entitled, “FINANCIAL PROFITABILITY AND RESOURCE USE EFFICIENCY OF BRINJAL CULTIVATION IN SOME SELECTED AREA IN GAZIPUR DISTRICT” submitted to the Department of Agricultural Economics, Faculty of Agribusiness Management, Sher-e-Bangla Agricultural University, Dhaka-1207, in partial fulfillment of the requirements for the degree of MASTER OF SCIENCE IN AGRICULTURAL ECONOMICS, embodies the result of a piece of bona fide research work carried by MOHAMMAD SHAHADAT HOSSEN bearing Registration No. 12-04873 under my supervision and guidance. No part of the thesis has been submitted for any other degree or diploma.
I further certify that such help or source of information, as has been availed of during the course of this investigation has duly been acknowledged.
30 November, 2019
………
(Dr. Md. Abdur Rashid)
Dhaka, Bangladesh Chief Scientific Officer Bangladesh Agricultural Research Institute Joydebpur, Gazipur-1701
Supervisor
Dedicated to My
Beloved Parents
ACKNOWLEDGEMENTS
The author seems it a much privilege to express his enormous sense of gratitude to the almighty Allah for there ever ending blessings for the successful completion of the research work.
The author wishes to express his gratitude and best regards to his respected Supervisor, Dr. Md. Abdur Rashid, (Agricultural Economist), Chief Scientific Officer, Agricultural Economics Division, Bangladesh Agricultural research Institute, Joydebpur, Gazipur-1701, for his continuous direction, constructive criticism, encouragement and valuable suggestions in carrying out the research work and preparation of this thesis.
The author wishes to express his earnest respect, sincere appreciation and enormous indebtedness to his reverend Co-supervisor, Dr. Rokeya Begum, Professor, Department of Agricultural Economics, Sher-e-Bangla Agricultural University, Dhaka, for his scholastic supervision, helpful commentary and unvarying inspiration throughout the research work and preparation of the thesis.
The author feels to express his heartfelt thanks to the honorable chairman of Agricultural Economics, Prof. Gazi M. A. Jalil, along with all other teachers and staff members of the Department of Agricultural Economics, Sher-e-Bangla Agricultural University, Dhaka, for their co-operation during the period of the study.
The author feels proud to express his deepest and endless gratitude to all of his course mates and friends to cooperate and help him during taking data from the field and preparation of the thesis. The author wishes to extend his special thanks to his class mates and friends for their keen help as well as heartiest co-operation and encouragement.
The author expresses his heartfelt thanks to his beloved parents, Elder Sister and Brother and all other family members for their prayers, encouragement, constant inspiration and moral support for his higher study. May Almighty bless and protect them all.
The Author
FINANCIAL PROFITABILITY AND RESOURCE USE EFFICIENCY OF BRINJAL CULTIVATION IN SOME SELECTED AREA OF
GAZIPUR DISTRICT
ABSTRACT
The present study was designed to determine the financial profitability and resource use efficiency of brinjal (Solanum melongena L.) cultivation in some selected area of Gazipur district. A total of 90 brinjal farmers from three upazila namely Sreepur (30), Kapasia (30), and Kaliakair (30) were selected. Tabular technique and statistical technique such as Cobb douglas production function was used to achieve the major objectives of the study. The major findings of the study revealed that brinjal production was highly profitable. The total cost of production was estimated Tk. 265617, Tk. 262652 and Tk. 252640 per hectare for Sreepur, Kapasia and Kaliakair upazila respectively. The average total cost was Tk. 260303. Total yield per hectare were 268890 kg, 29905 kg and 26812 kg for Sreepur, Kapasia and Kaliakair respectively. The average per unit brinjal price was Tk. 15 for all areas. Gross return for Sreepur, Kapasia and Kaliakair upazila were Tk. 430240, Tk. 418670 and Tk. 402180 respectively. Net return per hectare was Tk. 164623, Tk. 156018 and Tk. 149540 respectively. The average net return was Tk. 157732 per hectare. BCR on full and variable cost were 1.62 and 2.02, 1.60 and 1.98, 1.59 and 2.08 for Sreepur, Kapasia and Kaliakair upazila respectively. The average BCR on full and variable cost were 1.60 and 2.03 which implies that one taka investment generated 0.60 Tk. and 1.03 Tk. respectively. The regression coefficient of hired labor, land preparation, chemical fertilizers, irrigation and pesticide showed positive and significant effect and seedling, manure showed insignificant effect. The coefficient of multiple determinations, R2 and F-value were 79% and 43.48 which indicated good fit of a model. The ratio of MVP and MFC of hired labor, seedling, land preparation, manure, chemical fertilizers, irrigation and pesticide was 0.54, 4.25, 3.32, -0.06, 2.03, 2.71 and 4.22 respectively. It indicated that farmers in the study areas were over utilizing hired labor, and manure. On the other hand seedling, land preparation, chemical fertilizers, irrigation, and pesticide were underutilized. Farmers faced many problems in the study area during brinjal production. Among them inset infection, higher price of pesticides, lack of quality seedling, high wage rate of labor, lack of human labor were major problems of brinjal cultivation. Supply of inputs and improvement of market facilities can play an important role in increasing brinjal production.
LIST OF CONTENTS
CHAPTER TITLE PAGE NO.
ACKNOWLEDGEMENT i
ABSTRACT ii
LIST OF CONTENTS iii
LIST OF TABLES vii
LIST OF FIGURES viii
ABBREVIATION AND ACRONYMS ix
CHAPTER 1 INTRODUCTION 1-7
1.1 General Background to the study 1
1.2 Vegetables Production in Bangladesh 2
1.3 Origin and Status of Brinjal 3
1.4 Nutritive and Medicinal Value of Brinjal 5
1.5 Objectives of the Study 6
1.6 Justification of the Study 6
1.7 Statement of the problem 6
1.8 Limitations of the Study 7
CHAPTER 2 REVIEW OF LITERATURE 8-13
CHAPTER 3 METHODOLOGY 14-21
3.1 Introduction 14
3.2 Selection of the Study Area 14
3.3 Preparation of Survey Schedule 14
3.4 Selection of Sample and Sampling Technique 15
3.5 Data Collection Period 15
3.6 Method of Data Collection 15
3.7 Analytical Technique 16
3.7.1 Tabular Analysis 16
3.7.2 Functional Analysis 17
3.8 Procedure of Estimating Indicators 17
3.8.1 Cost of Human Labor 18
3.8.2 Cost of Land Preparation 18
3.8.3 Cost of Seedling 18
3.8.4 Cost of Manure 18
3.8.5 Cost of Chemical Fertilizers 18
3.8.6 Cost of Irrigation 19
3.8.7 Cost of Pesticide 19
3.8.8 Cost of Others (Bamboo Stick) 19
3.8.9 Interest on Operating Capital 19
3.8.10 Cost of Land Use 20
3.8.11 Gross Return 20
3.8.12 Gross Margin 20
3.8.13 Net Return 20
3.8.14 Benefit Cost Ratio (BCR) 21
3.8.15 Measurement of Resource Use Efficiency 21 CHAPTER 4 DESCRIPTION OF THE STUDY AREA 22-29
4.1 Introduction 22
4.2 Location 22
4.3 Administrative Area 25
4.4 Physical Features, Topography and Soil Conditions
25
4.5 Population 26
4.6 Climate, temperature and Rainfall 26
4.7 Land and Agriculture 27
4.8 Education 28
4.9 Occupation 28
4.10 Communication, Transportation and marketing Facilities
28
4.11 Non-government Organizations 29
CHAPTER 5 SOCIOECONOMIC CHARACTERISTICS OF BRINJAL FARMERS
30-38
5.1 Introduction 30
5.2 Age Distribution of Bribjal Farmers 30 5.3 Education Level of Bribjal Farmers 31 5.4 Occupational Status of Bribjal Farmers 32 5.5 Farming Experience of Bribjal Farmers 32
5.6 Family Type of Bribjal Farmers 33
5.7 Family Size of Bribjal Farmers 34
5.8 Male-Female Ratio of Bribjal Farmers 35
5.9 Farm Size of Bribjal Farmers 36
5.10 Income Level and Other Sources of Income 37 5.10.1 Agricultural Income of Brinjal Farmers 37
5.10.2 Non-Agricultural Income of Brinjal Farmers 38 5.11 Family Expenditure of Brinjal Farmers 38 CHAPTER 6 FINANCIAL PROFITABILITY OF
BRINJAL FARMING
39-49
6.1 Introduction 39
6.2 Estimation of Variable Costs of Brinjal Production
39
6.2.1 Cost of Hired Labor 40
6.2.2 Cost of Land Preparation 40
6.2.3 Cost of Seedling 42
6.2.4 Cost of Manure 42
6.2.5 Cost of Chemical Fertilizers 42
6.2.6 Cost of Irrigation 43
6.2.7 Cost of Pesticide 43
6.2.8 Cost of Others (Bamboo stick) 43
6.2.9 Interest on Operating Capital 43
6.2.10 Total Variable Cost 44
6.3 Estimation of Fixed Costs of Brinjal Production 44
6.3.1 Family Labor Cost 44
6.3.2 Rental Value of Land 46
6.3.3 Total Fixed Cost 46
6.4 Total Cost 46
6.5 Estimation of Returns of Brinjal Production 47
6.5.1 Gross Return 47
6.5.2 Gross Margin 48
6.5.3 Net Return 48
6.5.4 Benefit Cost Ratio (BCR) 49
6.6 Concluding Remark 49
CHAPTER 7 EFFECTS AND RESOURCE USE EFFICIENCY OF INPUT USED
50-56
7.1 Introduction 50
7.2 Factors Affecting of Brinjal Cultivation 50 7.3 Interpretation of the Estimated Values 51
7.3.1 Hired Labor Cost 51
7.3.2 Seedling Cost 51
7.3.3 Land Preparation Cost 52
7.3.4 Manure Cost 53
7.3.5 Chemical Fertilizers Cost 53
7.3.6 Irrigation Cost 53
7.3.7 Pesticide Cost 53
7.3.8 Coefficient of Multiple Determination (R2) 54
7.3.9 Goodness of Fit (F-value) 54
7.3.10 Returns to Scale 54
7.4 Measurement of Resource Use Efficiency 54 CHAPTER 8 PROBLEMS OF BRINJAL
CULTIVATION
57-63
8.1 Introduction 57
8.2 Major Problems Reported by the Farmers 57
8.2.1 Insect Infestation 57
8.2.2 Higher Price of Pesticides 58
8.2.3 Non Availability and Higher Price of Labor 58 8.2.4 High Input Cost (seed/seedling and fertilizer) 58 8.2.5 Scarcity of Quality Verity of Seed, Fertilizer
and Pesticides
59
8.2.6 Marketing Problem 60
8.2.7 Low Price of Product at Late Harvesting Period
60
8.2.8 Lack of Technical Information 60
8.2.9 Lack of Financial Capital 60
8.2.10 Excessive Weed Infestation 61
8.2.11 Carrying and Handling Problems 61 8.2.12 Problems Faced by Female Family Labor 62 8.2.13 Lack of Knowledge about Proper Time of
Sowing/Planting
62 8.3 Problems Solution Suggested by Farmers 62
8.4 Concluding Remark 63
CHAPTER 9 SUMMARY,CONCLUSION AND RECOMMENDATIONS
64-67
9.1 Introduction 64
9.2 Summary of the Study 64
9.3 Conclusion 66
9.4 Recommendations 66
9.5 Scope of the Study 67
REFERENCES 68-72
APPENDIX 73-77
LIST OF TABLES
Table Title Page 1.1 Percentage contribution of Agricultural subsectors at
GDP
2 1.2 Area and production of vegetables in Bangladesh 2 1.3 Total production (MT) of brinjal producing
country in 2016-17
3 1.4 Area and production of brinjal by region from 2014-15
to 2016-17
4 1.5 Area and production of brinjal in gazipur district 5 1.6 Nutrients values and weights of brinjal (100gm) 5 4.1 Area, union, municipality, village, mahalla & mauza of
gazipur district
25
4.2 Land topography in survey area 26
4.3 Population, no of household, male–female ratio of gazipur upazila
26 4.4 Average maximum and minimum temperature in
selected station
27 4.5 Annual rainfall ( in millimeter) in selected station 27 4.6 Land distribution under different cropping pattern 27
4.7 Occupational level in the study areas 28
5.1 Age distribution of brinjal farmers 30
5.2 Educational level of the owners of brinjal farmers 31
5.3 Occupational status of the brinjal farmers 32
5.4 Farming experience of the brinjal farmers 33
5.5 Family type of the brinjal farmers 33
5.6 Family size of the brinjal farmers 34
5.7 Farm size of the brinjal farmers 35
6.1 Per hectare level of input use for brinjal cultivation 41 6.2 Per hectare cost of brinjal cultivation in the study areas 45 6.3 Per hectare profitability of brinjal cultivation in the
study area
47 7.1 Estimated values of co-efficient and related statistics of
Cobb-Douglas production function
52 7.2 Estimated resource use efficiency in brinjal cultivation 55 8.1 Problems faced by the farmers in brinjal cultivation 58
8.2 Major problems faced by brinjal farmers 61
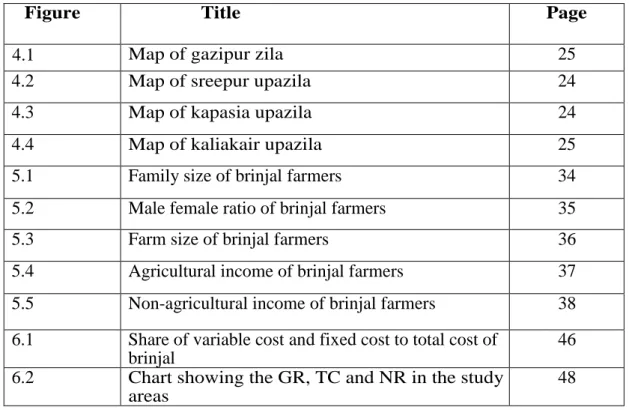
LIST OF FIGURES
Figure Title Page
4.1 Map of gazipur zila 25
4.2 Map of sreepur upazila 24
4.3 Map of kapasia upazila 24
4.4 Map of kaliakair upazila 25
5.1 Family size of brinjal farmers 34
5.2 Male female ratio of brinjal farmers 35
5.3 Farm size of brinjal farmers 36
5.4 Agricultural income of brinjal farmers 37
5.5 Non-agricultural income of brinjal farmers 38 6.1 Share of variable cost and fixed cost to total cost of
brinjal
46 6.2 Chart showing the GR, TC and NR in the study
areas
48
ABBREVIATION AND ACRONYMS
AEZ Agro-Ecological Zone
BARI Bangladesh Agriculture Research Institute
BARC Bangladesh Rural Advancement Committee
BAU Bangladesh Agricultural University
BBS Bangladesh Bureau of Statistics
BCR Benefit Cost Ratio
BER Bangladesh Economic Review
0C Centigrade
DAE Department Agricultural Extension
DAP Di Ammonium Phosphate
et al. And Others
FAO Food and Agriculture Organization
FAOSTAT Food and Agricultural Organization Statistics
GR Gross Return
GM Gross Margin
GM Geometric Mean
Gm Gram
HYV High Yielding Varieties
ha Hectare
IOC Interest on Operating Capital
Kg Kilogram
ln Natural Log
MS Master of Science
MT Metric Ton
MOP Muriate of Potash
NR Net Return
Tk. Taka
% Percentage
SAU Sher-e- Bangladesh Agricultural University
REG Registration
Rs Rupee
t ha-1 Ton per hectare
t Tons
TSP Triple Super Phosphate
TVC Total Variable Cost
TC Total Cost
US United State of America
USDA United States Department of Agriculture
UK United Kingdom
CHAPTER 1 INTRODUCTION
1.1 General Background of the Study
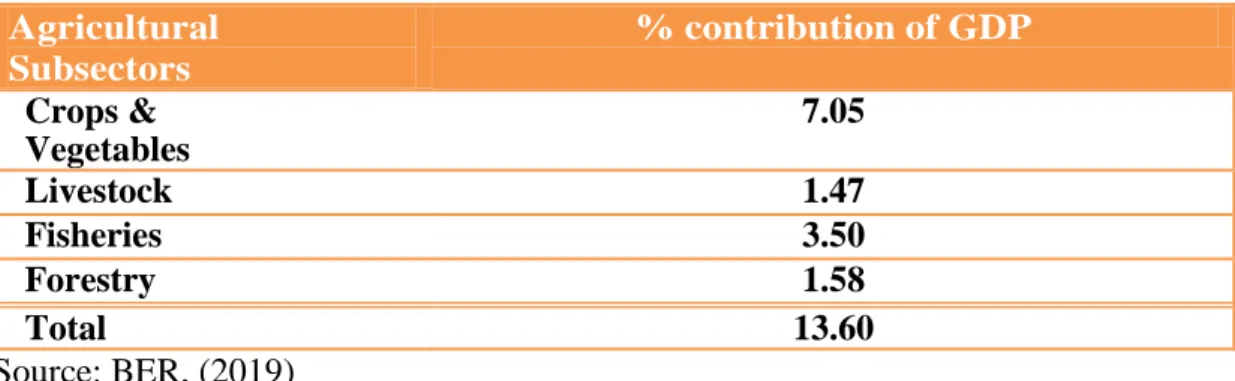
Agriculture is the largest employment sector in Bangladesh. Agriculture plays an important role in overall economic development of Bangladesh. The performance of this sector has an impact on macroeconomic objectives like employment generation, poverty alleviation and food security. A plurality of Bangladesh earns their living from agriculture. It contributes about 13.60% in national GDP (BER, 2019). Due to gradual transformation of the economy from agriculture to industry and service sectors, this sector decreases gradually around 50% in 1970 to 13.60% in 2019.
Despite increase in the shares of fisheries, livestock and forestry, crop sub-sector alone accounts for 52.81% share of agricultural GDP in FY 2018-19 (BER, 2109).
Brinjal is an important and popular vegetable in Bangladesh which is consumed throughout the year. Brinjals are classified into two categories in respect of their production period. These are Rabibrinjal and Kharifbrinjal. Though it is more or less available throughout the year, its peak supply comes during December to April (Mollika, 2015). Brinjal is a good source of vitamins and minerals. Plenty of brinjal are produced in Bangladesh and in 2011-2012; the total production of brinjal was 354 thousand metric tons (BBS, 2012).
The present study is essential for brinjal production in Bangladesh. The study not only emphasizes on the profitability of brinjal production but also establish the relationship between socioeconomic characteristics and problems faced by the brinjal growers. It also identifies crucial problems of brinjal production and ranks those problems which make this research identical. The results of the study will be helpful to the policy maker to formulate future policy considering farmers production problem and the researcher for further study about brinjal. Table 1.1 presents the percentage contribution of agricultural subsectors at total GDP of agriculture.
Table 1.1 Percentage contribution of agricultural subsectors at GDP Agricultural
Subsectors
% contribution of GDP Crops &
Vegetables
7.05
Livestock 1.47
Fisheries 3.50
Forestry 1.58
Total 13.60
Source: BER, (2019)
1.2 Vegetables Production in Bangladesh
In Bangladesh, more than 60 different types of vegetables of indigenous and exotic origin are grown. At present total vegetables growing area in the country is about 2,25,153 hectares (2.47 acre is equal to a hectare), of which 65% are cultivated during winter (DAE, 2016).People of south Asian country like Bangladesh cannot think of food without adding vegetable. Vegetable have a great demand in Bangladesh. The major crops grown and consumed in Bangladesh are rice, wheat, maize, potato, tomato and brinjal etc. In FY 2016-17, total area under vegetable is 2.67 lac hectares with the total production 1.89 lac metric tons (DAE, 2018) in our country. The production of vegetable can meet up the domestic demand.
Table 1.2 Area and production of vegetables in Bangladesh
Year Area (Lac ha) Production (Lac MT)
2009-10 1.73 1.51
2010-11 1.87 1.61
2011-12 1.98 1.58
2012-13 1.96 1.64
2013-14 2.13 1.60
2014-15 2.19 1.64
2015-16 2.25 1.76
2016-17 2.67 1.89
Source: DAE, (2018).
In FY 2016-17, total area under vegetable cultivation and total production of vegetable has increased. Nowadays they are valuable trade crops in the world. Due to huge population demand for cereals, land area under vegetables is also increasing that creating fill up gap between demand and supply of vegetables.
1.3 Origin and Status of Brinjal
Brinjal is a member of the Solanaceae or nightshade family, which includes tomatoes, potatoes, and peppers. Its origin is considered to be india where it continues to grow wild. This spiny, bitter, orange, pea-sized fruit has been cultivated throughout india and china for more than 1500 years (Wikipidia, 2018). Brinjal is one of the earliest cultivated crops because they were less perishable than other foods of the time.
Eggplant (US, Australia), aubergine (UK), brinjal (South Asia and South Africa) is a plant species in the nightshade family solanaceae. Solanum melongena is grown worldwide for its edible fruit.
Brinjal is used as a vegetable in most parts of the world. It is commonly used for curry and other savory dishes. There are many different varieties of brinjal. Each one has unique flavor and taste. Among dark purple, brownish purple, black, magenta and black brinjal have more Sulfur compounds.
The total production of brinjal is 5,23,09,119 metric tons up by 2.2% from 5,11,92,811 metric tons in 2016 (FAOSTAT, 2019). China was by far the largest producer of brinjals, according for over 62% of global production. And India was contributed second high production of global world.
Table 1.3 Total productions (MT) of brinjal producing country in 2016-17
Country 2016 2017
China 32883567 31855430
India 12510000 12515000
Egypt 1307793 1300265
Turkey 888917 854049
Iran 654149 671399
Indonesia 535436 509749
Japan 307800 306000
Italy 286473 317585
Philippines 241901 235626
Spain 225912 242643
Source: FAOSTAT, (2018)
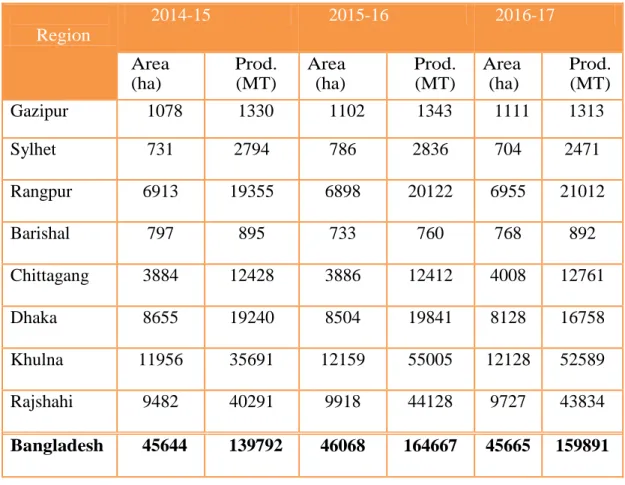
In Bangladesh, brinjal is cultivated in all the years round. But basically brinjal cultivated in winter season. BARI has released many varieties which can be grown in Robibrinjal in winter season and Kharifbrinjal in summer season (Haque, 2015). It is grown more or less in every district of Bangladesh. But brinjal is commercially cultivated in Jamalpur, Narsingdi, Gazipur, Tangial, Khulna, Rajshashi and Dhaka (BBS, 2016). In Gazipur district cultivate three varieties such as kajla, nayantara and uttara. Table 1.4 represent total area and Production of Brinjal by Regions from 2014-15 to 2016-17 in Bangladesh in different regions.
Table 1.4 Area and production of brinjal by regions from 2014-15 to 2016-17
Region
2014-15 2015-16 2016-17
Area (ha)
Prod.
(MT)
Area (ha)
Prod.
(MT)
Area (ha)
Prod.
(MT)
Gazipur 1078 1330 1102 1343 1111 1313
Sylhet 731 2794 786 2836 704 2471
Rangpur 6913 19355 6898 20122 6955 21012
Barishal 797 895 733 760 768 892
Chittagang 3884 12428 3886 12412 4008 12761
Dhaka 8655 19240 8504 19841 8128 16758
Khulna 11956 35691 12159 55005 12128 52589
Rajshahi 9482 40291 9918 44128 9727 43834
Bangladesh 45644 139792 46068 164667 45665 159891
Source: BBS, (2018)
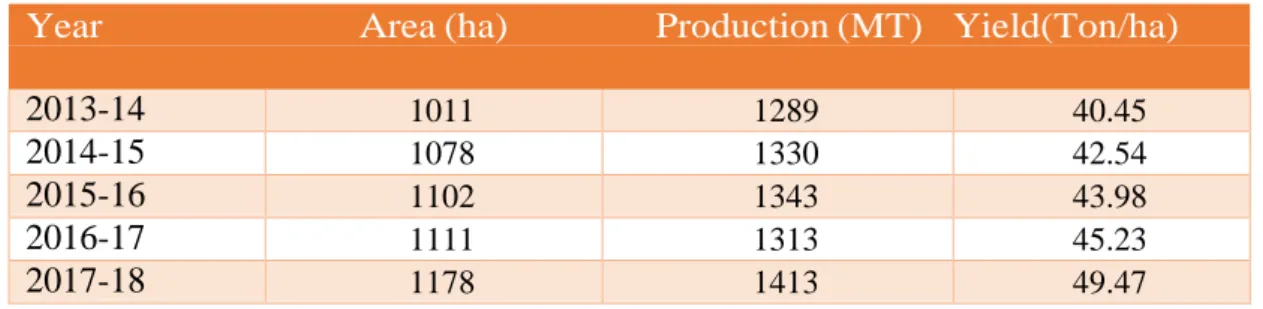
The yield of brinjal is 45.58 ton/ha which is very low compared to the other brinjal producing countries (BBS, 2018). A large number of farmers in the study area are engaged in brinjal cultivation because it is profitable compare to other vegetable crops. Total area, production and yield are shown in the following table 1.5.
Table 1.5 Area and production of brinjal in gazipur district
Year Area (ha) Production (MT) Yield(Ton/ha)
2013-14 1011 1289 40.45
2014-15 1078 1330 42.54
2015-16 1102 1343 43.98
2016-17 1111 1313 45.23
2017-18 1178 1413 49.47
Source: BBS, (2014) & (2018)
1.4 Nutritive and Medicinal Value of Brinjal
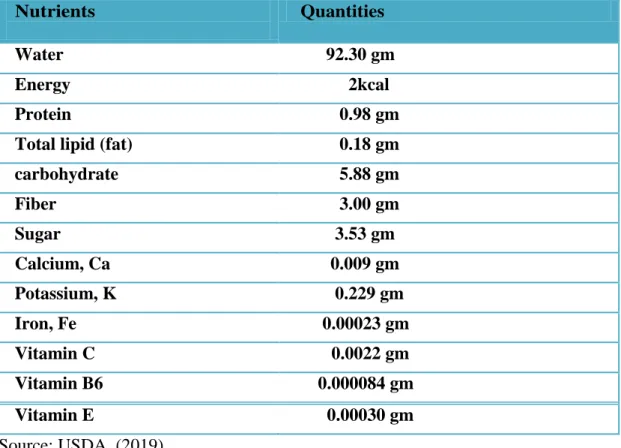
Brinjal are root vegetable with a variety of benefits. Brinjal also known as aubergines, belong to the nightshade family of plants and are used in many different dishes around the world. Although often considered a vegetable, they are technically a fruit, as they grow from flowering plant and contain seeds. There are many varieties that range in size and color. And while brinjal with a deep purple skin are most common, they can be red, green or even black. The main nutrients in 100 grams of raw onions are given below.
Table 1.6 Nutrients Values and weights of Brinjal (100 gm)
Nutrients Quantities
Water 92.30 gm
Energy 2kcal
Protein 0.98 gm
Total lipid (fat) 0.18 gm carbohydrate 5.88 gm
Fiber 3.00 gm
Sugar 3.53 gm
Calcium, Ca 0.009 gm Potassium, K 0.229 gm
Iron, Fe 0.00023 gm
Vitamin C 0.0022 gm Vitamin B6 0.000084 gm Vitamin E 0.00030 gm Source: USDA, (2019)
1.5 Objectives of the Study
The overall objective of the study is to determine profitability and resource use efficiency of brinjal cultivation in some selected area of gazipur district. The objectives of the study are as follows:
I. To identify the socio-demographic profile of the sample farmers;
II. To estimate the cost and returns of brinjal production;
III. To determine the factors affecting the economic return of brinjal cultivation;
IV. To estimate resource use efficiency of selected inputs of brinjal farms;
V. To examine the impact of brinjal cultivation of farmers socio-economic status and
VI. To identify the major problems associated with brinjal cultivation.
1.6 Justification of the Study
Eggplant, known as brinjal in Bangladesh, is a high-value crop that is widely grown and consumed throughout the country. About 150,000 farmers grow brinjal in Bangladesh and it ranks third after patato and rice among crops in the country in terms of quantity consumed (BBS, 2018). It is a critical piece of Bangladesh’s food security puzzle. As most of the people in our country are dependent on agriculture, it is essential to diversify crops for the increasing production.
Among the vegetable crops, brinjal plays an important role in the economy of Bangladesh. The climate of Bangladesh is also suitable for brinjal cultivation. There are various reasons for the poor yield rate brinjal in Bangladesh. Most of the brinjal farmers are afraid of investing in brinjal cultivation due to insufficient information on brinjal farming, credit facilities and marketing techniques. While making production decision, they consider cost of production against the yield of the crop.
1.7 Statement of the problems
Bangladesh is an agricultural country. Most of the population of Bangladesh is directly or indirectly dependent on the agricultural sectors and most of the
employment sectors are circled in agricultural base. So we should give more emphasis to the agricultural sector. In our country many kinds of product is cultivated some are directly used for food; some are used industrial sector and so many kinds. I prefer to ananlize the cost of inputs of the different agriculture product, and how the corresponding cost of the production can be economic model. When an innovation is introduced to the farmer, it may be readily accepted, partly accepted, completely or partly rejected or sometimes, it may so happen that the adoption of innovation is discontinued or totally stopped. These happening are certainly due to a number of factors.
To what extent of brinjal production has been adopted by the brinjal growers?
What are the characteristics of brinjal growers?
What are the relationships of the adoption of brinjal production technologies with some selected characteristics of the brinjal growers?
1.8 Limitations of the Study
There were some limitations during the survey conducting period. The researcher had to face the following problems in collecting data from the field.
I. Farmers did not keep any records of their farming. So, most of the answers were from their memory.
II. Sometimes respondents could not answer to questions accurately.
III. Farmers provided data in local units of measures in response to questions.
IV. Sometimes respondents did not cooperate willingly to provide information. So researcher had to put extra effort during the interview.
V. Most of the farmers did not have any knowledge about research study.
Therefore, it was difficult to explain.
VI. Most of the brinjal farmers, in the study areas were middle aged group and they got primary level of education.
CHAPTER 2
REVIEW OF LITERATURE
The review of literature in any research is necessary because it provides knowledge and information relevant to the proposed study. By reviewing past research paper, it gives a guideline on how to design the future research paper properly. Some of the studies may not entirely relevant to the present study, but their findings, methodology of analysis and suggestions have a great impact on the present study. Review of some research works relevant to the present study, have been discussed below.
Chowdhury (2011) concluded that commercial vegetable growers of Gazipur district earned the highest profit than small scale vegetable growers. He showed that per hectare BCR of brinjal, bitter gourd, and teasle gourd production in small scale were 1.91, 1.46, and 1.63 respectively where BCR in commercial scale production were 2.35, 1.73, and 1.95 respectively. Cobb Douglas production function model revealed that small scale growers allocated their resource in the zone of decreasing returns and commercial growers in the zone of increasing returns.
Habib et al. (2015) carried out an experiment on technical efficiency and profitability of brinjal production in some selected areas of Bangladesh. The net return was Tk.
16459.7 and per hectare yield was 30704 kg. The coefficients of human labor, seeds, irrigation water were positive which had positive effect on brinjal production. In technical inefficient model experiment, farm size, training had negative coefficients which help in reducing technical inefficiency.
Hasan et al. (2014) examined the profitability of important summer vegetables namely bottle gourd, brinjal, and cucumber in Keranigonj upazilla. The study found that the benefit cost ratios (BCR) considering variable cost were 2.83, 4.88 and 4.57 for bottle gourd, brinjal and cucumber respectively. The highest BCR was for brinjal (3.72) and the lowest for bottle gourd (2.40) on the basis of total cost. Major problems identified by the study were lack of capital, low price of output, high price of input, price fluctuation, and lack of storage facilities etc.
Hasan (2010) conducted an economic study on brinjal production in selected areas of Bangladesh. Per hectare yields of brinjal were 26217 kg, 28202 kg and 30637 kg for small, medium and large farmers. In technical inefficient model farm size was significant but showed negative sign which means that larger farm holdings were technically efficient.
Islam (2000) carried out a study on economic analysis of winter vegetables like brinjal, cabbage, radish and tomato in three villages of Sadar thana under Mymensingh district. However he showed that for producing these winter vegetables, per hectare cost was the highest for cabbage followed by brinal, radish and tomato.
On the other hand per hectare yield was the highest for brinjal followed by cabbage, tomato and radish which were Tk. 80240.00, Tk. 60540.00, Tk. 45353.00. and Tk.
44751.90 respectively.
Islam et al. (2000) analyzed the productivity and resource use efficiency of potato production using TPS technology in the farmer's field in district of Bogra and Jessore of Bangladesh. The TPS technology found to have a higher benefit-cost ratio (BCR) than the traditional technology. It was revealed from the efficiency analysis that the potato growers using TPS technology allocated their resources in rational stage of production. However, there existed inefficiency in the uses of human labor, seed, manure and fertilizers in TPS technology and had a potentiality to increase potato output by 20 percent with efficient organization of these resources.
Kamal et al. (2017) attempted to estimate the profitability, domestic resource cost and problems of brinjal production. They study revealed that total costs of brinjal production per hectare were about Tk. 240097 and Tk. 216831 in Pabna and Jhenaidah district respectively. BCR was 2.02 and 1.83 which indicated profitable brinjal production. Domestic resource cost was 0.47 and 0.52 in Pabna and Jhenaidah. This showed that Bangladesh has comparative advantages in brinjal production.
Khandoker (2013) conducted a study to assess the profitability, resource use efficiency, and factors affecting the production of brinjal, bean, and radish. The benefit cost ratio on full cost basis for brinjal, country bean and radish were 1.86,
1.42 and 1.50 respectively. Human labor, land preparation, seed, TSP, experience in farming, and training had positive and significant effect on country bean, brinjal, and radish production research was conducted on bottle gourd production and all of them were analyzed the profitability combined with other vegetables. Moreover there is no research which conducted only on bottle gourd production and covered all aspects.
Therefore, this study has attempts to analyze the profitability, input output relationship, and resource use efficiency of bottle gourd production in a wider aspect.
M.A. Rashid (2018) A study was conducted in 35 districts of Bangladesh during 2016-17 winter season for assessing the farm level performance of Bt eggplant in reducing pesticide use, cultivation cost and increase farm income. Five hundred five Bt eggplant farmers were selected purposively and 350 non-Bt eggplant farmers were selected randomly for the study. Net returns per hectare were Tk. 179,602/ha for Bt eggplant as compared to Tk. 29,841/ha for non-Bt eggplant. Pesticides were applied 11 times to Bt eggplant where as it was 41 times to non-Bt eggplant for controlling sucking pests. The Bt eggplant farmers saved 61 percent of the pesticide cost compared to non-Bt eggplant farmers, experienced no losses due to fruit and shoot borer, and received higher net returns. All Bt and 86% non-Bt farmers wanted to cultivate Bt eggplant in the next year if they can obtain the seeds/seedlings from the research station. For getting higher yield and economic benefits, in the course of technology dissemination, the importance of good production practices must be emphasized.
Matare and Suhasuni (2014) the present study on “Economic analysis of production and marketing of brinjal in South Gujarat Johansen test used for examine the integration of wholesale prices of brinjal among the major markets of South Gujarat (Surat, Navsari and Vyara) and out of South Gujarat (Ahmadabad and Vadodara) The major findings of the study revealed that there was cost of cultivation per hectare and cost of production per quintal of brinjal was ₹ 92867 and ₹ 251.83, respectively. The overall net income per hectare was ₹ 211212. The return per rupee of investment was
₹ 3.28. Following three marketing channel were identified in the study area for marketing of brinjal. Channel I: Producer –Wholesaler cum commission agent - Retailer – Consumer, channel II: Producer – Wholesaler – Consumer and Channel III:
Producer- village merchant- Commission agent cum wholesaler- Retailer – Consumer. The channel II was more efficient than the because producer share in consumer rupee was more (71.33%) in channel II, than channel I (58.95%) in Navsari market. In Surat market producer share in consumer rupee was maximum (56.27%) in channel I than the channel III (51.27%) and in Tapi market channel producer share in consumer rupee is highest in channel II than (71.17%) channel I (61.90%).
Millika (2015) The present study was designed to analyze the production, cost, return and profitability of three winter vegetables (brinjal, country bean and cabbage) production of three villages ofNarshingdi District in Bangladesh. To achieve the objectives, data were collected from 60 farmers. The sample farmers were selected through purposive sampling technique.The major findings of the study were: among the winter vegetables, cabbage production was more profitable. Per hectare profitability of growing vegetables from the viewpoints of individual farmers was measured in terms of gross return, gross margin and value addition. Per hectare gross costs of brinjal, country bean and cabbage production were Tk. 241277, Tk. 162337 and Tk. 204152 respectively, and per hectare average yields of brinjal, country bean and cabbage were estimated at 24175 kg/ha 15774 kg/ha, and 24707 kg/ha, respectively. Per hectare gross returns of brinjal, country bean and cabbage were Tk.
483500, Tk. 347028 and Tk. 494140, respectively. Per hectare net returns of brinjal, country bean and cabbage were Tk. 242223, Tk. 184691, and Tk. 289988, respectively. It shows that cost of production per hectare was higher for brinjal than for cabbage and country bean. The study also shows that per hectare yield, gross returns, gross margin, net return and benefit cost ratio of cabbage were higher than those of country bean and brinjal. Therefore, it is clear that cabbage production was most profitable among the three crops.
Rahman et al. (2016) the objectives of this research study are to identify and measure the impact of the factors on brinjal production and to calculate the profit of brinjal production. Primary data collection was carried out at three villages of Islampur Upazila under Jamalpur district. Cobb-Douglas production function was applied to determine the effects of inputs on brinjal production. Human labor, seed cost, MP cost and pesticides have significant impact on brinjal production. The most
important factor for variation in costs as identified was human labor and chemical fertilizers cost. Net return and cash margin of brinjal production were BDT 303,358 and BDT 345,415 per ha, respectively while the profit per Kg was BDT 6.63.Thus, Brinjal is a highly profitable enterprise. This study also identified some problems faced by farmers for producing brinjal like insects affect, lack of capital, lack of quality seed, lack of storage facilities, marketing problems. Thus more research and extension service can be adopted to solve the problems in order to increase production and ensure the nutritional food value in Bangladesh.
M.R. Hasan (2016) this paper analyzed the profitability of brinjal cultivation in three districts namely Mymensingh, Rajshahi and Comilla of Bangladesh. Primary data were collected from brinjal farmers using pretested interview schedule during May- July, 2014. Farmer‟s production efficiency was analyzed through netfarm income and benefit cost ratio (BCR) considering variable cost and total cost of production. The results showed that total cost of brinjal was the highest in Mymensingh (Tk.
309,732/ha) compared to Rajshahi (Tk.285464/ha) and Comilla (Tk.301436/ha), while total revenue from brinjal cultivation was the highest in Comilla (Tk.
407,580/ha) compared to other districts. Again, net farm income was found highest in Comilla (Tk. 106,144/ha) district than other districts. Problem Confrontation Index (PCI) revealed that low prices of vegetables was the first ranked order problem and lack of capital ranked second in the study areas. Correlation analysis indicated that farmer‟s education, total family member, homestead area, vegetable cultivation area, no. of agricultural training, no. of extension contact, and farming experience were significantly and negatively correlated with problem confrontation. Department of Agricultural Extension (DAE) should provide hand-on training on diseases, insects and pests management for increasing production.
Noyon (2014) conducted a production and marking profitability of pesticide free vegetables (brinjal, wax, sponge gourd, cucumber and bitter gourd) initiated by PKSF in Dhaka. Per hectare yields of brinjal, wax, sponge gourd, cucumber and bitter gourd were 28880 kg, 35240 kg, 39124 kg, 36763 kg and 43414 kg respectively. Per hectare BCR of brinjal, wax, sponge gourd, cucumber and bitter gourd were 2.20, 1.86, 1.87, 1.85 and 1.95 respectively.
Rebeka et al. (2018) conducted in the upazila namly keraniganj of Dhaka, during 2015 to assess the profitability, resource use efficiency and factor affecting eggplant cultivation. Net return and cash margin of eggplant production were USDA 4780.9 and USDA 4968.8 per hetare respectively, while rate of return was 2.60. Thus, eggplant cultivation is highly profitable enterprise. In all cases, resources are underutilized, so there is more scope to utilize the resources more efficiently in case of eggplant production.
S. Khandoker et al. (2016) conducted in three vegetables growing districts namely Comilla, Jessore and Narshingdi during 2013-2014 to assess the profitability, resource use efficiency, factors affecting and problems of vegetables production.
Based on area, production and market priority, three winter vegetables such as radish, country bean and brinjal were selected of the study. Total cost of brinjal, country bean and radish production per hectare were Tk. 208101, Tk. 167757 and Tk. 130267, respectively. Per hectare average yield of brinjal, country bean and radish were 29.84 tonne, 16.96 tonne and 31.30 tonne, respectively. The net return of brinjal, country bean and radish were Tk. 179780, Tk. 69683 and Tk. 63944 per hectare, respectiv ely. The benefit cost ratio on full cost basis for brinjal, country bean and radish were 1.86, 1.42 and 1.50 respectively.
The above reviews indicate that a few studies have been conducted on financial profitability of brinjal cultivation. The present study aims to collect information on profitability of brinjal production. The result of present study would help researchers, respected farmers and policy makers in taking necessary steps for increasing brinjal production. Ultimately that will help increasing total production.
CHAPTER 3 METHODOLOGY
3.1
IntroductionImportance of the methods and procedure in conducting any research can hardly be over emphasized. Methodology enables the researcher to collect valid and reliable information and to analyze the same properly to arrive at correct decisions. Keeping this in view, the researcher took utmost care in using proper methods in all the aspects of this investigation. The methods and procedures followed in this study have been described in this chapter.
3.2
Selection of the Study AreaThe study area was selected on the basis of objectives of the research. Gazipur district was selected for the present study. Primary data were collected from three upazila namely Sreepur upazila, Kapasia upazila and Kaliakair upazila. The main reasons for selecting the study area were as follows:
I. Availability of large number of brinjal farmers in the study area.
II. Easy accessibility and good communication facilities in those area.
III. This type of study was not done previously in the study area.
IV. The areas are easily accessible.
V. All the mentioned areas fall in the same agro ecological zone.
3.3
Preparation of Survey ScheduleThe survey schedule was designed in accordance with the objectives of the study. The draft was made which included various questions that should be asked. Before taking actual interview draft schedule was pre-tested by interviewing some brinjal farmers.
Improvement and modification were done based on the experience of pretesting interview. This will help the researcher to get more information regarding brinjal farmers. For this study, survey method is followed to collect data. It is very important in any survey to prepare a survey schedule. Keeping in mind the objective of the survey, preliminary survey schedule are designed for collection of data from the
selected brinjal producers. After preparing a draft schedule, one type of survey schedules is used for producers. The pretest is conducted for the following methods:
I. To test suitability of the survey schedule;
II. To test and verify coverage of items of the schedule;
III. To identify the questions which respondents formed efficient to answer;
3.4
Selection of Sample and Sampling TechniqueDue to limitation of time and funds, it is impossible to make a survey covering whole area. For this reason, sampling was done to minimize the cost and time. A total of 90 farmers had been selected purposivly from three upazila. Each upazila represents 30 respondents for this study. Data were collected by the researcher herself using a prepared interview schedule. Face to face interview was done to collect information from farmers.
3.5
Data Collection PeriodThe study was mainly based on primary data collected through face to face interview during the month of June to August 2019. Data was collected through interview by using questionnaire. Data was collected field level cross-sectional data using pre-tested interview schedule. Necessary inform action regarding this study was collected based on input costs, price, yields etc.
3.6
Method of Data CollectionThere are different methods of collecting information from the respondents. In the present study, face to face interview was designed because this type of interview is more appropriate than others. Before taking actual interviews the whole purpose of the study was explained to the sample farmers. During the interview if farmers did not get any questions, researcher explained the question in an easier way. In order to reduce the error, data were collected in local unit but later those units were converted into standard international units.
3.7 Analytical Technique
The collected data were analyzed with the purpose of achieving the objectives of the study. The following two techniques of analysis were used.
1) Tabular analysis 2) Functional analysis 3.7.1 Tabular Analysis
Tabular technique is generally used to find out the variation between variables. It was applied to classify data in order to get meaningful result by using statistical measures like sum, means, percentage etc. Different costs, gross margin and net profit were calculated in tabular form. In this study data were mostly presented in tabular form because of its simple and convenient characteristics.
Profitability Analysis
Eight variables such as cost of hired labor, cost of seedling, cost of land preparation, cost of manure, cost of chemical fertilizers, cost of irrigation, cost of pesticide and cost of others (Bamboo stick) in producing brinjal was considered for profitability analysis as well as Cobb-Douglas production function. Profit function of the following algebraic from was used in this study,
𝑃𝑟𝑜𝑓𝑖𝑡 𝜋 = (𝑃𝑦𝑖 .
𝑛
𝑖=1
𝑌𝑖) − (𝑃𝑥𝑖.
𝑛
𝑖=1
𝑋𝑖) − 𝑇𝐹𝐶 Where,
Π = Net Return
Pyi= Price per unit of the ith produce Yi = Quantity of the ith produce Pxi= Price per unit of the ith inputs Xi = Quantity of the ith inputs TFC= Total Fixed Cost
3.7.2 Functional Analysis
To learn more about the relationship between output and input, Cobb-Douglas production function was used. It is chosen to estimate the effects of key variables on production process of brinjal. In this study seven independent variables were hypothesized to explain the production of brinjal. On the other hand, gross rueturn hectare was considered as the dependent variable.
The specification of the Cobb-Douglas production function model was as follows:
Y = a X
1b1X
2b2X
3b3X
4b4X
5b5X
6b6X
7b7e
uiThe empirical production function was the following:
lnY = ln a+ b1 lnX1 + b2 lnX2 + b3 lnX3 + b4 lnX4 + b5 lnX5 + b6 lnX6 + b7 lnX7 + + ui
Where,
Y = Gross return
X1= Hired labor cost (Tk./ha) X2= Seedling cost (Tk./ha)
X3= Land preparation cost (Tk./ha) X4= Manure cost (Tk./ha)
X5= Chemical fertilizer cost (Tk./ha) X6= Irrigation cost (Tk./ha)
X7= Pesticide cost (Tk./ha) a = Intercept
b
1, b
2, b
3…………b
7= Coefficients of the respective input
u
i= Error term
3.8
Procedure of Estimating IndicatorsThe average wage of family labor was taken as the opportunity cost of the human labor. In the study areas, the cost of human labor were estimated by multiplying wage rate with recorded man-day/ha.
3.8.1 Cost of Human Labor
Human labor is an important input in producing agricultural product. In this study human labor was measured in terms of man-days and eight hours of work were equivalent to one man-day.
1 adult man = 1.4 adult woman
The average wage of family labor was taken as the opportunity cost of the human labor. In the study areas, the cost of human labor were estimated by multiplying wage rate with recorded man-day/ha.
3.8.2 Cost of Land Preparation
Land preparation is one of the most important components in agricultural production process. Land preparation for brinjal requires ploughing, laddering to make soil suitable for planting seedling. The number of ploughing varies from plot to plot. In the study areas, most of the time they ploughed land for 4 times.
3.8.3 Cost of Seedling
In the study area, most of the farmers used purchased seedling for brinjal production.
Some of the farmers used home supplied seedling as well. Cost of seedling varied depending on its quality and availability. The cost of purchased seedling was calculated based on the actual price paid by the farmers. The cost of home supplied seedling was estimated at the prevailing market price.
3.8.4 Cost of Manure
For the higher production, most of the farmers used manure. They used these kinds of fertilizer for higher yield. The cost of manure was estimated at present market prices during the survey.
3.8.5 Cost of Chemical Fertilizers
For the higher growth rate of brinjal production, most of the farmers used different kinds of chemical fertilizers. These chemical fertilizers are Urea, TSP, Mop, Gypsum
and Boron etc. The cost of these chemical fertilizers was estimated at present market prices during the survey.
3.8.6 Cost of Irrigation
Irrigation is the most important input for brinjal production. In the study area, shallow tube- well, river, ponds etc. were used as sources of irrigation. Cost of irrigation varies from farmers to farmers. It was calculated based on how many times irrigation needed per hectare and how was its cost.
3.8.7 Cost of Pesticides
Farmers used many types of pesticides for 2-3 times in a month to keep their crop free from pests and diseases. Cost of pesticides was calculated based on the market price which was applied in the field per hectare.
3.8.8 Cost of Others (Bamboo Stick)
Farmers need the bamboo stick for brinjal production. Cost of these bamboo stick was calculated by using market price during the survey.
3.8.9 Interest on Operating Capital
Interest on operating capital was determined on the basis of opportunity cost principles. It was calculated by taking all the cost incurred throughout the production period at the rate of 5.5% per annum for six months. Following formula was used:
IOC = AIit Where,
IOC = Interest on operating capital AI = Total investment/2
i = Interest rate
t = Total time period of a cycle
3.8.10 Cost of Land Use
In the study area the cost of land was different to plots depending on location, topography and fertility of the lands. It also varies from one season to another i.e., from kharif to robi season and from crop to crop. Land use cost was estimated on the basis of opportunity cost of the use of land per hectare for six months during the production period. That’s why cash rental value of land had been used for estimating cost of land use. Land use cost may be calculated by using one of the following concepts:
Interest on the value of land
Rental value of land
Forgoing income from the alternative use
3.8.11 Gross Return
Per hectare gross return was estimated by multiplying the total amount of product and by- product by their respective per unit prices.
Gross Return = Quantity of the product* average price of the product
3.8.12 Gross Margin
Gross margin is the difference between gross return and variable costs. Generally gross margin was calculated on total variable cost (TVC) basis. Per hectare gross margin was obtained by subtracting variable cost from gross return. That is,
Gross Margin = Gross Return – Total Variable Cost 3.8.13 Net Return
Net return was estimated by deducting the total fixed cost from the total return.
Net Return = Gross Return – Total Fixed Cost
3.8.14 Benefit Cost Ratio (BCR)
BCR is used to compare benefit per unit of cost. The BCR (undiscounted) is the ratio of gross return to total cost. The BCR (undiscounted) was calculated by using
following formula:
𝐵𝐶𝑅 =𝐺𝑟𝑜𝑠𝑠 𝑅𝑒𝑡𝑢𝑟𝑛 𝑇𝑜𝑡𝑎𝑙 𝐶𝑜𝑠𝑡
3.8.15 Measurement of Resources Use Efficiency
Farmers can get maximum profit up to the point where value of added product is greater than the cost of the added resources in producing it. When marginal physical product is measured in monetary terms (MPP* product price), it is called marginal value product. Marginal factor cost (MFC) is the price of one unit of output. In order to test the efficiency of resource allocation, the ratio of MVP to MFC for each input is considered to 1 which can be written by following:
𝑀𝑉𝑃 𝑀𝐹𝐶 = 1
The resources are considered to be efficiently used when the ratio of MVP to MFC is one. If the ratio is greater than 1, yield can be increased by using more resources and if the ratio is less than 1, the resources are overused which will minimize the profit.
𝑀𝑉𝑃(𝑋𝑖) = 𝑏𝑖 𝑌(𝐺𝑀) 𝑋𝑖 (𝐺𝑀)
Where,
bi = Regression coefficient per resources Y = Mean value (GM) of gross return Xi = Mean value (GM) of inputs
CHAPTER 4
DESCRIPTION OF THE STUDY AREA
4.1
IntroductionThis chapter presents a brief description of the salient feature of the study areas. To know the overall features of the study area, a short description has been presented in this chapter. It is necessary to know the agricultural activities, possible development opportunities and potentials of the study area. This will help the agricultural organization to make appropriate decision regarding various agro- related activities.
Location, population and households, physical features, topography, literacy rate, educational facilities, cropping pattern, climate, temperature etc. are discussed below.
4.2
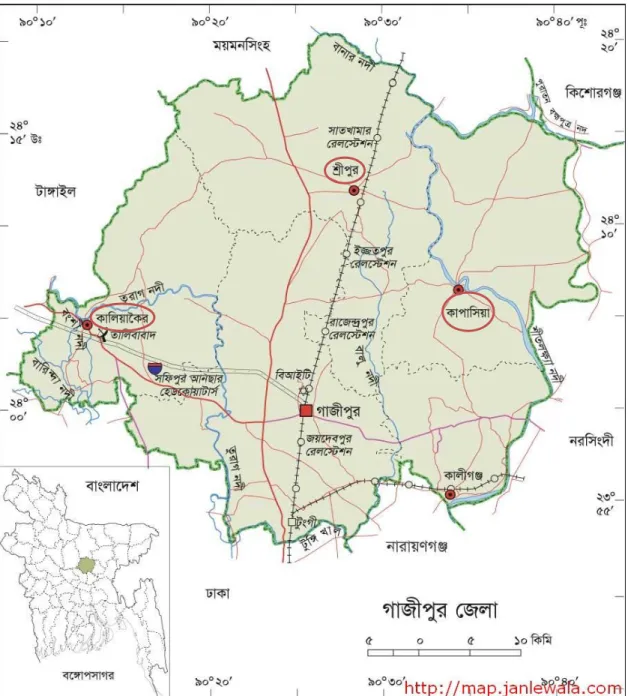
LocationThe selected farmers in the present study are from Gazipur district. Area of Gazipur district is 1741.53 sq km, located in between 23°53' and 24°21' north latitudes and in between 90°09' and 92°39' east longitudes. Three upazila namely Sreepur, Kapasia and Kaliakair are selected for this study. The area of the above upazilas is 465.24 sq km, 356.98 sq km and 314.14 sq km respectively. These upazilas are mostly bounded by each other.
Gazipur district is bounded by Mymensingh and Kishorganj districts on the north, Dhaka, Narayanganj and Narsingdi districts on the south, Narsingdi district on the east, Dhaka and Tangail distruicts on the west. The locations of the upazilas are presented in the following Map region.
Figure 4.1: Map of gazipur zila Source: Banglapedia, (2019)
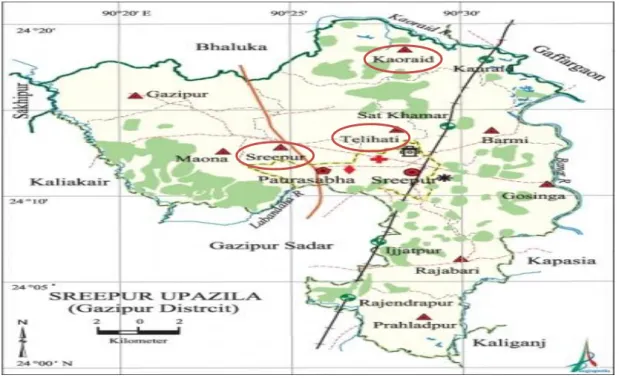
Figure 4.2: Map of sreepur upazila Source: Banglapedia, (2019)
Figure 4.3: Map of kapasia upazila Source: Banglapedia, (2019)
Figure 4.4: Map of Kaliakair Upazila Source: Banglapedia, (2019)
4.3
Administrative AreaGazipur Zila consists of five upazilas (Gazipur sadar, Sreepur, Kapasia, Kaliakair and Kaliganj), 3 paurashava, 46 unions, 4 municipility, 710 mouza and 1163 village (BBS 2018). There are also 7 police stations here, which are: Gazipur highway, Joydebpur, Sreepur, Kapasia, Kaliakair, Kaliganj and Tongi.
Table 4.1 Area, Union, Municipality, Village, Mahalla & Mauza of Gazipur District
Area(Sq.km) No. of union No of municipality No fo village No. of mouza
1741.43 46 4 1163 710
Source: BBS (2018)
4.4
Physical Features, Topography and Soil ConditionsGazipur district is in Medium Ganges River Floodplain. The region comprises the eastern half of the Ganges River Flood Plain which is low-lying. Soils of the region are silt loams and silty clay loams on the ridges and silty clay loams to heavy clays on lower sites. Organic matter content is low in ridges but moderate in the basins. Soils
are calcareous in nature and general fertility level is medium. Soil of the study area is very fertile as a result various types of crops are cultivated.
Table 4.2 Land Topography in Survey Area
Study Area
Land Type
High Land Medium High Land
Medium Low Land
Low Land
Very Low Land
Total
Gazipur 147886 46089 63481 48800 2905 309161
Source: BBS (2018)
4.5
PopulationThe Gazipur district has total population of 3,403,912 (BBS 2018) with density of population 2505/Km2 (5,100/sq mi).Population and density of population of the study areas are presented in table 4.3. Average household size of the district is 4.96, male 52.52 and female 47.48 percent. The number of household in this district is 122140 and density of population is 2505/km2. Male and female proportion was 1.11 in the respective areas.
Table 4.3 Population, No of household, Male–Female Ratio of Gazipur Upazilla Population No of
household
Population density/sq.km
Household size
Male (%)
Female (%)
Male female ratio
3403912 255831 2505 4.96 52.52 47.48 1.11
Source: BBS (2018)
4.6
Climate, temperature and RainfallAgricultural production depends mostly on the environment of the region. Climate, temperature and rainfall are important factors for any crops production. Maximum temperature of the study area varies from 23.4 to 35.6 0C and minimum temperature of the study area is from 12.2 to 14.8 0C. From Table 4.5 we can see that annual rainfall is decreasing over the passage of time.
Table 4.4 Average Maximum and Minimum Temperature (0C) in Selected Station
Name of 2015 2016 2017
Station
Max. Min. Max
.
Min. Max. Min.
Gazipur 35.6 14.8 35.0 12.8 23.4 12.2
Source: BBS (2018)
Table 4.5 Annual Rainfalls (in Millimeter) in Selected Station Name of
Station
Year
2014 2015 2016 2017
Gazipur 2197 1912 1181 1777
Source: BBS (2018)
4.7
Land and AgricultureTotal cultivable land of Gazipur district is 308518 hectares (BBS 2011). Brinjal is mostly grown spices in this study area. Paddy, jute, garlic, oil seed, wheat etc are some major crops in this area. Many different cropping patterns are seen in different region of Gazipur.
Table 4.6 Land Distribution under Different Cropping Pattern
Cropping pattern Single crop Double crop Treble crop Net crop
Percentage of land 58.57 13.72 4.67 76.96
Source: BBS (2011)
4.8
EducationGazipur district the literacy and educational average literacy is 56.4 percent, male 60.5 percent, female 51.9 percent. Educational institute: university 5, college 45, technical 733, secondary school 276, primary school 733, community school 52, NGO operated school 11 and madrasa 181 (BBS, 2018).
4.9
OccupationThe economy of Gazipur is predominantly agricultural. The major occupation of the present study area is agriculture, non-agricultural laborer, service holder, industrial laborer and others. Average wage rate varies in different areas. Occupational status of different upazilas are presented in Table 4.7.
Table 4.7 Occupational level in the study areas Name of
Upazila
Agriculture Non- agriculture
Construction Service Commerce Others
Sreepur 57.46 2.65 2.89 15.41 10.85 10.74
Kapasia 58.98 2.80 1.74 14.91 11.49 10.08
Kaliakair 50.79 2.33 2.74 17.68 10.41 11.05
Source: BBS (2018)
4.10
Communication, Transportation and Marketing FacilitiesTransportation and communication plays a vital role in overall development of a country. Without good transportation system, it is hardly possible to supply goods and other products in urban and city areas in time. At present day’s transportation and communication systems are in good condition in the study areas than before. Most of the roads are concreted and some of them are muddy. Different types of vehicles are also available in those areas. Markets are also available which make farmers receive good prices for their produced.
4.11
Non-Government OrganizationsAt present a number of non-government organizations (NGOs) such as Grameen Bank, BRAC and ASA etc. are available in the study area. They operate their activities for the betterment of the people and the poor farmers in particular.
CHAPTER 5
SOCIOECONOMIC CHARACTERISTICS OF THE BRINJAL FARMERS
5.1 Introduction
This chapter provides a brief description of the socio-economic characteristics of brinjal cultivation in the study area. Decision making behavior of an individual is determined to a large extent by his socio-economic characteristics. The socioeconomic ten characteristics considered in the present study were age, education, occupation, farming experience, family type, family size, male female ratio, farm size, sources of family income and family expenditure etc.
5.2
Age
Distribution of Brinjal FarmersAge distribution of farm owners is very important in maintaining profitable operation of a farm business. The selected brinjal farmers were grouped into three categories according to their ages. The different age groups of farm owners are presented in Table 5.1. The age of the selected brinjal farmers was observed to be ranging from a minimum of 25 to a maximum of 60 years.
Table 5.1 Age distribution of brinjal farmers Age
Percentage of Respondents
Sreepur Kapasia Kaliakair
Young(up to 35) 13.33 26.67 16.66
Middle(36-50) 53.34 56.67 56.67
Old(>50) 33.33 16.66 26.67
Source: Field survey, (2019
In the case of age distribution, in sreepur upazila young, middle and old age farmers accounted for 13.33 percent, 53.34 percent and 33.33 percent, in kapasia upazila young middle and old age farmers accounted for 26.67 percent, 56.67 percent and 16.66 percent, in kaliakair upazila young middle and old age farmers accounted for 16.66 percent 56.67 percent and 26.67 percent, respectively (Table 5.1).
5.3 Educational Level of Brinjal Farmers
Education plays an important role for a farm owner and helps a farmer to have day-to- day information about the existing modern techniques together with changes in various management practices. It enables a man capable of managing scare resources and hence to earn maximum profit. To examine the educational level of the brinjal farmers, education were classified into six categories such as illiterate/can sign only, P.S.C,
Table 5.2 Educational level of the owners of brinjal farmers Educational
Level
Percentage of Respondents
Sreepur Kapasia Kaliakair
Illiterate
<