FINANCIAL PROFITABILITY AND RESOURCE USE EFFICIENCY OF AROMATIC RICE PRODUCTION IN SOME SELECTED AREAS OF DINAJPUR DISTRICT
NUSHRAT JAHAN
DEPARTMENT OF AGRICULTURAL ECONOMICS
SHER-E-BANGLA AGRICULTURAL UNIVERSITY SHER-E-BANGLA NAGAR, DHAKA-1207
DECEMBER, 2018
FINANCIAL PROFITABILITY AND RESOURCE USE EFFICIENCY OF AROMATIC RICE PRODUCTION IN SOME SELECTED AREAS OF DINAJPUR DISTRICT
BY
NUSHRAT JAHAN Reg. No. : 12-04754
A Thesis
Submitted to the Faculty of Agribusiness Management, Sher-e-Bangla Agricultural University, Dhaka,
in Partial fulfillment of the requirements for the degree of
MASTER OF SCIENCE (MS) IN
AGRICULTURAL ECONOMICS SEMESTER: JULY-DECEMBER, 2018
A
pproved by………
(Professor Gazi M. A. Jalil) Chairman
Examination Committee
Department of Agricultural Economics
Sher-e-Bangla Agricultural University, Dhaka -1207
………
(Rezoyana Kabir Rasha) Assistant Professor Dept. of Agricultural Economics Sher-e-Bangla Agricultural University, Supervisor
Dhaka -1207
……….……….…
(Dr. Bazlul A.A. Mustafi) Former Director, BRRI
Co-Supervisor
DEPARTMENT OF AGRICULTURAL ECONOMICS Sher-Bangla Agricultural University
Sher-e-Bangla Nagar, Dhaka-1207, Bangladesh
CERTIFICATE
This is to certify that the thesis entitled “FINANCIAL PROFITABILITY AND RESOURCE USE EFFICIENCY OF AROMATIC RICE PRODUCTION IN SOME SELECTED AREAS OF DINAJPUR DISTRICT” submitted to the department of Agricultural Economics, Faculty of Agribusiness Management, Sher-e- Bangla Agricultural University, Sher-e-Bangla Nagar, Dhaka in partial fulfilment of the requirements for the degree of Master of Science (MS) in Agricultural Economics, embodies the result of a piece of bona fide research work carried out by NUSHRAT JAHAN, Registration No: 12-04754 under my supervision and guidance. No part of the thesis has been submitted for any other degree or diploma.
I further certify that any help or source of information, as has been availed of during the course of this investigation has been duly acknowledged by the Author.
Dated: 1 December, 2018 Dhaka, Bangladesh
.………
(Rezoyana Kabir Rasha) Assistant Professor
Department of Agricultural Economics Sher-e-Bangla Agricultural University
Sher-e-Bangla Nagar, Dhaka-1207 Supervisor
FINANCIAL PROFITABILITY AND RESOURCE USE EFFICIENCY OF AROMATIC RICE PRODUCTION IN SOME SELECTED AREAS OF DINAJPUR DISTRICT
ABSTRACT
The study was conducted to examine the profitability and resource use efficiency of aromatic rice production in some selected areas of Dinajpur district in Bangladesh.
Besides, attempt had given to examine the profitability of aromatic production by the farmers in the study area, to identify the factors behind the yield variations of aromatic rice production in the study area,to assess the resource-use efficiency of aromatic rice production and to find out the problems faced by the farmers and to recommend some policy guidelines. Dinajpur district was selected purposively for the study on the basis of extensive aromatic rice production. A total of 101 aromatic rice cultivators were randomly selected to conducting farm level survey with pre-tested questionnaire. After analysing the data, per hectare gross return, net return and gross margin were found to be Tk. 203570, Tk. 51606 and Tk. 93906 respectively. Total cost of aromatic rice production was calculated at Tk. 148464 per hectare.Benefit Cost Ratio (BCR) was found 1.37. Thus, it was found that aromatic rice production was highly profitable. From Cobb-Douglas production function analysis, it was observed that the coefficients of cost of human labor, cost of seed, cost of urea, gypsum, cost of pesticide and Cost of irrigation were positively significant at different level of probability for aromatic rice production. But the coefficients of cost of animal labor & power, cost of manure, cost of TSP, cost of MoP and Zinc sulphate cost was not significant. Resource use efficiency indicated that all of the resources were under used for aromatic rice production except overutilization of human labour cost and TSP cost. So there was a positive effect of key factors in the production process of aromatic rice production. Low yield and unstable price was most acute problem for aromatic rice production followed by high price and spot scarcity of fertilizers and pest and disease infestation.
ACKNOWLEDGEMENT
Alhamdulillah, all praises are due to the almighty Allah for His gracious kindness and infinite mercy in all the endeavours which create that opportunity for the author to successfully complete the research work required for the partial fulfilment of the degree of Master of Science.
The author would like to express her heartfelt gratitude and sincere appreciations to her Supervisor Assistant Professor
,
Rezoyana Kabir Rasha Department of Agricultural Economics, Sher-e-Bangla Agricultural University, Dhaka, for her valuable guidance, advice, encouragement and support throughout the study. Likewise grateful appreciation is conveyed to her Co-supervisor Dr. Bazlul A. A. Mustafi, Former Director Of BRRI, for his constant encouragement, constructive criticisms and valuable advice to complete the thesis.The author express her sincere respect to Gazi M. A. Jalil, Professor and Chairman, Department of Agricultural Economics, Sher-e-Bangla Agricultural University, Dhaka for providing valuable advice and sympathetic consideration regarding to the research.
The author is deeply indebted and grateful to her Parents and siblings who continuously prayed for her success and without their love, affection, inspiration and sacrifice this work would not have been completed.
December, 2018 The Author
LIST OF CONTENTS
CHAPTER TITLE PAGE
ABSTRACT I
ACKNOWLEDGEMENT Ii
LIST OF CONTENTS iii-v
LIST OF TABLES Vi
LIST OF FIGURES Vi
ABBREVIATIONS Vii
CHAPTER I INTRODUCTION 1-3
1.1 Background of the Study 1
1.2 Importance of Rice in the Economy of Bangladesh 2
1.3 Objectives 3
1.4 Justification of the Study 3
CHAPTER II REVIEW OF LITERATURE 4—11
2.1 Introduction 4
2.2 Rice Production Related Studies 4
CHAPTER III METHODOLOGY 12-23
3.1 Introduction 13
3.2 Selection of the Study Area 13
3.3 Sampling Techniques and Data Collection Procedure 13
3.4 Sampling technique 13
3.5 Preparation of the interview schedule 15
3.6 Study and Survey Period 15
3.7 Method of Data Collection 15
3.8 Problems Faced by the Researcher in Data Collection 16
3.9 Analytical Techniques 16
3.10 Descriptive Analysis 16
3.11 Statistical Analysis 17
3.12 Procedure of Computation of Costs 18
3.12.1 Cost of Human Labor 18
3.12.2 Cost of ploughing and laddering 19
3.12.3 Cost of Seeds 19
3.12.4 Cost of Cow dung or Manure 19
3.12.5 Cost of Fertilizer 19
3.12.6 Cost of Insecticide 19
3.12.7 Cost of Irrigation 20
3.12.8 Interest on operating capital 20
3.12.9 Land use cost 20
3.13 Measurement of Resource Use Efficiency of Aromatic
Rice Production 20-21
3.13 Profitability Analysis 22
3.13.1 Calculation of Gross Return 22
3.13.2 Calculation of Gross Margin 22
3.13.3 Calculation of Net Return 22
3.13.4 Undiscounted Benefit Cost Ratio (BCR) 23 CHAPTER IV
SOCIO-DEMOGRAPHIC PROFILE OF
AROMATIC RICE PRODUCTION FARMERS 24-28
4.1 Introduction 24
4.2 Selected Characteristics of the Aromatic Rice Farmers 24
4.2.1 Age distribution of the farmers 24
4.2.2 Education status of the farmers 25
4.2.3 Family size of the farmers 25
4.2.4 Farm size of the farmers 26
4.2.5 Land under aromatic rice cultivation 27
4.2.6 Annual family income 27
4.2.7 Training exposure 28
4.2.8 Organizational participation 28
CHAPTER V ECONOMIC ANALYSIS OF AROMATIC RICE
PRODUCTION 29-33
5.1 Introduction 29
5.2 Profitability of Aromatic Rice Production 29
5.3 Estimation of Costs 29
5.3.1 Cost of animal labor & power 29
5.3.2 Cost of human labor 30
5.3.3 Cost of seed 30
5.3.4 Cost of manure 30
5.3.5 Cost of fertilizer 30
5.3.6 Cost of pesticides 31
5.3.7 Cost of irrigation 31
5.3.8 Total variables cost 31
5.3.9 Interest on operating capital 31
5.3.10 Land use cost 32
5.3.11 Total cost 32
5.4 Return of Aromatic Rice Production 32
5.4.1 Gross Return 32
5.4.2 Gross Margin 33
5.4.3 Net Return 33
5.4.4 Benefit Cost Ratio (Undiscounted) 33
5.5 Concluding remarks 33
CHAPTER VI
FACTORS AEFFECTING AND RESOURCE USE EFFICIENCY OF AROMATIC RICE
PRODUCTION
34-42
6.1 Introduction 34
6.2 Factors Affecting Production of Aromatic Rice 34
6.3 Method of Estimation 34
6.4 Interpretation of Results 35
6.4.1 Aromatic rice production farmer 36
6.5 Resource Use Efficiency of Aromatic Rice Production 39
6.6 Concluding remarks 41-42
CHAPTER VII PROBLEM OF AROMATIC RICE PRODUCTION
43-45
7.1 Introduction 43
7.2 Suggested solutions 45
CHAPTER VIII SUMMARY, CONCLUSION AND
RECOMMENDATIONS 46-49
8.1 Summary 46
8.2 Conclusion 48
8.3 Policy Recommendations 49
REFERENCES 50-57
LIST OF TABLES
TABLE TITLE PAGE
3.1. List of villages with sample size 15
4.1 The salient features of the selected characteristics of the
Farmers 24
4.2 Distribution of the farmers according to their age 25 4.3 Distribution of the farmers according to their education 25 4.4 Distribution of the farmers according to their family size 26 4.5 Distribution of the farmers according to their farm size 26 4.6 Distribution of the farmers according to their aromatic rice
cultivation land 27
4.7 Distribution of the farmers according to their annual family
Income 27
4.8 Distribution of the farmers according to training exposure 28 4.9 Distribution of the farmers according to organizational
Participation 28
5.1 Per hectare cost of aromatic rice production 32 5.2 Per hectare cost and return of aromatic rice production 33 6.1 Estimated values of coefficients and related statistics of
Cobb- Douglas production function 38
6.2 Estimated resource use efficiency of aromatic rice production 40 7.1 Problem faced by the farmers in producing aromatic rice
Production 44
7.2 Farmers suggestions to overcome problem/constraints 45 LIST OF FIGURES
FIGURE TITLE PAGE
3.1 Map of Dinajpur district showing Kaharole upazila 13 3.2 Map of Kaharole upazila showing the study area 14
ABBREVIATIONS DAE Department of Agricultural Extension BRRI Bangladesh Rice Research Institute
GDP Gross Domestic Product
FAO Food and Agricultural Organization
GM Geometric Mean
BBS Bangladesh Bureau of Statistics
SPSS Statistical Package For Social Sciences
BCR Benefit Cost Ratio
NGOs Non-Governmental Organizations
MVP Marginal Value Product
MFC Marginal Factor Cost
MPP Marginal Physical Product
TC Total Cost
GR Gross Returns
TVC Total Variable Costs
GOs Government Organizations
FC Fixed Cost
TFC Total Fixed Cost
DTW Ministry of Agriculture and Rural Development
HYV High Yielding Variety
MT Metric Tons
BER Budget Execution Report
DRC Domestic Resource Cost
SRI System of Rice Intensification
MoP Murate of Potash
TSP Triple Super Phosphate
LUC Land Use Cost
CHAPTER I INTRODUCTION
1.1 Background of the Study
Bangladesh is predominantly an agricultural country where agriculture sector plays a vital role in accelerating the economic growth. It is therefore important to have a profitable, sustainable and environment-friendly agricultural system in order to ensure long-term food security for people. Broad agriculture sector has been given the highest priority in order to make Bangladesh self-sufficient in food. The Government determined to develop the overall agriculture sector keeping in view of the goals set out in the Seventh Five Year Plan and National Agriculture Policy. Agriculture sector plays an important role in overall economic development of Bangladesh (BER, 2017). The agricultural sector (crops, animal farming, forests and fishing) contributes 14.23 percent to the country‟s GDP, provides employment about 40.6 percent of the labor force according to Fiscal Year 2018. Moreover, agriculture is the source of wide range of consumer demanded agricultural commodity markets, especially in rural areas (BER, 2017).In FY2016-17 food grains production stood at 388.14 lakh MT of which Aus accounted for 21.33 lakh MT, Aman 136.56 lakh MT, Aromatic 180.24 lakh MT (BER, 2017).In northern region 2017 has seen that 13,017 hectares of land brought under cultivation of aromatic rice to 12,650 hectares last year. Total production in northern area was 39626 tons while it was 29727 tons last year. In this season 13,779 hectares across the northern region devoted to aromatic rice strains, this is an increase of 762 hectares from the previous season. Rice grain is categorized into coarse, medium and fine with different colors based on physical properties. In Bangladesh, a number of fine rice cultivars are grown by the farmers. Some of them have special appeal for their aroma. Such common cultivars are Chinisagar, Basmati, Badshabhog, BRRI dhan34, Kalizira, Tulsimla, Dulabhog, BRRI dhan37 and BRRI dhan38. Fine rice is mainly used by the people in the preparation of palatable dishes and sold at a higher price in the market due to its special appeal for aroma and acceptability. Bangladesh has bright prospect for export of these fine rice thereby earning foreign exchange.
The majority of the population is poor and has been suffering from malnutrition and cannot afford balanced diet. They have to meet their protein requirement by taking cereals like rice, wheat etc. Rice provides the major portion of protein and calories of daily requirement. The economy of Bangladesh mainly depends on agriculture, which contributes 22 percent total
gross domestic product and it is dominated by the crop sector, which contributed 14.10 percent of total GDP (BBS, 2019). In the recent years, the share of agriculture in GDP showed a declining trend, however, the share of food grains, particularly rice had increased over time due to HYV and hybrid seed, proper management, fertilizer, irrigation facilities and other relevant technologies. Considering the above facts, it is evident that rice has an inevitable role in the food grains production of Bangladesh.
1. 2 Importance of Rice in the Economy of Bangladesh
Rice is the principal staple food and lifeline in Bangladesh. More than 5 percent of the world's rice is produced over here, providing the country‟s 160 million people more than 75.6 percent of their total calories and 54 percent of protein in the average diet of the people.
It occupies about 73.39 percent of total cropped area and constitutes about 72 percent of the agricultural production (BBS, 2019).
Bangladesh has a land area of 1.76 million hectares. With a cropping intensity of 192percent and the total cropped area comes to approximately 13.69 million hectares (BBS, 2019). Rice is grown in Bangladesh in the three seasons, namely Aus,Aman and Boro. Aman rice is considered as most important in the economy of Bangladesh particularly for solving the chronic food deficiency of the country (Kabir, 2000). Total cultivated area under rice is 11.20 million hectares and total production is 43.50 million metric tons (FAO, 2007).
Bangladesh ranks fourth among rice producing countries in the world after China, India, and Indonesia, although USA occupies the highest position in respect of rice yield 7.70 ton/ha.
In the past, the country largely depended on imported food grains with its deficit production, mainly due to rising of population. However, now-a-days the population growth rate (1.36) runs behind the growth rate of food grains which was found to increase at the rate of 15.86 percent during last decade (BER, 2018). Due to the introduction of seed-fertilizer-irrigation technologies in Bangladesh agriculture, food grains production has almost been triple since independence.
1.3 Objectives
1. To identify the socio-economic status of aromatic rice producing farmers.
2. To measure the profitability of aromatic rice production by the farmers in the study area.
3. To assess the resource-use efficiency of aromatic rice production.
4. To find out the problems faced by the farmers and recommend some policy guidelines.
1.5 Justification of the Study
Rice is the staple food in the everyday diet of Bangladeshis. The government of Bangladesh is consistently pursuing policies to attain food self-sufficiency and also to improve the farmer economic condition. Aromatic rice is also constitutes a n important part of this dietary requirements of the Bangladeshi people. Aromatic rice cultivation plays a vital role on changing our farmer‟s living condition in the northern region of Bangladesh and achieves self-sufficiency in income.Most countries in the Asian rice belt have become self-sufficient in rice production and some have exportable surpluses. This study will be conducted in the northern region (Dinajpur district) of Bangladesh. The region is very important for aromatic rice production and most of the people are involved with the aromatic rice cultivation. So it is important to observe the socio-economic condition in those areas. Availability of rice varieties with multiple resistance reduced the need for application of agrochemicals and facilitated the adoption of integrated pest management practices. The management practices and input use are likely to be influenced by socio-economic factors such as farmer‟s age, education, occupation, resource base and access to information. This type of study on aromatic rice production focused on mainly resource use efficiency, socio-demographic profile of the respondent, profitability of aromatic rice production were not conducted before in these study areas.
In order to increase the production of aromatic rice to the maximum possible extent, it was necessary to identify the factors behind the yield variations so that policy interventions might be made accordingly. So, this study will be helpful in identifying the factors responsible for yield variations. This study provides appropriate suggestion and policy recommendations which will help the policy makers of the country for improving the livelihood of the people in the northern region (Dinajpur district).
CHAPTER II
REVIEW OF LITERATURE
2.1 Introduction
The purpose of this chapter is to provide a selective review of the past research works which are pertinent to the present study. The available literature germane to "Comparative Profitability and Technical Efficiency of Aromatic Rice Production in Dinajpur District"
was so scanty. However, relevant findings directly or indirectly related to this study are briefly described below:
2.2 Rice Production Related Studies
Mondal et al. (1995) explained resources use efficiency of irrigated Aromatic rice cultivation in their study entitled "Resource Use Efficiency of Irrigated Aromatic rice Cultivation by Different Farm Size Groups and its Impact on Employment and Distribution of Income in DTW II Project Area of Mymensingh". The results of their study revealed that only the small farms were allocatively efficient in cost of human labor, both small and medium farms were able to allocate draft power more or less efficiently and fertilizer was underused for Aromatic rice cultivation. Therefore, they concluded that no farm was found to be allocatively and thereby economically efficient in using input for Aromatic rice cultivation in the study area.
Kamruzzaman et al.(1995) shows the growth rates, technical change in agriculture and factor demand status of the rice sector of Bangladesh. The growth of production, acreage and yield of local. HYV and total rice were positive and significant during the pre-independence period. During the post-independence period the growth of local acreage and production were native but the yield was positive. In the period of the study(1980-81 to 1992-93) the elasticity co-efficient started declining implying that the farmers of Bangladesh become more conscious about the use of fertilizer, seed and irrigation in agriculture.
Ali and Saif (1996) conducted a study on," Costs and Returns of Aromatic Paddy with Reference to Resource Use in an Area of Mymensingh District in Bangladesh". The study identified some problems faced by the farmers for producing and marketing of Aromatic paddy. Small farmers were found to face acute problems with regard to fertilizers
and institutional credit. Problems of marketing system included the efficiency of the government procurement programme and unsatisfactory condition of the rural markets.
Islam et al.(1996) made a study on "Socio-Economic Aspects of Fine Quality Rice Cultivation in Bangladesh." They found that under irrigated ecosystem the grain yield of course, fine and aromatic rice were 3.00, 2.48 and 1.9 0 ton/ha, respectively. On the other hand, the yields of course, fine and aromatic rice were 2.72, 2.20 and 2.00 ton/ha respectively, under rainfed ecosystem. The BCR of coarse, fine and aromatic rice were 2.17, 1.98 and 1.92, respectively under irrigated ecosystem, and under rainfed ecosystem the BCR of the respective varieties were 1.88, 1.98 and 2.05 on full cost basis. They also identified some problems and constraints like unsuitability of land, low yield, non- profitability, lack of alternative good quality seed and low output price.
Quayum et al.(1997) in their study titled "Economics of Aromatic Rice Cultivation under Power Tiller at Bogra District" found that current inputs earned the highest share of outputs, which was 38% for MV Aromatic rice cultivation followed by human labor (23%).
According to income share analysis, the farmers earned 72% of the total income of which 25% was generated by land, 8% by family labor (both human and animal), 8% by power tiller and 32% as residual, in case of small group of farmer, whereas the medium group of farmer earned 71% of the total income of which 25 % was generated by land. 7%
from family labor (human and animal). 7%by power tiller and 32% as residual. Similar results were found in case of large group of farmers.
Mustafi et al. (1999) conducted a study on "Input- output Relationship for Rice -Wheat Production System Sustainability at Chuadanga research site." The study showed that human labor itself earned the highest share of output, which were 41% and 31% in case of MV Aman and LV Aus rice respectively but these were 27 % and 30 % respectively in case of MV Aman and LV Aman rice. Variable inputs cost were 21% and 13 % in case of MV Aman and LV Aus whereas in Aman season these were 16 % and 20 % for MV and LV Aman rice, respectively. The residual, which goes to the operator, was found negative for MV Aus but for LV Aus it was 10 % compared to 30 % and 12 % for MV and LV Aman rice. The farmers earned 49 % of the total income of which 38 % was generated by land. 17
% by family labor (both human and animal) and 6 % as residual .In case of MV Aus rice, the farmers earned 63 % of this total income of which 40 % was generated by land. 1 I % by
family labor (both human and animal) and 12 % as residual. On the other hand, the farmers earned 73 % of the total income of which 26 % was from land. 12 % by family labor (both human and animal) ant1 35 % as residual for MV T Aman.
Bhuayan (2000) conducted a study on "Profitability Analysis of Aromatic Rice Cultivation in Some Selected Sites of Kishoreganj, district." It was revealed that in general, farmers did not use their resources efficiently. Farmers had ample opportunities to increase return from Aromatic rice production by using resources efficiently. The study also identified some major problems that were faced by the farmers for producing HYV rice, such as high price of insecticides and lack of cooperation from block supervisor, shortage of hired labor at the critical stages, high wage rate of hired animal or power tiller and lack of capital, seed, and irrigation facilities.
Kabir (2000) conducted a study on “An Economic Analysis of Aromatic and Non-Aromatic Rice Cultivation in Some Selected Areas of Dinajpur District”. The result of the study state that aromatic rice is more profitable than non-aromatic rice. In the study gross return were found to be Tk. 37466.88, Tk. 32291.63, Tk 29881.00 and Tk. 30860.97 per hectare for kataribhog. Kalijira/Chinigura, Shama and Pajam/BR varieties respectively. Gross return form aromatic (Kataribhog) rice was highest (Tk. 37466.88 per hector) followed by the non- aromatic (Pajam/BR varieties) rice (Tk. 30860.97 per hectare).
Mustafi et al. (2000) in their study titled "Production and Export Potential of Fine Rice in the Barind Tract Area". The results of the study stated that the gross returns of Basmoti (grown in Aromatic season) and C'hiniatab (grown in T. Aman season) were Tk.54513 and Tk. 38903 per hectare, respectively and the production cost of Basmoti and C'hiniatab were Tk. 26040 and Tk.12337 per hectare. The average yield of Basmoti and C'hiniatab were 4.3 ton/ha and 2.14 ton/ha in the Barind Tract area.
Mythili and Shanmugam (2000) estimated technical efficiency of rice growers in Tamil Nadu using an unbalanced panel data. The study uses the stochastic frontier production function approach. Results showed that the technical efficiency varied widely (ranging from 46.5 percent to 96.7 percent) across sample farm and was time variant. The mean technical efficiency was computed as 82 percent, which indicated that on an average, the realized output could be increased by 18 percent without any additional resources. The existing gap
between realized and potential yield highlighted the need for improving farmers' practice through extension service and training programs.
Rahman et al.(2000) found that the average level of technical efficiency among sample farmers for Aromatic, Aus and Aman rice crops was 88%, 91% and 81%, respectively. This meant that on an average there appeared to be 12% technical inefficiency for Aromatic rice.9% for Aus rice, and 19% for Aman rice. This implied that the output per farm could be increased significantly without incurring any additional costs. The coefficient of age and experience were negative and significant for Aromatic rice, and the coefficient of experience was negative and significant for Aus rice. Farmers with larger farms were technically more efficient than farmers with smaller operations.
Tasnoova (2000) conducted a study on" Kataribhog Rice Marketing System in Some Selected Areas of Dinajpur District." It was reported that farmers faced some problems for Kataribhog rice marketing such as low market price at harvesting time, lack of capital, lack of adequate storage facilities and higher markets tolls.
Khan et al. (2002) was conducted a study to find out the level of input uses and input output relationship with respect to Aromatic and HYV Aman rice cultivation. The result showed that the amount of human labour, animal labour, and fertilizer used per hectare of Aromatic were 197.17 man-days, 43.38 pair-days and 321.22 kg and for HYV Aman were 153.68 man days, 44.13 pair-days and 176.14 kg respectively, per hectare real cost of seed, irrigation, and pesticides of Aromatic were Tk 1818.93, Tk4591.33, and Tk 536.34 respectively. Human labour and animal labour are positively significant but irrigation cost is negatively significant in case of Aromatic rice production. On the other hand, human labour is negatively but animal labour and seed are positively significant for HYV Aman rice production. For achieving maximum efficiency, the use of human labour, animal labour , seed and fertilizer of Aromatic, animal labour, seed and pesticide of HYV Aman should be increased, pesticide of Aromatic should be decreased and the additional use of the irrigation water of Aromatic, human labour and fertilizer of HYV Aman should be decreased.
Khan et al. (2002) was estimated the growth rates and trend of production and yield of Aromatic and Aman rice. The growth rates of yield and production of Aromatic and HYV Aman rice were also computed for the nineties. During the period of ten years in nineties,
yield and production growth rates of Aromatic were positive and significant. The growth parameters of Aromatic were significantly different in early nineties and ate nineties but in case of HYV Aman growth parameters were not significantly different between the two sub periods of nineties.
Rahman (2002) used stochastic production and cost frontier models in rice production in Bangladesh. He estimated 14%, 7% and 20% technical inefficiencies at aggregate level for Aromatic, Aus and Aman rice crops, respectively. The mean economic efficiency were 79%, 72% and 71% for Aromatic. Aus and Aman rice crops, respectively. This indicated that without changing output the production cost of Aromatic. Aus and Aman rice could be reduced by 21%, 28% and 29%, respectively. The mean economic efficiencies estimated from Trans log stochastic normalized cost frontiers for Aromatic, Aus and Aman-rice crops were 80%, 60% and 74%, respectively. He found economic inefficiencies to increase with the increase in education of farm operators. Older farmers tended to have smaller technical inefficiency than younger farmers and farmers with more experience tended to have smaller technical inefficiencies than farmers with less experience.
Anik and Talukder (2003) was conducted a study on “Economic and financial profitability of aromatic and fine rice production in Bangladesh” The study was undertaken to evaluate the economic and financial profitability of aromatic and fine rice production, using both primary and secondary data. Domestic Resource Cost (DRC) ratios showed that Bangladesh had comparative advantage in the production of aromatic and fine rice both from the point of view of export and import substitution, except the Nizershail variety which was marginally unprofitable under export proposition. The study also identified some problems faced by the farmers in producing aromatic and fine rice. Finally, some policy guidelines were suggested.
Hasan (2006) conducted a study on “Yield gap in wheat production: a perspective of farm specific efficiency in Bangladesh”. The study employed frontier production function method to estimate technical efficiency in wheat production. He estimated mean technical efficiency of wheat growers as 0.84, allocative efficiency as 0.91 and economic efficiency as 0.76. The coefficients of farmers‟ education, wheat farming experience, and training on wheat were negatively significant in the inefficiency effect models implying that inefficiency decreases with the increase in farmers‟ education, wheat farming experience, and training on wheat.
.
Dinesh et al.(2007) conducted a case study in Chhattisgarh about aromatic rice. In recent years there has been a serious concern among the farmers, scientists, policymakers and environmentalists regarding the continuous erosion of genetic biodiversity of rice cultivars in Chhattisgarh which has traditionally been known as bowl of scented rice‟s in central India. In view of India‟s potential competitiveness in aromatic rice‟s in the international market, it is imperative to understand the dynamics of domestic trade in aromatic rice. In this study, marketing and price-spread patterns of aromatic rice in the state of Chhattisgarh have been examined. A few policy interventions have been suggested for promoting aromatic rice‟s in the state.
Akhtar et al. (2007) was conducted a study on “Economic efficiency and competitiveness of the rice production systems of Pakistan‟s in Punjab”. The results indicate that an expansion of the production of Basmati rice can lead to an increase in exports. The production of IRRI in Pakistan‟s at Punjab is characterized by a lack of economic efficiency implying inefficient use of resources to produce the commodity. The analysis shows that the prevailing incentive structure affected farmers negatively. A negative divergence between private and social profits implies that the net effect of policy intervention is to reduce the farm level profitability of both rice production systems in Punjab.
Arif (2008) conducted a research proposal about comparative profitability and technical efficiency of aromatic BRRI34 and non-aromatic BR11 rice varieties which are transplanted at two contiguous upazilas of dinajpur district. The study reveals that the yield of BRRI dhan34 is found lower than that of BR11 rice. But gross return of BRRIdhan34 is much higher(Tk.82467/ha) than that of BR11 (Tk.66455/ha) rice. Gross margin was also found higher for BRRI dhan 34 (Tk.58869/ha) than by BR11 rice (Tk.39013/ha)return over per taka investment (BCR) were Tk. 1.87 and Tk. 1.37 for BRRI dhan 34 and BR11 rice.
Majumder et al. (2009) analyze a study on “Productivity and resource use efficiency of aromatic rice production”. This study was attempted to measure and compare resource use efficiency and relative productivity of farming under different tenure conditions in an area of Bhola district. A random sampling technique was used in the study. Sample farmers were classified as owner, crop share tenant and cash tenant farmers. A total of 90 samples, 30 from each class were selected on the basis of random sampling technique. The study
explored the difference in the efficiency and productivity among owner, cash tenant and crop share tenant. Total cash expenses as well as total gross costs for producing Aromatic rice was highest in owner farms and lowest in crop share tenant's farm. When individual inputs were concerned it was observed that expenses on human labor shared a major portion of expenses in the production of Aromatic rice where owner operators used more hired labor in compare to other groups. However, the cash tenant farmers were more efficient than owner and crop share tenant farmers. Due to poor resource base the crop share tenants were unable to invest on modern farm inputs.It may be mentioned that in Bangladesh the predominant tenancy arrangement is share cropping, which is an inefficient form of tenure arrangement in compare to cash tenancy.
Devi and Singh (2014) analyze “Resource use and technical efficiency of rice production in Manipur.” Rice is regarded as the first cultivated crop in Asia as well as important food crop of India. The cost and return structure and technical efficiency in rice production has been reported in different regions as well as in the state of Manipur to show different regions have adopted the latest technology. Primary data have been collected from the sample rice farms with the help of pre-tested scheduled through personal interview with respondent farmers. Technical efficiency of individual farms has been estimated through stochastic production function analysis. The total cost of cultivation on small farms was much higher than the large farms. Imputed rental value for owned land was the major cost items for all the farms. On an average majority (40%) of the rice growing farmers were operating at the technical efficiency level of (99-100) % in relation to frontier output level. Gross return as well as net return per hectare have been observed to be highest for category I followed by category II. Most of the farms have been observed to be potential to expand production and productivity, increasing technical efficiency as majority has been performing with increasing returns to scale.
Long (2015) conducted a study on “Comparative analysis of resource use efficiency between organic rice and conventional rice production in Mekong Delta of Vietnam. „The efficiency with which farmers use available resources is very important in agricultural production. The study was conducted to measure and compare resource use efficiency and relative productivity of farming under Organic rice and Conventional rice production in Mekong Delta of Vietnam. One hundred twenty randomly selected farms, 60 from each system, were surveyed. The study explored differences in efficiency and productivity
between production systems. Cobb-Douglas production function analysis was used to calibrate resource use efficiency. The results showed that the regression coefficients of expenditure on seed, organic manure and bio-fertilizers in Organic rice cultivation, and expenditure on herbicide and machine labor in Conventional rice cultivation were significant. The efficiency was greater than one for seed, organic manure, machine labor and bio-fertilizer for Organic rice production. In conventional rice production, herbicide and machine labor were underutilized resources. The results suggested that the quantity of these resources was used less than optimum and there exists further scope for increased use of these resources. Other resources were over utilized, such as human labor and bio-pesticide in organic rice production, and seed, chemical fertilizer, pesticide and human labor in conventional rice production.
Parasar et al. (2016) conducted a study on “Resource use efficiency in rice production under SRI and conventional method in Assam, India.” To meet the rising demand for rice, the staple food in Assam, the production of rice has to be increased by many folds. Considering the shrinkage of agricultural lands, productivity increase is the only way out to increase the production. System of Rice Intensification (SRI) is reported to enhance rice yield to considerable extent. However, the acceptability of the method by the tradition rice growers of the state is a matter of concern. Further, the resource use status of SRI is yet to be studied systematically in Assam. The present study on resource use in SRI has shown that the resources used in SRI need to be increased for enhanced rice production the state.
CHAPTER-III METHODOLOGY 3.1 Introduction
This chapter deals with the tools and techniques used for collecting the necessary information of this study. It also addresses the methodology through which the collected data were categorized and analyzed in order to achieve the objective of the study. The design of research involved in the present study has been described in this chapter.
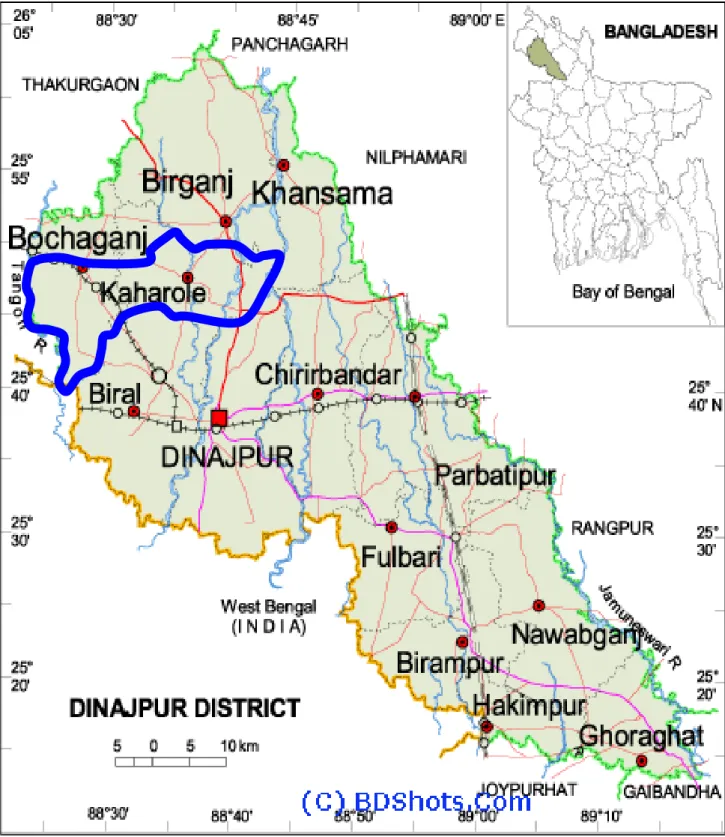
3.2 Selection of the Study Area
The area where the selected varieties of rice has been grown successful was considered as the study area. Dinajpur district was purposively selected for the study because of the fact that it is one of the leading aromatic rice producing areas of Bangladesh. The researcher had an easy access to this area, on the other hand, the following considerations were kept in mind for selecting Dinajpur as a study area. Keeping in mind the main objectives of the present study, kaharole upazila of Dinajpur district was selected for collecting data.
3.3 Sampling Techniques and Data Collection Procedure
There are different types of sampling techniques depending on the nature of population, objectives of the study. Data collection procedures are the activities involved in collecting the desired data from the sample. The desired data can be collected through the interview schedule, questionnaire and direct observation. The following sampling techniques and data collection procedures were followed for the present study.
3.4 Sampling technique
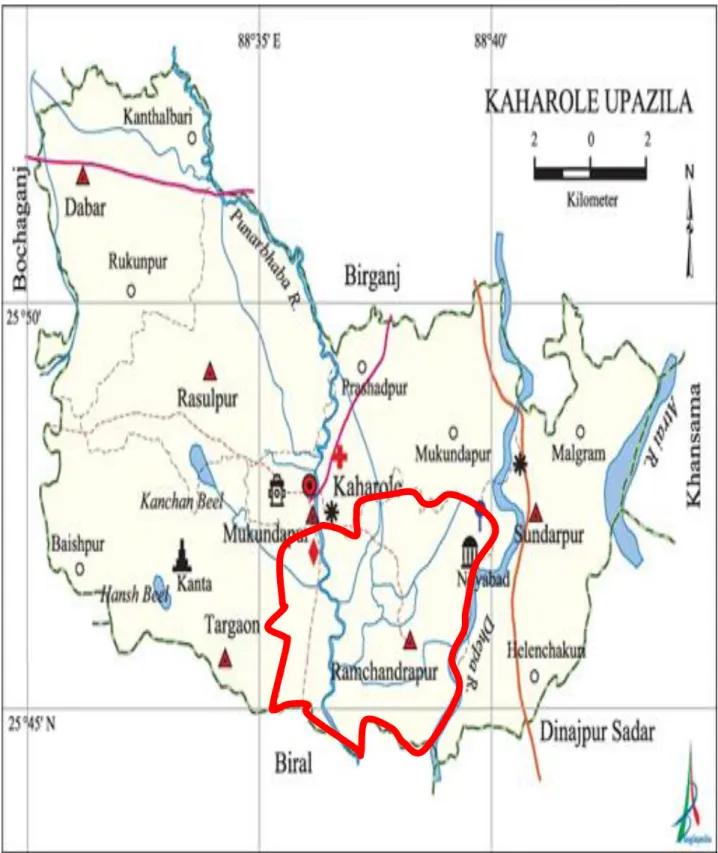
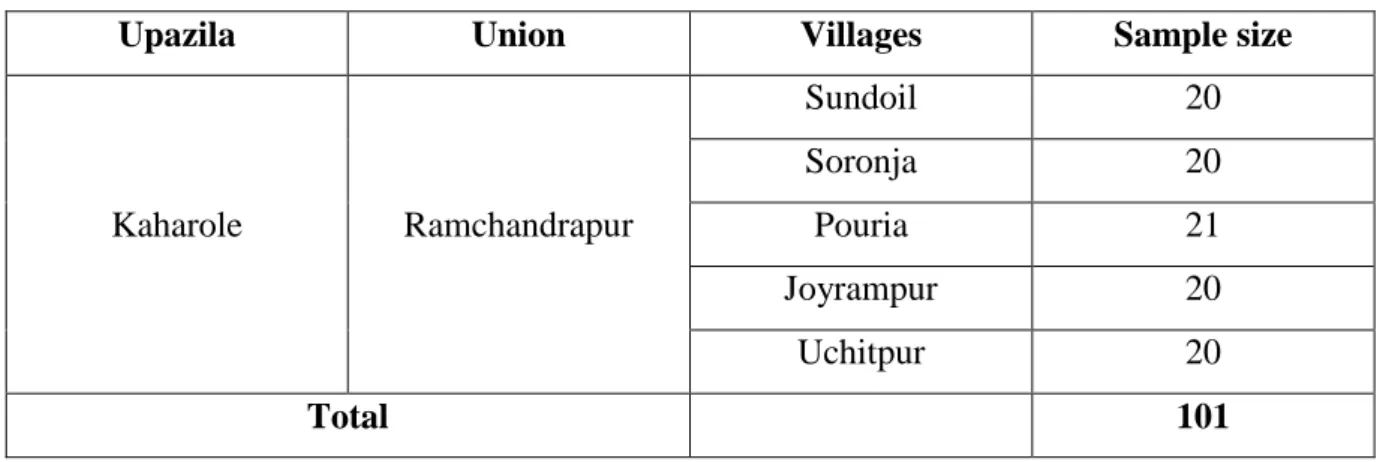
All the aromatic and non-aromatic rice growers in Dinajpur district were not possible to include in this study because of the paucity of resources and time constraint. A reasonable sample survey, which would represent the population, was required in order to meet up the purpose of the study. Simple random sampling technique was adopted in this study. After purposively selecting Dinajpur district, one upazilas namely, Kaharole was selected randomly from13 upazilas. Subsequently, five villages from Kaharole upazila were also selected randomly. Therefore, a list of 101 aromatic rice producers were constructed with the help of village leaders and field level extension personnel. After preparing the sampling frame 101 farmers were selected randomly for primary data collection.
Figure 3.1 Map of Dinajpur district showing Kaharole upazila
Figure 3.2 Map of Kaharole upazila showing the study area
Table 3.1 List of villages with sample size
Upazila Union Villages Sample size
Kaharole Ramchandrapur
Sundoil 20
Soronja 20
Pouria 21
Joyrampur 20
Uchitpur 20
Total 101
3.5 Preparation of the Interview Schedule
In conformity with the objectives of the study, a preliminary interview schedule was designed in an effort to collect the data from the farmers. It was then pre-tested to verify the relevance of the questions and the nature of responses of the farmers. After pretesting of the questionnaire necessary modifications were made in consultation with the relevant experts.
3.6 Study and Survey Period
The data were collected through survey during the period of1st June, 2019 to 30th July, 2019.
3.7 Method of Data Collection
For the present study, data were collected through personal interviewing of the rice growers. Interviews were mainly conducted at the leisure of the farmers with a view to keeping them undisturbed and securing accurate information. Before going to administer the interview, the respondents were made clear about the purpose and objectives of the study. It was explained to the farmers that the study was purely academic. Each time when every interview was completed, the interview schedule was thoroughly checked and properly recorded. If there were such items, which were overlooked or contradictory, they were amended accordingly to suit the purpose. In addition to survey, observation method was also applied to collect information by the researcher. It is better to mention that some items were recorded initially in local units and finally convened those into standard units while processing data.
3.8 Problems Faced by the Researcher in Data Collection
There were some problems faced by the researcher during the period of data collection.
The problems which are enlisted below:
1. Although most of the farmers in the study area were literate, they did not have adequate knowledge on the value of a research study and it was therefore, really difficult to convince them as to the utility of this research.
2. The farmers were afraid of imposition of taxes and because of that they always tried to avoid providing authentic information relating to the actual size of holding and annual income.
3. The farmers were not available at their home because they often remained busy dealing with farm activities in the field, thus sometimes; two or three visits were made for a single interview which was really very time consuming and costly as well.
4. Sometimes it was observed that the farmers would try to reply quickly to the questions in order to get rid of researcher somehow or anything like this.
5. The researcher had to depend solely on the memory of the farmers for collecting data because they did not care to keep any written records for their farm business.
3.9 Analytical Techniques
Both descriptive tabular analysis and statistical analysis will be used for analyzing the data.
3.10 Descriptive Analysis
Tabular and graphical analysis is generally used in order to find out socio-economic status of the respondents. The tabular technique of analysis will be used to determine the cost, returns and profitability of aromatic rice producing farmers. It will used to get the simple measures like average, percentage and ratio. Tabular technique included production practices and input use, cost and returns of aromatic rice production.
3.11 Statistical Analysis
Cob-Douglas production function analysis will be used to estimate the productivity and resource use efficiency of aromatic rice production. Marginal productivity of selected inputs will be calculated to ascertain the level of efficiency of individual input use. To determine the contribution of the most important variables in the production process, the following specification of the model will be applied:
Y= a X1b1 X2b2 X3b3 X4b4 X5b5 X6b6 X7b7X8b8X9b9X10b10X11b11 + Ui --- ( 1 )
This equation may be alternatively expressed as:
lnY= lna + b1ln X1 +b2lnX2 + b3lnX3 +b4lnX4 + b5lnX5 + b6lnX6 + b7lnX7 + b8lnX8+b9lnX9+ b10lnX10+ b11lnX11+Ui --- ( 2 )
Where,
Y = Per hectare yield of aromatic paddy (Tk. /ha) a = Intercept
X1 = Cost of animal labor and power tiller (Tk. /ha) X2=No. of human labor (man days/ha)
X3 = Quantity of seed in producing aromatic paddy (Kg/ha) X4= Quantity of manure in producing aromatic paddy (Kg/ha) X5= Quantity of urea in producing aromatic paddy (Kg /ha) X6= Quantity of TSP in producing aromatic paddy (Kg /ha) X7= Quantity of MoP in producing aromatic paddy (Kg /ha) X8= Quantity of gypsum in producing aromatic paddy (Kg /ha) X9= Quantity of Zinc sulphate in producing aromatic paddy (Kg /ha) X10= Cost of pesticide in producing aromatic paddy (Tk. /ha)
X11=Cost of irrigation in producing aromatic paddy (Tk. /ha)
b1,b2………b7=Coefficient of relevant variables.
Ui=Disturbance term
ln=Natural logarithm.i= 1, 2…,11.
3.12 Procedure of Computation of Costs
The farmers producing aromatic rice had to incur cost for different inputs used in the production process. The input items were valued at the prevailing market price and sometime at government price in the area during survey period, or at the priced at which farmers bought. Sometimes, the farmers purchased hired labor, seed, fertilizer, manure and insecticide from the market and it was easy to pricing these items. But, farmers did not pay cash for some input such as family labor, home supplied seed, cowdung etc. So it was very difficult to calculate the cost of production of these inputs. In this case opportunity cost principle was used. In calculating the production cost, the following components of cost were considered in this study area:
• Land preparation/Mechanical power cost
• Human labor
• Seed
• Cow dung
• Fertilizer
• Insecticides
• Weeding
• Irrigation
• Pesticides cost
• Interest on operating capital and Land use.
3.12.1 Cost of Human Labor
Human labor cost was one of the most important and largest cost items of aromatic rice production in the study area. It is required for different farm operations like land preparation, planting, weeding, application of fertilizer and insecticide, harvesting and carrying etc. Mainly two types of human labor used in the study area; such as family labor and hired labor. Family labor includes the operator himself, the adult male and female as well as children of a farmer‟s family and the permanently hired labor. To determine the costs of unpaid family labor, the opportunity cost concept was used. In this study the opportunity cost of family labor was assumed to be market wage rate, i.e., the wage rate that the farmers actually paid to the hired labor. The labor that was appointed permanently was considered as a family labor in this study. In computing the cost of hired labor, actual wages were paid and charged in case where the hired labors were provided with meals; the money
value of such payment was added to the cash paid. The labor has been measured in a man- day unit, which usually consisted of 8 hours a day. In producing aromatic rice human labor were used for the following operations:
Land preparation/ploughing/laddering
Transplanting
Fertilizing, weeding and irrigation
Pest control
Harvesting, storing and marketing
3.12.2 Cost of ploughing and laddering
Human labor and mechanical power were jointly used for ploughing and laddering.
Ploughing and laddering cost was the summation of hired and home supplied draft power and human labor. Hired ploughing and laddering cost were calculated by the prevailing market prices that were actually paid by the farmers. Home supplied mechanical power and human labor cost was estimated on the basis of opportunity cost principle.
3.12.3 Cost of Seeds
Cost of seed was also estimated on the basis of home supplied and purchased seed. Home supplied seed were calculated at the prevailing market rate and the costs of purchased seed were calculated at the actual price.
3.12.4 Cost of Cow dung or Manure
Cow dung may be used from home supplied or through purchased. The value of home supplied and purchased cow dung was calculated at the prevailing market price.
3.12.5 Cost of Fertilizer
It is very important for aromatic rice cultivation to use the fertilizer in recommended dose.
In the study area, farmers used mainly three types of chemical fertilizer i.e., Urea, TSP (Triple Super Phosphate), MP (Muriate of Potash) for growing aromatic rice cultivation.
Fertilizer cost was calculated according to the actual price paid by the farmers.
3.12.6 Cost of Insecticide
Most of the sample farmers used Dithane M-45, Thiovit 80wp and Rovral 50wp for aromatic rice production. The cost of these insecticides was calculated by the prices paid by farmers.
3.12.7 Cost of Irrigation
The cost of irrigation included the rental charge of machine plus the costs of fuel. Someone rent/borrow only water from the shallow tube well (STW) owners by paying some charge.
3.12.8 Interest on operating capital
Interest cost was compute at the rate of 5% per annum. It was assumed that if farmers would take loans from a bank, they would have to pay interest at the above mentioned rate. Since all expenses were not incurred it the beginning of the production process, rather they were spent throughout the whole production period the cost of operating was, therefore, computed by using the following formula:
Interest on operating capital =
This actually represented the average operating costs over the period because all costs were not incurred at the beginning or at any fixed time. The cost was charged for a period of 6 months at the rate of Tk. 5 per annum.
3.12.9 Land use cost
The price of land was different for different plots depending upon location and topography of the soil. The cost of land used was estimated by the cash rental value of land. In calculating land use cost, average rental value of land per hectare for a particular year. In computing rental value of land of the land used cost (LUC), it was calculated according to farmer‟s statement.
3.13 Measurement of Resource Use Efficiency of Aromatic Rice Production
In order to test the efficiency, the ratio of Marginal Value Product (MVP) to the Marginal Factor Cost (MFC) for each input were computed and tested for its equality to 1. i.e.,
Operating Capital * Rate of interest x Time 2
MVP/MFC = 1.
The marginal productivity of a particular resource represents the additional to gross returns in value term caused by an additional one unit of that resource, while other inputs are held constant.When the marginal physical product (MPP) is multiplied by the product price per unit, the MVP is obtained. The most reliable, perhaps the most useful estimate of MVP is obtained by taking resources (Xi) as well as gross return(Y) at their geometric means.
That is, = r
Where, r = Efficiency ratio MVP = value of change in output resulting from a unit change in variable input (BDT) MFC = price paid for the unit of variable input (BDT)
Under this method, the decision rules are that, when: r >1, the level of resource use is below the optimum level, implying under-utilization of resources. Increasing the rate of use of that resource will help increase productivity. r <1, the level of resources use is above the optimum level, implying over utilization of resources. Reducing the rate of use of that resource will help improve productivity. r = 1, the level of resource use is at optimum implying efficient resource utilization.
The most reliable, perhaps the most useful estimate of MVP is obtained by taking all input resources (Xi) and gross return (Y) at their geometric means (Dhawan and Bansal, 1977).
All the variables of the fitted model were calculated in monetary value. As a result the slope co-efficient of those independent variables in the model represent the MVPs, which were estimated by multiplying the production co-efficient of given resources with the ratio of geometric mean (GM) of gross return to the geometric mean (GM) of the given resources, that is,
MVP (Xi) = βi
Where, Ȳ (GM) = Geometric mean of gross return (BDT)
Ẍi(GM) = Geometric mean of different independent variables (BDT) βi = Co-efficient of parameter
i = 1, 2,………..n MVP MFC
Ȳ(GM) Ẍi(GM)
3.13 Profitability Analysis
Cost and return analysis is the most common method of determining and comparing the profitability of different farm household. In the present study, the profitability of aromatic rice is calculated by the following way-
3.13.1 Calculation of Gross Return
Per hectare gross return was calculated by multiplying the total amount of product and by- product by their respective per unit prices.
Gross Return= Quantity of the product * Average price of the product + Value of by- product.
3.13.2 Calculation of Gross Margin
Gross margin is defined as the difference between gross return and variable costs.
Generally, farmers want maximum return over variable cost of production. The argument for using the gross margin analysis is that the farmers are interested to get returns over variable cost. Gross margin was calculated on TVC basis. Per hectare gross margin was obtained by subtracting variable costs from gross return. That is, Gross margin = Gross return – Total variable cost.
3.13.3 Calculation of Net Return
Net return or profit was calculated by deducting the total production cost from the total return or gross return. That is,
Net return = Total return – Total production cost.
The following conventional profit equation was applied to examine farmer‟s profitability level of the aromatic producing farms in the study areas.
Net profit, π = Σ PmQm +Σ PfQf - Σ (Pxi Xi) – TFC.
Where, π = Net profit/Net return from aromatic rice (Tk/ha);
Pm = per unit price of aromatic rice (Tk/kg);
Qm = Total quantity of the aromatic rice production (kg/ha);
Pf = per unit price of by products (Tk/kg);
Qf = Total quantity of by products (kg/ha);
Pxi = Per unit price of i-th inputs (Tk);
Xi = Quantity of the i-th inputs (kg/ha);
i = 1, 2, 3... , n. (number of inputs).
To assess the profitability level of aromatic rice undiscounted Benefit Cost Ratio (BCR) will be checked. Where BCR = (Gross return)/ (Gross cost).
3.13.4 Undiscounted Benefit Cost Ratio(BCR)
Average return to each taka spent on production is an important criterion for measuring profitability. Undiscounted BCR was estimated as the ratio of total return to total cost per hectare.
Total Return Total Cost BCR=
CHAPTER IV
SOCIO-DEMOGRAPHIC PROFILE OF AROMATIC RICE PRODUCTION FARMERS
4.1 Introduction
In this chapter the findings of the study and its interpretation are presented in four sections according to the objectives of the study. This section deals with the selected characteristics of the aromatic rice farmers.
4.2 Selected Characteristics of the Aromatic Rice Farmers
In this section, the results of the aromatic rice farmers have been discussed. The salient feature of the respondents with their seven selected characteristics has been presented in Table 4.1.
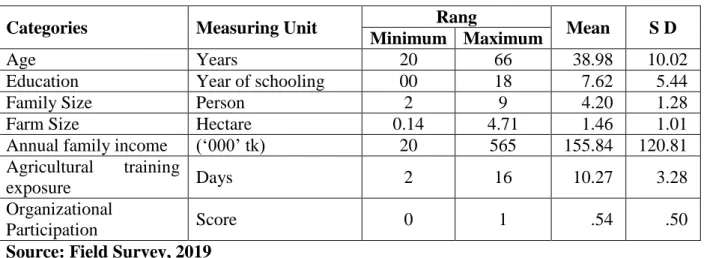
Table 4.1 The salient features of the selected characteristics of the farmers
Source: Field Survey, 2019
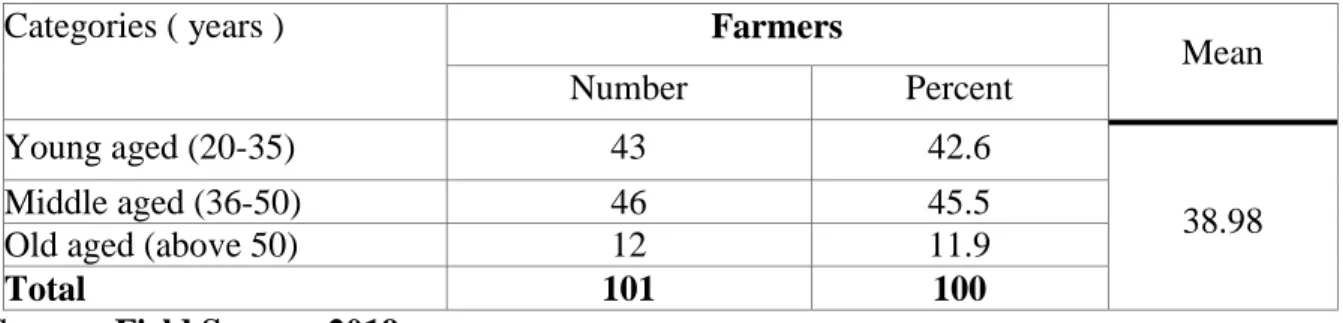
4.2.1 Age distribution of the farmers
The age score of the aromatic rice farmers ranged from 20 to 66 with an average of 38.98.
Considering the recorded age farmers were classified into three categories namely young, middle and old aged following (MoYS, 2012).
Categories Measuring Unit Rang
Mean S D Minimum Maximum
Age Years 20 66 38.98 10.02
Education Year of schooling 00 18 7.62 5.44
Family Size Person 2 9 4.20 1.28
Farm Size Hectare 0.14 4.71 1.46 1.01
Annual family income („000‟ tk) 20 565 155.84 120.81
Agricultural training
exposure Days 2 16 10.27 3.28
Organizational
Participation Score 0 1 .54 .50
Table 4.2 Distribution of the farmers according to their age
Categories ( years ) Farmers
Mean
Number Percent
Young aged (20-35) 43 42.6
38.98
Middle aged (36-50) 46 45.5
Old aged (above 50) 12 11.9
Total 101 100
Source: Field Survey, 2019
Table 4.2 indicates that the majority (45.5 percent) of the respondents fell into the middle- aged category while 42.6 percent and 11.9 percent were found young and old aged categories respectively.
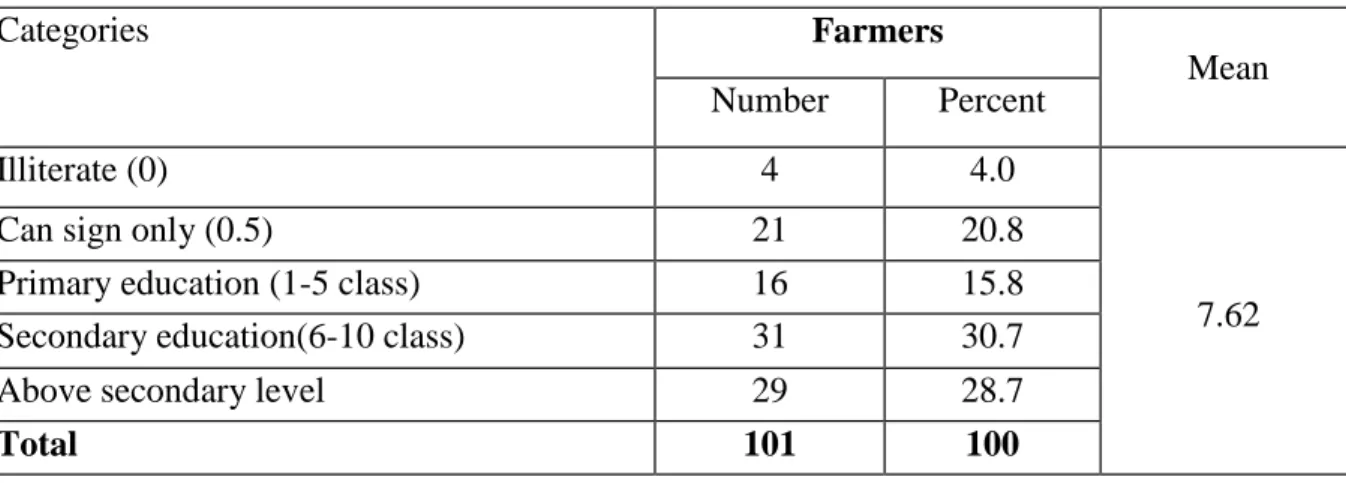
4.2.2 Education status of the farmers
Educational qualification of the respondents‟ had been categorized as done by Poddar (2015).
Education of the farmers ranged from 0 to 18years of schooling having an average of 7.62 years.
On the basis of their education, the respondents were classified into five categories as shown in Table 4.3.
Table 4.3 Distribution of the farmers according to their education
Categories Farmers
Mean Number Percent
Illiterate (0) 4 4.0
7.62
Can sign only (0.5) 21 20.8
Primary education (1-5 class) 16 15.8
Secondary education(6-10 class) 31 30.7
Above secondary level 29 28.7
Total 101 100
Source: Field Survey, 2019
Data contained in Table 4.3indicates the 30.7 percent of the farmer‟s secondary level of education. It was found that 15.8percent had primary level of education, 20.8 percent can only sign category, and 28.7 percent had above secondary level of education. Only 4 percent were illiterate (don't read and write).
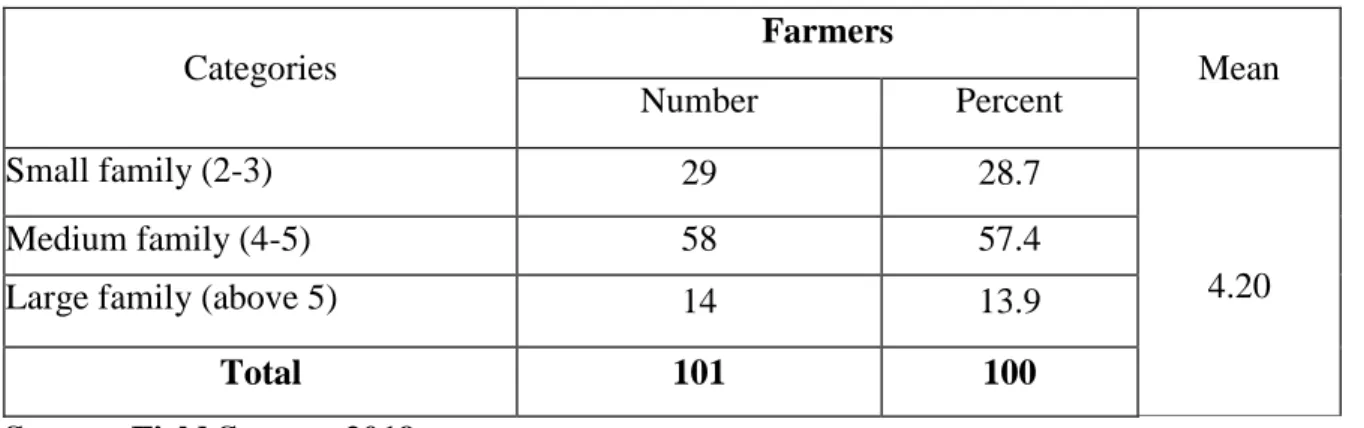
4.2.3 Family size of the farmers
To describe the family size of the respondents, the category has been followed as represented by Poddar (2015).Family size scores of the farmers ranged from 2 to 9 with an average of 4.20.
According to family size, the respondents were classified into three categories as shown in Table 4.4.
Table 4.4 Distribution of the farmers according to their family size Categories
Farmers
Mean
Number Percent
Small family (2-3) 29 28.7
4.20
Medium family (4-5) 58 57.4
Large family (above 5) 14 13.9
Total 101 100
Source: Field Survey, 2019
Data contained in Table 4.4indicates that (57.4%) of the farmers had medium family while 13.9percent of them had large family and 28.7 percent of them had small family. Thus, about two third (71.3%) of the farmers had medium to large family.
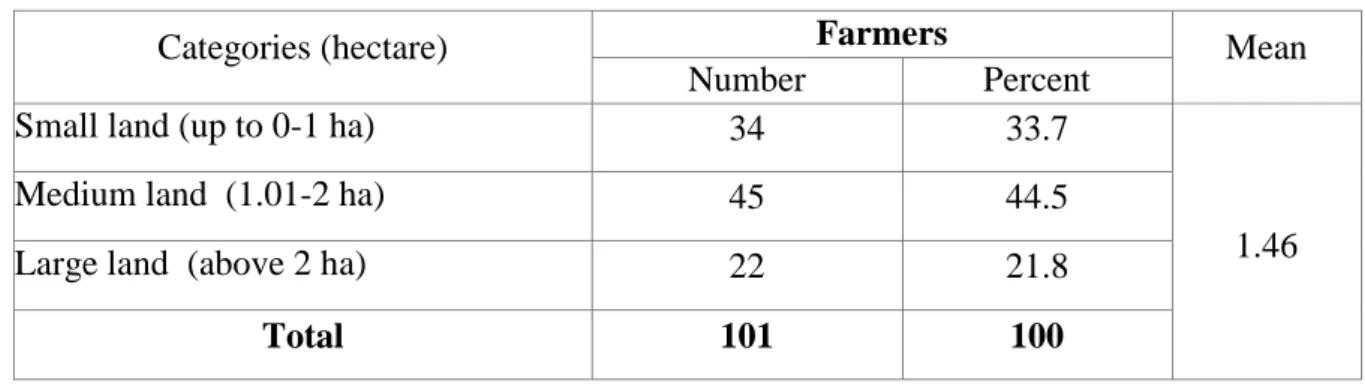
4.2.4 Farm size of the farmers
Land possession of the respondents varied from 0.14 to 4.71 hectare and the average being 1.46 hectare and standard deviation of 1.01. Depending on the land possession the respondents were classified into three categories according to DAE (1999) as appeared in table 4.5.
Table 4.5 Distribution of the farmers according to their farm size
Categories (hectare) Farmers Mean
Number Percent
Small land (up to 0-1 ha) 34 33.7
1.46
Medium land (1.01-2 ha) 45 44.5
Large land (above 2 ha) 22 21.8
Total 101 100
Source: Field Survey, 2019
Similar result was observed Nasreen et al. (2013) where highest respondents were medium farm sized. Data contained in table 4.5indicates the 44.5percent of the farmers had medium land while 33.7percent of them had small and only 21.8 percent of them were large farmer.
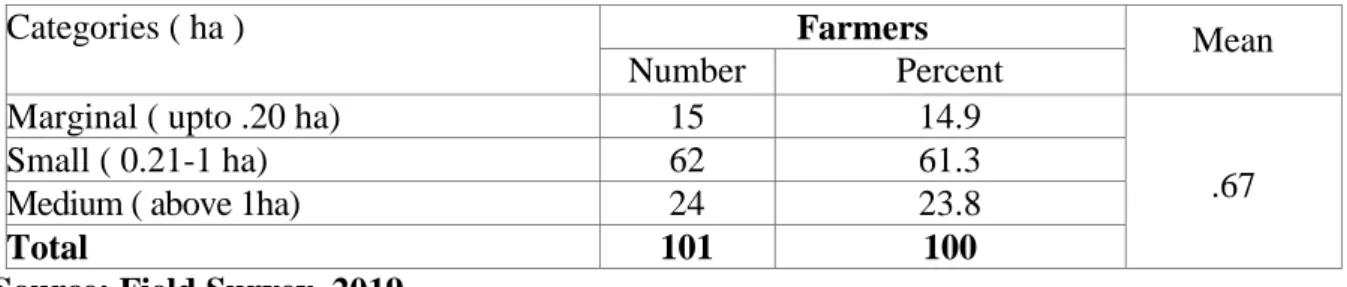
4.2.5 Land under aromatic rice cultivation
Land under aromatic cultivation of the farmers varied from 0.06 to 2.27 hectare. The average Land under aromatic cultivation was 0.67 hectare with the standard deviation of 0.44. Based on Land under aromatic cultivation, the farmers are classified into three categories as shown in Table 4.6.
Table 4.6 Distribution of the farmers according to their aromatic rice cultivation land
Categories ( ha ) Farmers Mean
Number Percent
Marginal ( upto .20 ha) 15 14.9
Small ( 0.21-1 ha) 62 61.3 .67
Medium ( above 1ha) 24 23.8
Total 101 100
Source: Field Survey, 2019
Data contained in Table 4.6 indicates that the largest proportion (61.3 percent) of farmers had small aromatic rice cultivation area compared to 23.8 percent having medium and 14.9 percent had marginal aromatic rice cultivation land. It was again found that most (85.1 percent) of the farmers had small to medium aromatic rice cultivation land.
4.2.6 Annual family income
The annual family income of the farmers ranged from Tk.20 thousand to Tk. 565 thousand with an average of Tk. 155.84 thousand and standard deviation of 120.81 thousand.
Based on the annual income, the farmers were divided into three categories as shown in Table 4.7.
Table 4.7 Distribution of the farmers according to their annual family income
Categories („000‟ Tk.) Farmers
Mean
Number Percent
Low (up to 35) 11 10.9
155.84
Medium (36-275) 72 71.3
High (above 275) 18 17.8
Total 101 100
Source: Field Survey, 2019
From the Table 4.7 it was observed that the highest portion (71.3 percent) of the farmers had medium annual family income compared to 10.9 percent having low and only 17.8 percent had high annual family income.
4.2.7 Training exposure
The score of training exposure of the farmers ranged from 2 to 16 days, the mean being 10.27 and standard deviation of 3.28. Based on observed range, the farmers were classified into three categories as shown in Table 4.8.
Table 4.8 Distribution of the farmers according to their training exposure
Categories (days) Farmers
Mean
Number Percent
Low training (2-7) 18 17.8
10.27
Medium training (8-13) 71 70.3
High training (above 13) 12 11.9
Total 101 100
Source: Field Survey, 2019
Data contained in Table 4.8indicates that 70.3 percent of the farmers had medium training exposure; while 17.8 percent of the farmer‟s low training exposure and 11.9percent had high training exposure Thus, about 88.1% of farmers had low to medium training exposure.
4.2.8 Organizational participation
The score of organizational participation of the farmers ranged from 0 to 1, the mean being 0.54 and standard deviation of 0.50. Based on observed range, the farmers were classified into two categories as shown in Table 4.9.
Table 4.9 Distribution of the farmers according to their organizational participation
Categories (Scores) Farmers Mean
Number Percent
No participation (0) 46 45.5
0.54
Yes participation (1) 55 54.5
Total 101 100
Source: Field Survey, 2019
Data contained in Table 4.9indicates that 54.5 percent of the farmers had yes participation