Recent simulation work has repeated a number of hypotheses that challenge our understanding of the nature of drag reduction and its long-standing regimes. I have programmed a LabVIEW graphical user interface to simultaneously capture the mass measurements and issue commands to the Arduino controlled system to control each component of the instrument. Particle frame rate measurements with this instrument are expected to be part of Jacqueline Tawney's thesis.
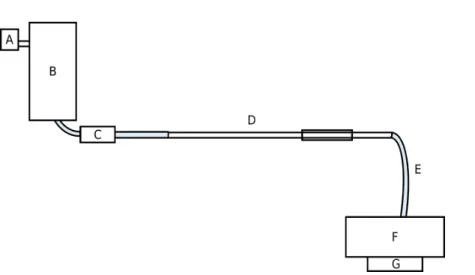
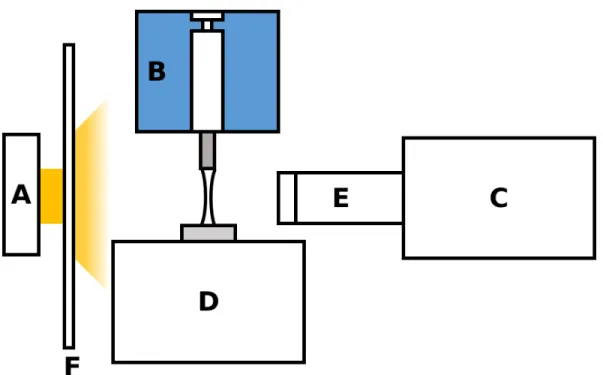
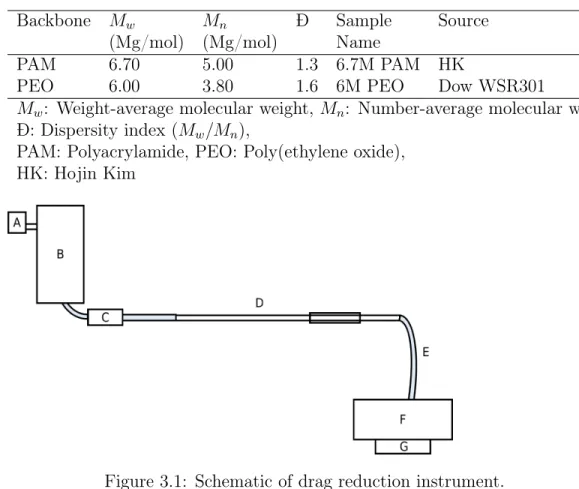
The second used the complete system as described above with Figure 3.1 and measured the breakdown and resistance reduction as a function of passage from flow from the reservoir tank to the receiving tank. Liquid was allowed to drain from the carriage into the tank by gravity driven flow through the connection until all the liquid was in the reservoir tank. In a drag reduction, the reservoir tank will be pressurized to 5 psi (0.03 MPa) and the pipe connecting the reservoir tank to the receiving tank (Figure 3.1) will be "primed" with a small amount of solution by opening the ball valve for 2.5 seconds to reduce vibration in the receiving tank from air blowing through before the solution flow.
In a shrinkage experiment, no incline step was used due to the shorter distance and lack of measurement of the mass of the receiving reservoir. In the case of shrinkage experiments, all liquid was allowed to flow into the receiving tank before the ball valve was closed, and the total flow time and total mass of liquid remaining in the tank were used to estimate the mass flow rate. In the case of drag reduction experiments, the mass of the receiving tank was measured as a function of time from the scale (G in Figure 3.1) and the ball valve was closed after a certain duration (7.5 s for the short PEO tests and 7 s for PEO during and all PAM tests).
In the pushback sampling experiment, a small portion of the fluid returning to the reservoir tank after pass 1 of a contraction experiment was allowed to flow back to the receiving tank for sampling.
Pushback
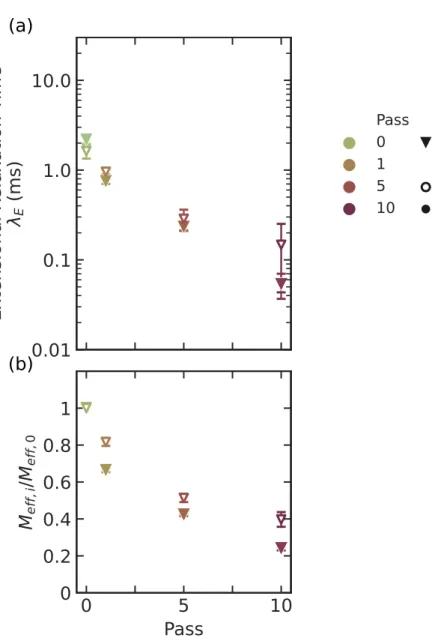
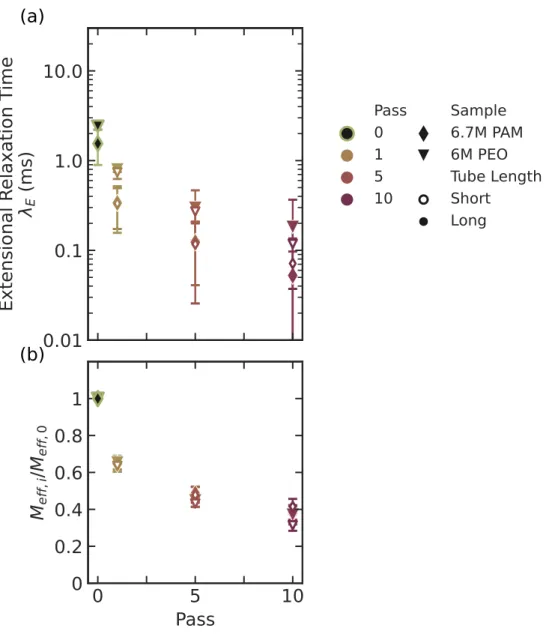
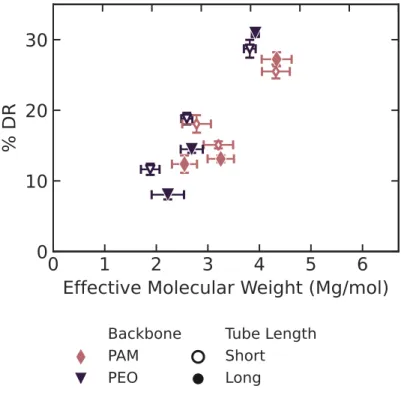
Using the effective molecular weight ratios calculated from the measured extension relaxation times and multiplied by the known starting molecular weight, we compared the measured resistance reduction to the effective molecular weight as the solutions decayed. On the fluid flow side, we sought to achieve high pipe flow Reynolds numbers that had been largely unstudied in the literature at the intersection of polymeric drag reduction and particle image velocity (PIV), particularly those not achievable with current drag reduction simulation capabilities. Because the instrument will eventually be used to test new polymer additives, we were limited to liquid volumes so that reasonable polymer resistance reduction treatment rates (50-100 ppm) only require about 1 g of polymer per batch.
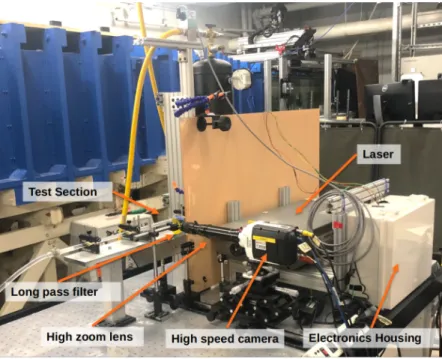
In addition to observing the effects of polymeric drag reduction through PIV, we measure fluid mass flow through the instrument using a scale and use the rate of steady-state mass accumulation over time to determine the drag reduction relative to only the water. Our instrument is capable of achieving multiple Reynolds numbers exceeding 50,000 for water at only 40 psi (0.28 MPa) (well below the upper limit of 80 psi), and we have observed drag reductions exceeding 30% in preliminary measurements of polymeric drag reduction, meeting the desired design criteria. Comparison of the degradation for PEO at similar mass flow rates observed by decreasing the elongational relaxation time of solutions (and thus effective molecular weight) in contraction-expansion flow alone with flow through the full drag reduction instrument shows that the fraction most of the degradation is occurring in those elements, rather than in the pipe flow.
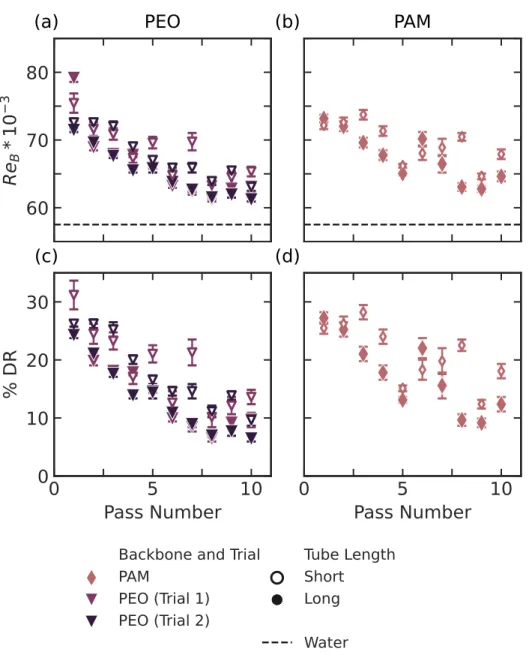
At the flow rates of the drag reduction experiments, the extensional relaxation times reached by the PEO solutions in both the 15. In this instrument, the drag reduction due to the polymers and the additional pressure loss in the contraction and expansion stages due to the increased extensional viscosity compete and the sum is observed via the mass flow rate. Both samples show decreasing extended relaxation time with passage and the percentage of resistance reduction is shown.
Comparing our two backbones, we might expect a priori that 6M PEO would provide more drag reduction than 6.7M PAM for two potential reasons. Despite the lower reduced concentration (c/c∗ of 0.05 for PAM, 0.12 for PEO) and the shorter extended length (190,000 backbone atoms for PAM, 410,000 for PEO), PAM still showed similar levels of drag reduction as a function of effective molecular weight of the backbone during degradation (Figure 3.8) and retained higher drag reduction after 10 passes of degradation. Through the combination of extensional rheology and bulk flow measurement, we were able to quantify both drag reduction and extensional relaxation times.
Simultaneous particle image velocity measurements and bulk flow measurements will enable the connection of microscale effects of polymers on turbulent structures to the observed bulk drag reduction and allow further evaluation of the theories being developed about the mechanisms of turbulent drag reduction via simulations. Comparing the elongation properties of the solutions with their direct effects on drag reduction will inform better design of polymer additives and expand the design space for end-associative polymers tailored to maximize drag reduction and minimize permanent chain scission. Dynamics of viscoelastic pipe flow at low Reynolds numbers in the maximum drag reduction limit”.
A particle image velocimetry study of the effect of drag-reducing polymers on turbulence structure”. Dynamics at the laminar-turbulent boundary and the origin of the maximum drag reduction asymptote”.