Metabolic bi-stability and hysteresis in a model microbiome community
Thesis by Tahmineh Khazaei
In Partial Fulfillment of the Requirements for the degree of
Doctor of Philosophy
CALIFORNIA INSTITUTE OF TECHNOLOGY Pasadena, California
2019
(Defended May 6, 2019)
ii
© 2019 Tahmineh Khazaei ORCID: 0000-0002-4743-2383
iii ACKNOWLEDGEMENTS
I would like to first express my deepest gratitude to my parents. They have made countless sacrifices for me growing up so I could have a brighter future. Throughout my graduate career, although far away, they have been here for me every single day with endless support and love. I would also like to thank my two brothers, Hamid and Arash, for always believing in me, and continuously cheering me on throughout my PhD journey.
I wish to express my sincere gratitude to my advisor, Professor Rustem Ismagilov, for his continuous support of my PhD study and for helping me grow as a research scientist. One thing that will always stick with me is his emphasis that when doing research, the bottleneck should not be resources, but science itself. And indeed, Rustem provided us with ample resources, from funding to opportunities to work with and learn from collaborators. I am very grateful for his encouragement of multi-disciplinary research, which expanded my skill sets and allowed me to work with collaborators in many different fields. I am also thankful to Rustem for giving me opportunities to learn and practice skills important for a career as a research scientist, such as writing grant applications and patent disclosures. Finally, I would like to thank Rustem for being very supportive of my exploration of career interests—I had the opportunity to spend a summer interning at Verily to learn about a career in the biotech industry, which was an invaluable experience.
I would also like to extend my warmest thanks to my committee members: Dr. Christopher Henry, Professor John Doyle, Professor Jared Leadbetter, and Professor Richard Murray. I started working with Chris a year before I joined Caltech, and since then he has kindly been continuously supportive of me. I have learned so much from him about the field of metabolic modeling, which has shaped a major portion of my thesis project. I am especially thankful to Chris for spending the time to look into and help improve my codes and mathematical models. I am very grateful for meeting John during my PhD. He has been extremely encouraging of my project and made me feel welcome as part of his own group. He has really helped me recognize and articulate the impact of my thesis project. I am extremely grateful to Jared for teaching me a great deal about microbiology and reactor microbiology. He has
iv always been very welcoming on each of the many spontaneous times I dropped by his office, spending countless hours teaching me and pointing me in the right direction with my research. I would like to thank Richard for his continuous support and helpful feedback about my work and for teaching Differential Equations and Dynamical Systems, where I learned the fundamentals of dynamical systems, which became a major component of my research.
There are faculty members at Caltech and outside of Caltech who I am grateful to have met during my PhD: Professor Matt Thompson and Professor Lior Pachter, for helping me to interpret data related to my research; Professor Diane Newman, for helpful discussions about my research as well as general life and career advice; Dr. Vanessa Ridaura, for always making me laugh and being an amazing mentor to work for while I interned at Verily;
Professor Elaine Hsaio, an inspiring former postdoc in our lab, for her helpful feedback on my manuscript and for generously spending time with me for career advice; Professor Joseph Parker, for insightful discussions about my research and for teaching me about the potential implications in evolutionary ecology.
I would like to thank all members of the Ismagilov Lab. I had the opportunity to collaborate with and learn from many of them: Jacob Barlow and Nathan Schoepp, who I had the pleasure of working with and publishing an article together. On a separate project, I had the pleasure of working with Rory Williams, Said Bogatyrev, and Roberta Poceviciute, who are not only fantastic colleagues but have also become my good friends. I have also enjoyed collaborating with and learning from Dmitriy Zhukov and Jenia Khorosheva. I would like to extend a big thank you to Tasha Shelby, for being extremely supportive and very enjoyable to collaborate with on projects. She has been essential to the writing process in translating and articulating research projects into articles.
Finally, I am extremely grateful to my friends who truly deserve a big recognition for making these years enjoyable. Thank you for being there for me during the challenges and for celebrating the steps of accomplishment along the way.
v ABSTRACT
For the past century, the mechanism for many infectious diseases has been linked to a single pathogen (per Koch’s postulates); however, with the recent expanding characterization of the microbiome, it is now known that changes in the abundance and composition of species in the human microbiome, and the persistence of these altered microbiome states, can also be associated with disease. There is therefore a critical need to expand our understanding of the mechanisms that cause a stable healthy microbiome to shift into an alternate, stable disease state. Some of these microbiome disease states even paradoxically persist in seemingly unfavorable conditions, e.g., the proliferation of oxygen-sensitive microbes (anaerobes) in oxygen-exposed environments as seen in wound infections, periodontal disease and small intestinal bacterial overgrowth. In Chapter I, we use a combination of genome-scale modeling, reactor microbiology, transcriptomics, and control theory to reveal a potential mechanism for shifts and persistence of microbiome states: multi-stability and hysteresis (MSH). In our results, MSH explains how short-term, reversible changes in oxygen and carbohydrate nutrient levels lead to the persistent, essentially irreversible overgrowth of oxygen-sensitive microbiota. We find that MSH extends beyond the population level and is observed at the level of metabolism, suggesting that MSH is a general mechanism that can describe aerobe–anaerobe states in the microbiome.
Chapter II details a method for rapidly detecting the susceptibility and resistance of Neisseria gonorrhoeae to the antibiotic ciprofloxacin. Antimicrobial-resistant Neisseria gonorrhoeae is an urgent public-health threat, with continued worldwide incidents of infection and rising resistance to antimicrobials. Traditional culture-based methods for antibiotic susceptibility testing are unacceptably slow (1–2 days), resulting in the use of broad-spectrum antibiotics and the further development and spread of resistance. Critically needed is a rapid antibiotic susceptibility test (AST) that can guide treatment at the point- of-care. In our approach, we explore the use of RNA signatures, which are among the first cellular responses to drug exposure, as an indicator of antibiotic susceptibility. Using RNA sequencing, we identified antibiotic-responsive transcripts. Significant shifts (>4-fold
vi change) in transcript levels occurred within 5 minutes of antibiotic exposure. We designed assays for responsive transcripts with the highest abundances and fold changes, and validated gene expression using digital PCR. Using the top two markers (porB and rpmB), we correctly determined the antibiotic susceptibility and resistance of 49 clinical isolates after 10-min exposure to ciprofloxacin. RNA signatures are therefore promising as an approach on which to build rapid AST devices for N. gonorrhoeae at the point-of-care, which is critical for disease management, surveillance, and antibiotic stewardship efforts.
vii PUBLISHED CONTENT AND CONTRIBUTIONS
Chapter I: Tahmineh Khazaei, Rory L. Williams, Said R. Bogatyrev, John C. Doyle, Christopher S. Henry, Rustem F. Ismagilov. “Metabolic bi-stability and hysteresis in a model microbiome community” Submitted (2019).
Author contributions:
Tahmineh Khazaei: Hypothesis ideation with SRB. Design of study. Performed preliminary experiments with SRB: evaluating Kp-Bt community growth under various glucose conditions in batch culture. Built the mathematical model used in this study (Figure 1). Using the mathematical models predicted state-switching and hysteresis within the community and identified regions of bi-stability with respect to glucose and oxygen input conditions (Figure 2). Designed CSTR experiments. These experiments were performed by RLW with help from TK. Established the protocol for short chain fatty acids measurements (further optimized by RLW). Established the protocol for RNA extraction of CSTR samples for RNA sequencing. Performed the RNA extraction of all CSTR samples for RNA sequencing. Established the bioinformatics pipeline for processing and analyzing the CSTR samples (mixed-species samples). Processed and analyzed the RNA sequencing data (Figure 4). Wrote and made figures for the manuscript.
Rory L. Williams: Performed preliminary plate reader experiments testing state switching with BT/KP and BT/E. coli that determined we would use KP in CSTR experiments.
Established the CSTR workflow, optimized media conditions, and performed the CSTR experiments with help from TK (Figure 2). Designed CSTR experiments with TK. Worked with Nathan Dalleska to optimize HPLC for the measurement of SCFAs in CSTR samples. Performed qPCR of all the CSTR samples (Figure 2). Characterized some of the Michaelis Menton constants used in the mathematical models. This was done
viii through batch experiments for growth of Bt and Kp on various substrates and Bayesian parameter inference. Helped TK in preparing the manuscript.
Said Bogatyrev: Hypothesis ideation with TK. Designed and performed preliminary experiments with TK: evaluating Kp-Bt community growth in batch culture as a function of substrate concentration, selectivity, and redox potential in the system.
Roberta Poceviciute: Performed HCR-FISH and DAPI staining on the bioreactor samples embedded into acrylamide gels and imaged. Created imaging figure.
ix
Chapter II: Tahmineh Khazaei, Jacob T. Barlow, Nathan G. Schoepp, and Rustem F.
Ismagilov. "RNA markers enable phenotypic test of antibiotic susceptibility in Neisseria gonorrhoeae after 10 minutes of ciprofloxacin exposure." Scientific reports 8, no. 1 (2018):
11606. doi: 10.1038/s41598-018-29707-w
Author contributions
Tahmineh Khazaei: Co-designed the study with NGS. Developed the computational pipeline for processing and analyzing RNA sequencing data and for selection of RNA markers. Using this pipeline, identified porB and rpmB as the top markers for this study. Established the RNA extraction protocol for Neisseria gonorrhoeae samples (e.g. best kit/protocol to use). Performed RNA extraction of Neisseria gonorrhoeae samples from all the AST experiments in this study for RNA sequencing and performed the quality assessment of the extracted RNA. (This step was after the initial AST exposures performed by NGS or JTB.) Wrote the manuscript and generated all the final figures for publication.
Jacob T. Barlow: Worked side-by-side with TK on day-to-day experimental optimization of RNA AST pipeline on CDC strains, including choice of using 16S rRNA as a control marker. Generated glycerol stocks used for the 50 CDC strains using NGS’s protocol. Set up all cultures and ran all antibiotic exposures for the 50 CDC strains using NGS’s protocols. Ran all qPCR and dPCR experiments for assessing changes in RNA markers.
Designed and implemented statistical thresholding method for determination of differential genes. Used thresholding method to choose 4 additional markers tested. Designed and optimized primers for the additional markers. Generated visualization strategy for plots in figures 2, 3, 4, and 5 before handing off to TK to prepare final versions for paper.
Nathan G. Schoepp: Designed “high throughput” sample handling and exposure workflow for isolates used by JTB and TK. Obtained initial set of Neisseria
x gonorrhoeae isolates from UCLA. Established Neisseria gonorrhoeae culturing and quantification methods which included 1) selecting and screening medias (including the one ultimately used in AST experiments) and 2) selecting and testing primers from literature for specificity, speed, and LOD. Performed initial AST exposures using Neisseria gonorrhoeae isolates, which TK then extracted and sequenced. Designed primers used in final manuscript for rpmB and porB markers. Assisted JTB in primer design for other markers by demonstrating primer design workflow and tools. Made minor contributions to manuscript including minor edits, and providing TK with graphics used in Fig. 1.
xi TABLE OF CONTENTS
Acknowledgements ... iii
Abstract ... v
Published Content and Contributions ... vii
Table of Contents ... xi
List of Illustrations and/or Tables ... xiii
Chapter I: Metabolic bi-stability and hysteresis in microbiome health and disease 1 Abstract ... 1
Introduction ... 2
Results and Discussion ... 3
Figures ... 8
References ... 13
Supplementary Materials ... 17
Materials and Methods ... 17
Chapter II: RNA markers enable phenotypic test of antibiotic susceptibility in Neisseria gonorrhoeae after 10 minutes of ciprofloxacin exposure ... 31
Abstract ... 31
Introduction ... 32
Results ... 34
Discussion ... 38
Materials and Methods ... 41
xii Figures ... 45
References ... 50 Supplementary Materials ... 54
xiii LIST OF ILLUSTRATIONS AND/OR TABLES
Figure Page
1.1 A multi-stable model system consisting of Klebsiella pneumoniae (Kp), a facultative anaerobe, and Bacteroides thetaiotaomicron (Bt), an anaerobe, that is relevant to the human gut microbiome ... 8 1.2 Simulations illustrating bi-stability and hysteresis in the microbial community with respect to environmental perturbations ... 9 1.3 Bi-stability and hysteresis of K. pneumoniae (Kp) and B. thetaiotaomicron (Bt) community in a CSTR ... 10 1.4 Gene-expression analysis of CSTR steady-state samples ... 11 S1.1 Imaging of samples collected from the continuously stirred tank reactor experiments ... 24 S1.2 Bayesian parameter fitting of K and vmax to experimental batch growth data ... 25 S1.3 A quantitative view of regions of stability as a function of glucose concentrations in the input feed and oxygen flow rates into the reactor ... 26 TS1.1 Bayesian parameter estimation for K and vmax used in the Michaelis-Menten equations to constrain nutrient uptake flux rates for flux balance analysis calculations ... 27 TS1.2 Values for the parameters used in the dynamic flux balance analysis simulations ... 28 TS1.3 The top scoring 50 metabolites involved in the most regulated metabolic pathways, ordered by Z score value ... 29 2.1 The workflow for selection and validation of RNA markers for phenotypic measurements of antibiotic susceptibility and resistance ... 45 2.2 Temporal shifts in global gene expression upon ciprofloxacin exposure in Neisseria gonorrhoeae ... 46
xiv 2.3 Selection of candidate RNA markers for phenotypic antibiotic susceptibility
testing in Neisseria gonorrhoeae and measurements of candidate marker abundances per cell ... 47 2.4 Validation of the RNA sequencing approach using digital PCR (dPCR) with six candidate markers. ... 48 2.5 Antibiotic susceptibility testing of 49 clinical isolates using (a) porB, and (b) rpmB as RNA AST markers. ... 49 TS2.1 List of candidate markers and their expression in transcripts per million (TPM) and copies per cell for susceptible isolate S2 and resistant isolate R2 after 15 min of ciprofloxacin exposure ... 54 TS2.2 Primer sequences used for validation of candidate markers by digital PCR ... 56 TS2.3 Minimum inhibitory concentration (MIC) values for the 49 Neisseria gonorrhoeae clinical isolates acquired from the CDC and FDA Antibiotic Resistance Isolate Bank ... 56
C h a p t e r 1
Metabolic Bi-stability and Hysteresis in a Model Microbiome Community
Abstract:
Changes in the species composition of the human microbiome are associated with a broad range of diseases, but elucidating causal mechanisms has been challenging. Some microbiome disease states persist in seemingly unfavorable conditions, e.g., the proliferation of aerobe–anaerobe communities in oxygen-exposed environments in wounds or small intestinal bacterial overgrowth. Using two microbes relevant to the human microbiome, we combine genome-scale mathematical modeling, bioreactor experiments, transcriptomics, and control theory to show that multi-stability and hysteresis (MSH) is a mechanism that can describe shifts to a resilient aerobe–anaerobe community. We examine the impact of changing oxygen and nutrient regimes and identify factors, including changes in metabolism and gene expression, that lead to MSH. Where MSH explains microbiome shifts, it can profoundly improve our conceptual understanding of these paradoxically persistent disease states, and thereby facilitate effective interventions.
Introduction
Many infectious diseases can be linked to a single pathogen (Koch’s postulate); however, recent evidence shows that changes in the species composition and abundance of the human microbiome can also be associated with health and disease (1-3). Understanding the mechanisms that cause compositional shifts in healthy microbiomes, which otherwise can be remarkably stable, is challenging due to the inherent complexity of these ecosystems. A perplexing feature of some of these disturbed ecosystems is the persistence of a new microbiome state, even in seemingly unfavorable conditions. For example, in small intestinal bacterial overgrowth (SIBO), strict anaerobes that are typically found only in the colon become prominent in the small intestine and, paradoxically, persist in this oxygenated environment. Similarly, in periodontal diseases (4) and in wound infections, anaerobes proliferate in oxygen-exposed environments.
One potential mechanism to explain microbiome shifts and their persistence is multi-stability (5, 6), the concept that several steady states can exist for an identical set of system parameters.
Multi-stable systems have been described in the context of ecosystems (7-10), and gene- regulatory networks (11-13). Now, with the expanding characterization of the microbiome, there are signs that multi-stability may also exist in these communities (14-20). For example, compositional changes in gut microbiota are implicated in inflammatory bowel disease (21) and obesity (22). Bimodal species abundance (i.e., when a microbial species is present at either high or low levels) has been interpreted as multi-stability (23); however, as discussed by Gonze et al., bimodality is insufficient to prove multi-stability (5, 24). Some multi-stable systems can additionally exhibit hysteresis, where in response to a perturbation, a system gets “stuck” in a new steady state and the former state cannot be regained by simply reversing the perturbation (5). The presence of hysteresis could be hypothesized from studies of the microbiome (25). For example, antibiotic exposures can change the microbiome composition, and have lasting effects even after removal of the antibiotic (26, 27). However, it has not been rigorously tested whether multi-stability and hysteresis (MSH) can arise in a microbiome-relevant community and by what mechanism.
Here, we investigate MSH in a minimally “complex” two-species system to represent the paradoxical aerobe–anaerobe microbiome communities that persist in oxygen-exposed environments. We used two organisms prevalent in SIBO (28): the anaerobe Bacteroides thetaiotaomicron (Bt) that breaks down complex carbohydrates (e.g. dextran) into simple sugars and short chain fatty acids (29), and the facultative anaerobe (aerobe) Klebsiella pneumoniae (Kp) capable of consuming oxygen, simple sugars and short chain fatty acids (30).
Results and Discussions
To simulate how the interplay between environmental perturbations and inter-species metabolic interactions could lead to multi-stability, we first built a mathematical model. We used the dynamic multi-species metabolic modeling (DMMM) framework (31) to model a community of Kp and Bt in a continuously stirred tank reactor (CSTR) (Fig. 1.1A) with continuous input flows of dextran minimal media, glucose, and oxygen. The DMMM framework uses dynamic flux balance analysis (dFBA) (32), which allows us to capture temporal changes in intracellular flux rates (using the genome-scale metabolic model for each species), extracellular metabolite concentrations, and species concentrations.
Next, to computationally test whether a nutrient perturbation could lead to a change in community state, we altered glucose input concentrations (Fig. 1.2A), while keeping constant all other system parameters, including oxygen input and dextran input. The model predicted that for glucose concentrations of 0.25–3 mM in the input feed (at a constant flow rate 0.7 mL/min for all conditions), the output state consisted solely of Kp, which we refer to as the Kp-only state (Fig. 1.1B). Stoichiometrically, at these glucose concentrations oxygen was not completely consumed, thus the environment was unfavorable for Bt growth. However, when we increased glucose input concentration to 3.25 mM, we observed a shift to a new steady state (Fig. 1.2A). At this “tipping point,” the environment became sufficiently anaerobic to support the growth of Bt. We refer to this second distinct steady state as the Kp–
Bt (aerobe–anaerobe) state (Fig. 1.1C). In the Kp–Bt state, Kp uses all of the available oxygen to oxidize both glucose and the simple sugars generated from the metabolism of dextran by
Bt, resulting in anaerobic conditions. Surprisingly, this Kp–Bt state persisted even when we systematically reversed the input of glucose below 3.25 mM, even to 0 mM. Thus, this system shows hysteresis and bi-stability: under identical input conditions of glucose and oxygen, the system can be in either of the two possible states. We then identified tipping points for population shifts in response to input oxygen variations—with glucose kept constant (Fig. 1.2B). We found that we could return the system to the Kp-only state by increasing oxygen levels, a state switch that was not possible by manipulating glucose concentration alone. Finally, we simulated changes in both glucose and oxygen levels and characterized the landscape of bi-stability and mono-stability in the model microbial community (Fig. 1.2C). These simulation results illustrate that even a minimal model of microbiome with co-dependence (33) can demonstrate dramatic MSH.
We next tested these computational predictions experimentally in a CSTR, and further explored the metabolic factors behind the dynamics of this aerobe–anaerobe community. We varied glucose concentrations and measured the steady state output composition of the microbial community by qPCR. Oxygen was introduced into the reactor by aeration at 3.4%
of the gas feed (50 mL/min total gas feed) and kept constant for all conditions. For each steady-state condition, we collected three CSTR samples separated by at least one residence time.
As predicted by the mathematical models, we observed both bi-stability and hysteresis (Fig.
1.3A) experimentally. At 0.25 mM, 1 mM, and 2 mM glucose concentrations, the steady- state community consisted only of Kp; Bt was washed out under these conditions (Fig. 1.3B).
The dissolved-oxygen measurements (Fig. 1.3C) confirmed that oxygen was not limiting under the selected parameter conditions, resulting in an aerobic environment unsuitable for Bt growth. As in the simulations, at 5 mM glucose, a new distinct steady state was reached where Bt grew in the presence of Kp. Although there was continuous oxygen flux into the reactor, the concentration of dissolved oxygen measured in the reactor was near zero. Next, to test for hysteresis, we reduced the glucose input back down to 2 mM, 1 mM, 0.25 mM, and 0 mM and found that the aerobe–anaerobe state persisted. The persistence of the Kp–Bt
state (instead of a return to the Kp-only state), confirmed hysteresis and verified that this microbial community is a bi-stable system.
The CSTR results demonstrate metabolic coupling between bacterial species with respect to carbon and oxygen. At sample point 8, there is no glucose input to the reactor, yet Kp continued to grow, therefore Kp was completely dependent on Bt for its carbon supply. At sample point 4, Bt started to grow, despite the continuous oxygen input, therefore Bt was dependent on removal of oxygen by Kp. At sample points 7 (0.25 mM glucose) and 8 (0 mM glucose), Bt continued to grow, despite dissolved-oxygen measurements indicating oxygen concentrations above the tolerance for Bt growth (Fig. 1.3C). This observation differed slightly from the model, suggesting that there may be additional biological factors beyond metabolic coupling and stoichiometric balance that can affect bi-stability. Imaging revealed that in the Kp–Bt state, bacterial aggregates were larger at lower glucose concentrations.
Furthermore, fluorescent in situ hybridization (FISH) showed these aggregates contained both Kp and Bt (fig. S1.1). We hypothesize that co-aggregation provides microenvironments more favorable for Bt growth by further facilitating metabolic coupling between the two species, as observed in biofilms (4).
Gene-expression analysis of CSTR samples revealed that bi-stability also occurs at the transcriptome level in both the community and in individual species. Principal component analysis (PCA) of the community-level gene expression data showed that samples clustered based on the steady state (Kp-only vs. Kp–Bt) from which they were collected (Fig. 1.4A).
Strong clustering at the community level is expected because Bt is absent from the Kp-only state. However, when we evaluated the gene-expression profile of Kp (Fig. 1.4B), which is present in all steady state conditions, we also found clustering based on the state of the community.
To further evaluate the proposed metabolic mechanism responsible for MSH (Fig. 1.1B,C), we compared metabolic regulation in Kp in the Kp–Bt state and the Kp-only state. We used a method from the Neilsen lab (34) to collect topological information from the genome-scale metabolic models and combine it with gene-expression data to identify reporter metabolites
that maximally differ between the two states. Among the top reporter metabolites were pyruvate, phosphoenolpyruvate, glucose, and glucose-6-phosphate (table S1.3), suggesting that the phosphotransferase system (PTS), which is involved in sugar transport, is upregulated in the Kp–only state relative to the Kp-Bt state (Fig. 1.4C–D). In the Kp–Bt state, genes involved in the alpha-glucoside linked substrates were upregulated (Fig. 1.4E), suggesting that Kp obtains some of its carbon source from oligosaccharides. These oligosaccharides are released into the environment by Bt through the breakdown of dextran by dextranase, an extracellular endohydrolase (35). Bt utilizes these oligosaccharides by hydrolyzing them using glucan-1,3-alpha-glucosidases. As expected, both dextranase (dexA) and glucan-1,3-alpha-glucosidase (gaa) were found to be highly expressed in Bt in the Kp–
Bt state (Fig. 1.4E).
Our analysis (Fig. 1.4F) also suggested an upregulation of acetate utilization by Kp in the Kp–Bt state as inferred from the upregulation of acetate permease and acetyl-coenzyme A synthetase. Additionally, Kp genes involved in lactate utilization were upregulated in the Kp–
Bt state. Upon oxygen exposure, Bt is known to produce lactate (36). Bi-stability of gene expression extended to the anaerobic metabolic pathway for propanediol utilization (Fig.
1.4G), which results in formation of metabolic micro-compartments (37). We thus infer that a subpopulation of Kp was undergoing anaerobic metabolism in samples 4 and 5 (of the Kp–
Bt state), where the dissolved oxygen concentrations in the reactor were lowest (Fig. 1.3C).
Overall, these results were consistent with the basic mechanism for MSH (Figure 1B–C) and reveal that MSH extends to the expression of genes and pathways involved in metabolic coupling between the species.
In this work, we used genome-scale mathematical modeling, bioreactor experiments, transcriptomics, and control theory in a model microbiome to show that MSH is a mechanism that can describe shifts and persistence of a model microbiome aerobe–
anaerobe community under seemingly paradoxical conditions (e.g., oxygen-exposed environments). Identifying and interpreting MSH in human microbiomes and microbiome- associated diseases would require carefully designed longitudinal measurements and
models that take into account the full complexity of microbiomes, their spatial structure, and host responses. If MSH is found, it would have profound conceptual impact. To understand and control microbial communities without MSH, one currently relies on a well-established conceptual connection between correlation, causation, and control.
Consider points S1-S3 (Fig. 1.3). The levels of Kp correlate with the input glucose concentration—from a known input glucose concentration, one can infer a steady-state Kp concentration and vice versa. Input glucose concentration is the causal factor and therefore it can be used to control the steady-state levels of Kp. If MSH is identified in microbiomes, it would break this familiar conceptual connection between causation and correlation.
Consider the region of hysteresis (points S1-S3 and S5-S7, Fig. 1.3). The observed steady- state levels of Kp no longer correlate with the input glucose concentration. At 2 mM input glucose, the system could be in either the Kp-only state S3 or the Kp–Bt state S5. At
~650x106 CFU/mL of Kp, the input glucose levels could be either 0.25 mM or 2 mM.
Although there is no correlation, input glucose concentration remains the causal factor.
Furthermore, under MSH, establishing causation is insufficient for achieving control:
although input glucose concentration is the causal factor responsible for changes in the community state, it cannot be used to fully control the community (i.e. one cannot use changes in glucose inputs to revert the Kp–Bt state back to the Kp-only state). Alternative control strategies (e.g. changes in oxygen levels or disruption of metabolic coupling), derived from appropriate models, would need to be deployed under MSH. Therefore, recognizing whether and when MSH exists in human microbiomes and human diseases will be critical for interpreting correlation and causation, and for designing therapeutic control strategies that can steer microbial communities to desirable states.
Fig. 1.1 A multi-stable model system consisting of Klebsiella pneumoniae (Kp), a facultative anaerobe, and Bacteroides thetaiotaomicron (Bt), an anaerobe, that is relevant to the human gut microbiome. (A) Dynamic equations describing the model system can be solved with dynamic flux-balance analysis utilizing each species’ genome- scale metabolic model. (B) In the Kp-only state, Bt does not grow and Kp utilizes external sugars and short chain fatty acids. (C) In the Kp–Bt state, Bt can grow and break down complex polysaccharides into simple sugars and short chain fatty acids, which Kp can utilize to maintain reduced oxygen levels favorable for Bt growth.
Fig. 1.2. Simulations illustrating bi-stability and hysteresis in the microbial community with respect to environmental perturbations. Cell concentrations as a factor of (A) glucose-concentration variations in the input feed under constant input oxygen flow rate, and (B) input oxygen flow variations under constant glucose concentrations in the input feed.
Each point represents the steady-state concentration for the given species in the community after a 50-h simulation. (C) Regions of stability as a function of glucose concentrations in the input feed and oxygen flow rates into the reactor. In regions of bi-stability (circles), the community can exist in either a Kp-only state or a Kp–Bt (aerobe–anaerobe) state under the same conditions. In regions of mono-stability (triangles), the community can only exist in either a Kp-only or a Kp–Bt state.
Fig. 1.3. Bi-stability and hysteresis of K. pneumoniae (Kp) and B. thetaiotaomicron (Bt) community in a CSTR. (A) Total cell concentrations collected at the eight different steady state sample points (S1–S8) from the CSTR measured by qPCR. (B) Cell concentrations for each individual species in the community measured by qPCR. (C) pH and dissolved-oxygen concentrations measured in the CSTR for each sample point. Error bars are S.D. of three replicates collected (separated by >1 residence time) from the CSTR for each of the eight steady-state glucose conditions.
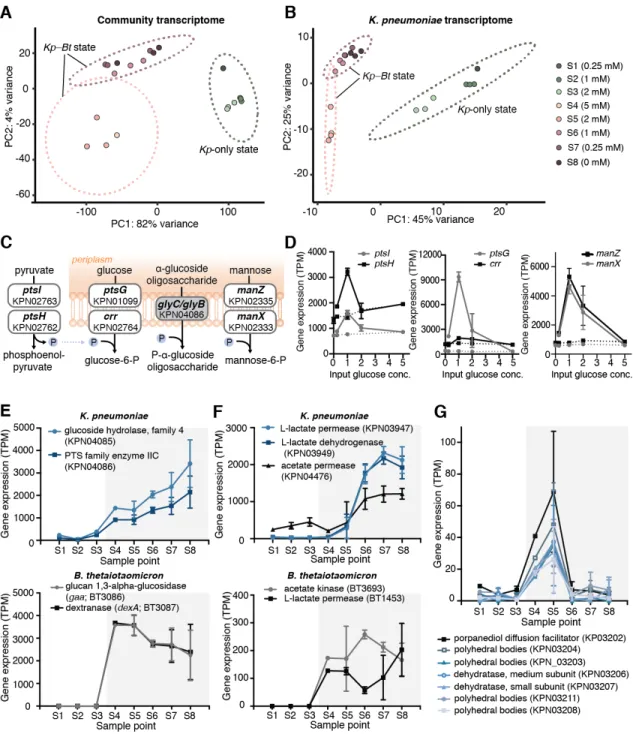
Fig. 1.4. Gene-expression analysis of CSTR steady-state samples. (A) PCA of the community transcriptome; each dot represents the combined transcriptome of K. pneumoniae (Kp) and B. thetaiotaomicron (Bt) for each sample (S1-S8). (B) PCA of the Kp transcriptome.
(C) The most differentially regulated pathway between the Kp-only and the Kp–Bt states is the phosphotransferase system (PTS); the grey box indicates the upregulated gene; white
boxes are downregulated. (D) PTS genes downregulated in the Kp–Bt state. Solid lines represent the Kp-only state and dashed lines represent the Kp–Bt state. (E) Gene expression, in transcripts per million (TPM), of oligosaccharide uptake in Kp and dextran metabolism to oligosaccharides in Bt for each steady-state sample point. (F) Expression of genes involved in acetate and lactate utilization in Kp, and acetate and lactate production in Bt for each CSTR sample. (G) Expression of the propanediol-utilization pathway in Kp. (E–G) Unshaded regions are the Kp-only state; the gray shaded region is the Kp–Bt state.
References:
1. V. Singh, S. Proctor, B. Willing, Koch's postulates, microbial dysbiosis and inflammatory bowel disease. Clin. Microbiol. and Infect. 22, 594-599 (2016).
2. L. Zhao, The gut microbiota and obesity: from correlation to causality. Nat. Rev.
Microbiol. 11, 639 (2013).
3. R. Blumberg, F. Powrie, Microbiota, disease, and back to health: a metastable journey. Sci. Transl. Med. 4, 137rv137 (2012).
4. D. Bradshaw, P. Marsh, G. Watson, C. Allison, Oral anaerobes cannot survive oxygen stress without interacting with facuItative/aerobic species as a microbial commmunity. Lett. Appl. Microbiol. 25, 385-387 (1997).
5. D. Gonze, L. Lahti, J. Raes, K. Faust, Multi-stability and the origin of microbial community types. ISME J. 11, 2159 (2017).
6. S. A. Shetty, F. Hugenholtz, L. Lahti, H. Smidt, W. M. de Vos, Intestinal
microbiome landscaping: insight in community assemblage and implications for microbial modulation strategies. FEMS Microbiol. Rev. 41, 182-199 (2017).
7. J. H. Connell, W. P. Sousa, On the evidence needed to judge ecological stability or persistence. Am. Nat. 121, 789-824 (1983).
8. M. Hirota, M. Holmgren, E. H. Van Nes, M. Scheffer, Global resilience of tropical forest and savanna to critical transitions. Science 334, 232-235 (2011).
9. A. Schröder, L. Persson, A. M. De Roos, Direct experimental evidence for alternative stable states: a review. Oikos 110, 3-19 (2005).
10. T. Bush et al., Oxic-anoxic regime shifts mediated by feedbacks between
biogeochemical processes and microbial community dynamics. Nat. Commun. 8, 789 (2017).
11. O. S. Venturelli, H. El-Samad, R. M. Murray, Synergistic dual positive feedback loops established by molecular sequestration generate robust bimodal response.
Proc. Natl. Acad. Sci. U.S.A. 109, E3324-E3333 (2012).
12. D. Dubnau, R. Losick, Bistability in bacteria. Mol. Microbiol. 61, 564-572 (2006).
13. J. E. Ferrell Jr, Self-perpetuating states in signal transduction: positive feedback, double-negative feedback and bistability. Curr. Opin. Cell Biol. 14, 140-148 (2002).
14. G. D. Wu et al., Linking long-term dietary patterns with gut microbial enterotypes. Science 334, 105-108 (2011).
15. F. Hildebrand et al., Inflammation-associated enterotypes, host genotype, cage and inter-individual effects drive gut microbiota variation in common laboratory mice. Genome Biol. 14, R4 (2013).
16. Y. Zhou et al., Exploration of bacterial community classes in major human habitats. Genome Biol. 15, R66 (2014).
17. T. Ding, P. D. Schloss, Dynamics and associations of microbial community types across the human body. Nature 509, 357 (2014).
18. J. Ravel et al., Vaginal microbiome of reproductive-age women. Proc. Natl. Acad.
Sci. U.S.A. 108, 4680-4687 (2011).
19. M. Arumugam et al., Enterotypes of the human gut microbiome. Nature 473, 174 (2011).
20. G. Falony et al., Population-level analysis of gut microbiome variation. Science 352, 560-564 (2016).
21. D. Gevers et al., The treatment-naive microbiome in new-onset Crohn’s disease.
Cell Host Microbe. 15, 382-392 (2014).
22. I. Cho, M. J. Blaser, The human microbiome: at the interface of health and disease. Nat. Rev. Genet. 13, 260 (2012).
23. L. Lahti, J. Salojärvi, A. Salonen, M. Scheffer, W. M. De Vos, Tipping elements in the human intestinal ecosystem. Nature Commun. 5, 4344 (2014).
24. M. Scheffer et al., Early-warning signals for critical transitions. Nature 461, 53 (2009).
25. P. Gajer et al., Temporal dynamics of the human vaginal microbiota. Sci. Transl.
Med. 4, 132ra152-132ra152 (2012).
26. L. Dethlefsen, D. A. Relman, Incomplete recovery and individualized responses of the human distal gut microbiota to repeated antibiotic perturbation. Proc. Natl.
Acad. Sci. U.S.A. 108, 4554-4561 (2011).
27. C. Jernberg, S. Löfmark, C. Edlund, J. K. Jansson, Long-term ecological impacts of antibiotic administration on the human intestinal microbiota. ISME J. 1, 56 (2007).
28. Y. Bouhnik et al., Bacterial populations contaminating the upper gut in patients with small intestinal bacterial overgrowth syndrome. Am. J. Gastroenterol. 94, 1327-1331 (1999).
29. A. Heinken, S. Sahoo, R. M. Fleming, I. Thiele, Systems-level characterization of a host-microbe metabolic symbiosis in the mammalian gut. Gut Microbes. 4, 28- 40 (2013).
30. Y. C. Liao et al., An experimentally validated genome-scale metabolic
reconstruction of Klebsiella pneumoniae MGH 78578, iYL1228. J. Bacteriol.
193, (2011).
31. K. Zhuang et al., Genome-scale dynamic modeling of the competition between Rhodoferax and Geobacter in anoxic subsurface environments. ISME J. 5, 305 (2011).
32. R. Mahadevan, J. S. Edwards, F. J. Doyle III, Dynamic flux balance analysis of diauxic growth in Escherichia coli. Biophys. J. 83, 1331-1340 (2002).
33. O. S. Venturelli et al., Deciphering microbial interactions in synthetic human gut microbiome communities. Mol. Syst. Biol. 14, e8157 (2018).
34. K. R. Patil, J. Nielsen, Uncovering transcriptional regulation of metabolism by using metabolic network topology. Proc. Natl. Acad. Sci. U.S.A. 102, 2685-2689 (2005).
35. D. A. Ravcheev, A. Godzik, A. L. Osterman, D. A. Rodionov, Polysaccharides utilization in human gut bacterium Bacteroides thetaiotaomicron: comparative genomics reconstruction of metabolic and regulatory networks. BMC Genomics.
14, 873 (2013).
36. S. Mishra, J. A. Imlay, An anaerobic bacterium, Bacteroides thetaiotaomicron, uses a consortium of enzymes to scavenge hydrogen peroxide. Mol. Microbiol.
90, 1356-1371 (2013).
37. E. I. Tocheva et al., Structure and expression of propanediol utilization
microcompartments in Acetonema longum. J. Bacteriol. 196, 1651-1658 (2014).
38. J. D. Orth, I. Thiele, B. Ø. Palsson, What is flux balance analysis? Nat.
Biotechnol. 28, 245 (2010).
39. W. R. Harcombe et al., Metabolic resource allocation in individual microbes determines ecosystem interactions and spatial dynamics. Cell Rep. 7, 1104-1115 (2014).
40. G. Gosset, Improvement of Escherichia coli production strains by modification of the phosphoenolpyruvate: sugar phosphotransferase system. Microb. Cell Fact. 4, 14 (2005).
41. E. Wolin, M. J. Wolin, R. Wolfe, Formation of methane by bacterial extracts. J.
Biol. Chem. 238, 2882-2886 (1963).
Supplementary Materials Materials and Methods
Model development
For the computational simulations, we used the dynamic multispecies metabolic modeling (DMMM) framework (31), which is an extension of dynamic flux balance analysis applied to microbial communities. The system is described as a continuous stirred tank reactor (CSTR) with the following mathematical formulation:
!"
!# = 𝐹&'− 𝐹)*# (1)
!+,
!# = 𝜇&𝑋& −/012"+, (2)
!34
!# = 𝑣&6𝑋&+/,839::;
4 </01234
"
& (3)
!30=>?:8
!# = &𝑣&)@ABC'𝑋& + 𝐾E𝑎(𝑆∗− 𝑆)@ABC') (4) Here, V, is the volume of the reactor, 𝑋& is the biomass (g/L) of the ith microbial species. 𝑆6 is the concentration (mM) of the jth metabolite, 𝐹&' is the rate of flow (L/h) into the reactor, 𝐹)*# is the rate of flow (L/h) out of the reactor, 𝑆KCC!6 is the concentration of the jth metabolite in the feed stream, 𝜇& (h-1) is the growth rate of the ith microbial species, and 𝑣&6 is the metabolic flux of the jth substrate in the ith microbial species. The set of differential equations are solved using the following analytical approximation:
𝑉K= 𝑉M + (𝐹&'− 𝐹)*#)∆𝑇 (5)
𝑋K= 𝑋&,M𝑒 S,<T,8UV ∆W (6)
𝑆K6 = 𝑆M6+ [𝑣&6S "V
,"V</,8(𝑋&,M
& 𝑒 S,<T,8UV ∆W − 𝑋&,M)] +/,8(39::;
4 <34)
"V ∆𝑇 (7)
At the beginning of every time step (∆𝑇), the parameters 𝜇& and 𝑣&6 are calculated using flux
balance analysis (FBA) from genome-scale models and fed back into equations (5) and (6).
This process is repeated for all time intervals in the simulated time period. Genome-scale metabolic models are used to establish genotype-phenotype relationships and capture the metabolic capabilities of each model organism. We used the published iYL1228 model of Klebsiella pneumoniae (Kp) MGH 78578 (30) and the published iAH991 model of Bacteroides thetaiotaomicron (Bt) VPI 5482 (29). A pathway for dextran uptake and hydrolysis to glucose was added to the iAH991 model. The pathway lumps hydrolysis of dextran to glucose into a single reaction. In this lumped reaction, we assume that 50% of the glucose produced from dextran by Bt can be released into the environment for shared use.
For the purpose of the simulations, dextran is assumed to be 100 glucose units. The genome- scale models are solved by flux balance analysis (FBA) (38) at each time point:
max 𝑐W𝑣^ (8)
𝑠. 𝑡. 𝐴&𝑣^ = 0 𝑣&,de < 𝑣^ < 𝑣&,*e
where c is the cost vector, 𝑣 is the vector of fluxes, and A is the matrix of mass balance stoichiometries. The uptake fluxes are bounded by Michaelis–Menten kinetics:
𝑣&,*e6 = 𝑣&6,gh@i 34
jk34 (9) The values for 𝑣&6,gh@ and 𝐾g for some of the metabolites in the model were estimated from batch experiments. Batch culture experiments were carried out in a 96-well flat- bottom plate. Overnight cultures were grown anaerobically in minimal medium. Either 0.5% w/v dextran or 0.5% w/v glucose were diluted 1:20 (for Bt) and 1:100 (for Kp), and outgrown to mid-log phase. The cultures were then pelleted and re-suspended at OD 1 (for Bt) and OD 0.1 (for Kp) in carbon-free minimal medium. We added 10 µL of cells to 200 µL of minimal medium containing various concentrations (0.125 – 0.5% w/v) of the carbon source. The plate was incubated at 37 °C and OD600 measured every 10 min. For batch cultures, Monod growth kinetics was assumed:
!+
!# = 𝑋𝜇gh@ 3
3ki (10)
!3
!# = −𝑣gh@ 3
3ki (11) Growth data from replicate wells of multiple concentrations of carbon source were fitted simultaneously using Bayesian parameter estimation implemented with Markov chain Monte Carlo (MCMC). Individual growth curves were allowed to have distinct initial cell concentrations and background values, with other parameters held constant. The fitted parameters are presented in Table S1 and Fig S1. For all other metabolites captured in the differential equations, the Km and vmax values are assumed to be the same (vmax of 10 mmol/gCDW⋅h and Km of 0.01 mM), based on literature for Escherichia coli (39, 40).
Values for parameters and initial conditions used in the model are presented in Table S2.
Initial conditions are chosen to represent experimental setup, whereby we first establish a steady state for Kp in the CSTR before inoculating Bt. Therefore, in the models we start with a higher concentration of Kp than Bt. The initial conditions for Kp in the reactor is arbitrarily chosen to be the experimentally measured mono-culture steady concentration of Kp at an input glucose concentration of 0.25 mM. The initial conditions for Bt in the reactor is 0.0015 g/L, which is equivalent to addition of 1 mL of OD 1 Bt into the reactor, as done experimentally. For most steady state conditions, glucose is limiting and therefore the initial conditions for glucose concentration in the reactor is chosen to be 0mM.
To computationally identify the regions of stability with respect to glucose and oxygen (Fig. 2C and Fig. S3), we varied oxygen input flow rates at constant input glucose concentration for each glucose condition examined. We evaluated 11 glucose conditions ranging from 1 mM to 6 mM. For each given glucose input concentration, we started with oxygen at an input flow rate of 6 mL/min and ran the simulation for 50 h to ensure the system reached a steady state. We then decreased the oxygen input by 0.5 mL/min intervals down to 0.5 mL/min, for each oxygen condition, ensuring the system reached a steady state (we refer to the 6mL/min - 0.5mL/min oxygen variations for a given constant glucose input concentration as the “forward simulations”). The concentration of oxygen input at which
Bt starts to grow is identified as the “tipping point” to the mono-stable Kp–Bt state. After running the 0.5mL/min oxygen simulation we increased the concentration back to 6 mL/min at intervals of 0.5 mL/min (we refer to the 0.5 mL/min - 6 mL/min oxygen variations as the “reverse simulations”). The concentration of oxygen at which Bt can no longer grow and gets washed out is identified as “tipping point” to the mono-stable Kp- only state. The region between these two tipping points to the mono-stable Kp–Bt state in the forward simulations and the mono-stable Kp-only state in the reverse simulations is identified as the region of bi-stability. The colors in Fig. S3 represent the steady state concentration of Kp in the “reverse simulations” divided by the steady state concentration of Kp in the “forward simulations.” In regions of mono-stability, the concentration of Kp is similar in both the “forward” and “reverse simulations”, and therefore has a value of approximately 1.
Continuous culture of K. pneumoniae and B. thetaiotaomicron
Continuous culture experiments were carried out in a 500 mL bioreactor (Mini-bio Applikon Biotechnology, Delft, Netherlands) with a total culture volume of 200 mL. Minimal media (3.85 g/L KH2PO4, 12.48 g/L K2HPO4, 1.125 g/L (NH4)2SO4, 1X MMS (20X MMS: 17.6 g/L NaCl, 0.4 g/L CaCl2, 0.4 g/L MgCl2×6H2O, 0.2 g/L MnCl2×4H2O, 0.2 g/L CoCl2×6H2O), 10 mL/L Wolfe’s mineral solution(41), 10 mL/L Wolfe’s vitamin solution(41), 4.17 µM FeSO4×7H20, 0.25 mM cysteine, 1 µM menadione, 2 µM resazurin, 1 g/L dextran (Sigma D5376, avg. mol. wt 1.5e6-2e6) and glucose at varying concentrations) was purged with 100% N2, stored under anaerobic conditions prior to use, and maintained under N2 during operation of CSTR. The bioreactor was aerated with 50 mL/min total gas (1.7 mL/min O2, 5 mL/min CO2, and balance of N2), and agitated with two six-bladed Rushton turbines operated at 750 rpm. Temperature was maintained at 37°C, and a residence time of 5 h (40 ml/h flowrate) was used for all experiments. Dissolved oxygen, pH, and biomass were monitored throughout. For initial inoculation of Kp, 1 mL of OD 1 culture was injected through the septum, and grown in batch culture until stationary phase (indicated by levelling of the biomass reading and increase of dissolved oxygen levels) before beginning
continuous culture. For each steady-state condition, three samples separated by at least one residence time were collected. For introduction of Bt, a log phase (OD 0.6-0.8) anaerobic culture grown in minimal media with 0.5% dextran and 2mM cysteine was pelleted (5 min at 3500 g) and washed twice using dextran/glucose-free anaerobic minimal media. Cells were carbon-starved at 37 °C for 30 min, washed (once), and re-suspended in dextran/glucose-free minimal media to OD 1. We used 1 mL of this Bt cell suspension for inoculation into the reactor and a sample was collected immediately after inoculation. A subsequent sample was collected for quantification after at least 2 residence times had passed. In the Kp-only state conditions (0.25 mM, 1 mM, 2 mM glucose), Bt is washed out, as described in the results section. To ensure reproducibility of a washout for these conditions, the Bt inoculation and sample collection process was repeated a total of three times. In Kp–Bt state conditions (5 mM, 2 mM, 1 mM, 0.25 mM, and 0 mM glucose), where Bt growth persisted, re-inoculation of Bt was no longer necessary for each new glucose steady state condition; three samples separated by at least one residence time were collected for each steady state condition. To collect samples, ~0.5 mL of culture was removed from the bioreactor in a 3 mL luer-lock syringe and discarded before collection of 1.5–2 mL culture. Supernatant from 700 µL of the collected sample was stored at -80 °C for SCFA analysis, a 50 µL sub-sample was treated with DNAse (2.5 µL of NEB DNase I 2000 u/mL per 50 µL) for subsequent DNA extraction, and two 250 µL aliquots were used for extraction of RNA.
Quantification of bacterial abundance
Chemostat culture samples were treated with NEB DNAse I (100 u/mL final concentration) for 10 min at 37°C immediately after collection. DNA was extracted using the ZyGEM prepGEM™ Bacteria kit (ZyGEM, Southampton, England) according to the manufacturer’s protocol. Samples were extracted in 100 uL total volume (20 µL culture sample and 80 µL of extraction mixture), incubated at 37 °C for 15 min, 75 °C for 5 min, 95 °C for 5 min, then cooled to 4 °C. DNA was stabilized by adding 10X TE to a final concentration of 1X TE before storage at 4 °C. Extracted DNA was quantified by qPCR using the Eco Real-time PCR system (Illumina, San Diego, CA, USA). The components in the qPCR mix used in this
study were as follows: 1 µL of extracted DNA, 1X SsoFast™ EvaGreen Supermix (Bio-Rad Laboratories, Hercules, CA, USA), 500 nM forward primer, and 500 nM reverse primer. For detection of each bacterial species in the community primer sets specific to Bt (forward primer: 5′-GGAGTTTTACTTTGAATGGAC-3′; reverse primer: 5′-
CTGCCCTTTTACAATGGG-3’) and Kp (forward primer: 5′-
ATTTGAAGAGGTTGCAAACGAT-3′; reverse primer: 5′-
TTCACTCTGAAGTTTTCTTGTGTT-3′) were used. Quantification of cell concentrations were determined using DNA standards of single species prepared using 10X serial dilutions of log phase cultures extracted as above. Cell concentrations of standards were determined by hemocytometer. For conversion of OD and cell concentration to biomass concentration (gram cell dry weight/L), 100 mL of culture for each individual species incubated anaerobically at 37 °C was harvested and pellets were dried at 80°C for ~48 h before recording mass.
RNA sequencing and analysis
From the chemostat samples, a 250 µL aliquot was used for RNA extraction. The freshly collected chemostat sample was immediately placed into Qiagen RNAprotect Bacteria Reagent (Qiagen, Hilden, Germany) for RNA stabilization. RNA was extracted using the Enzymatic Lysis of Bacteria protocol of the Qiagen RNeasy Mini Kit and processed according to the manufacturer’s protocol. DNA digestion was performed during extraction using the Qiagen RNase-Free DNase Set. The quality of extracted RNA was measured using an Agilent 2200 TapeStation (Agilent, Santa Clara, CA, USA). Extracted RNA samples were prepared for sequencing using the NEBNext Ultra RNA Library Prep Kit for Illumina (New England Biolabs, Ipswitch, MA, USA) and the NEBNExt Multiplex Oligos for Illumina.
Libraries were sequenced at 100 single base pair reads and a sequencing depth of 10 million reads on an Illumina HiSeq 2500 System (Illumina, San Diego, CA, USA) at the Millard and Muriel Jacobs Genetics and Genomics Laboratory, California Institute of Technology. Raw reads from the sequenced libraries were subjected to quality control to filter out low-quality reads and trim the adaptor sequences using Trimmomatic (v. 0.35). Reads that aligned to
rRNA and tRNA of Bt and Kp were first removed, as those sequences contain overlapping reads between the two species. Each sample was then separately aligned to Bt VPI-5482 (Genome accession number: GCA_000011065.1) and Kp MGH-78578 (Genome accession number: GCA_000016305.1) using Bowtie2 (v. 2.2.5) and quantified using the Subread package (v. 1.5.0-p1). Gene expression was defined in transcripts per million (TPM) for each species.
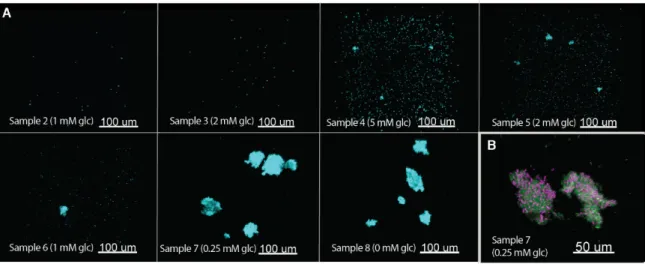
Fig. S1.1. Imaging of samples collected from the continuously stirred tank reactor experiments. (A) Total bacteria staining of each sample using DAPI (B) The species composition of aggregates using the GAM42a (green) and CFB560 probe (pink) for Gammaproteobacteria and Bacteroidetes, respectfully.
Fig. S1.2. Bayesian parameter fitting of K and vmax to experimental batch growth data for (A) Klebsiella pneumoniae on glucose (B) Bacteroides thetaiotaomicron on glucose, and (C) Bacteroides thetaiotaomicron on dextran. Two technical replicates were used for each concentration of substrate examined.
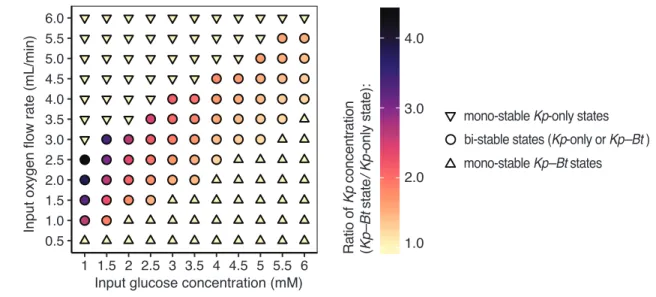
Fig. S1.3. A quantitative view of regions of stability as a function of glucose concentrations in the input feed and oxygen flow rates into the reactor. In regions of bi- stability (circles), the community can exist in either a Kp-only state or a Kp–Bt (aerobe–
anaerobe) state under the same conditions. In regions of mono-stability (triangles), the community can only exist in either a Kp-only or a Kp–Bt state. Deviation from yellow indicates the increase of Kp concentration in the Kp–Bt state relative to the Kp-only state (e.g. concentration of Kp in Kp–Bt state divided by the concentration of Kp in the Kp-only state).
0.5 1.0 1.5 2.0 2.5 3.0 3.5 4.0 4.5 5.0 5.5 6.0
1 1.5 2 2.5 3 3.5 4 4.5 5 5.5 6
Input oxygen flow rate (mL/min)
1.0 2.0 3.0 4.0
bi-stable states (Kp-only or Kp–Bt ) mono-stable Kp–Bt states
mono-stable Kp-only states
Ratio of Kp concentration (Kp–Bt state/ Kp-onlystate):
Input glucose concentration (mM)
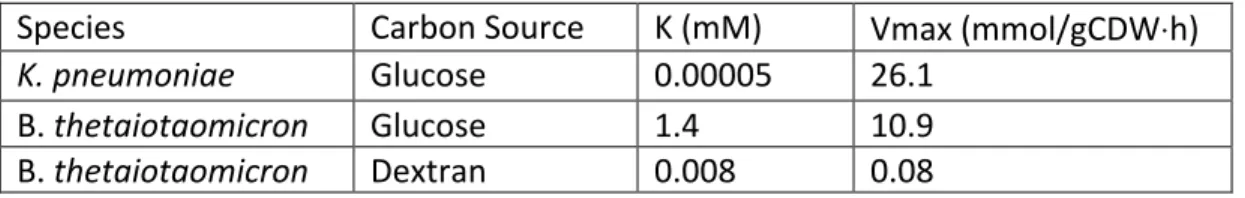
Table S1.1. Bayesian parameter estimation for K and vmax used in the Michaelis–
Menten equations to constrain nutrient uptake flux rates for flux balance analysis calculations.
Species Carbon Source K (mM) Vmax (mmol/gCDW⋅h)
K. pneumoniae Glucose 0.00005 26.1
B. thetaiotaomicron Glucose 1.4 10.9
B. thetaiotaomicron Dextran 0.008 0.08
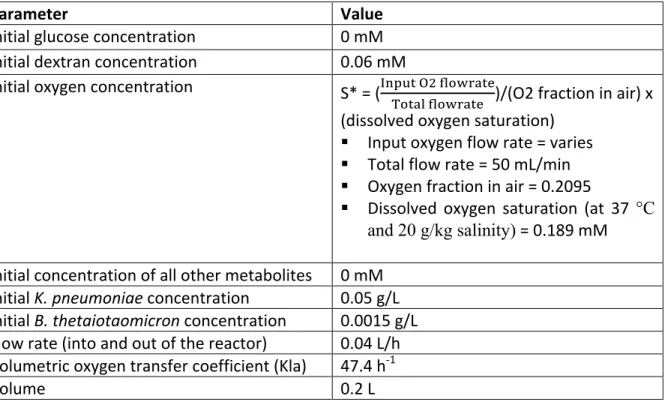
Table S1.2. Values for the parameters used in the dynamic flux balance analysis simulations.
Parameter Value
Initial glucose concentration 0 mM
Initial dextran concentration 0.06 mM
Initial oxygen concentration S* = (lmnop qr stuvwxpy
zupxt stuvwxpy )/(O2 fraction in air) x (dissolved oxygen saturation)
§ Input oxygen flow rate = varies
§ Total flow rate = 50 mL/min
§ Oxygen fraction in air = 0.2095
§ Dissolved oxygen saturation (at 37 °C and 20 g/kg salinity) = 0.189 mM Initial concentration of all other metabolites 0 mM
Initial K. pneumoniae concentration 0.05 g/L Initial B. thetaiotaomicron concentration 0.0015 g/L Flow rate (into and out of the reactor) 0.04 L/h Volumetric oxygen transfer coefficient (Kla) 47.4 h-1
Volume 0.2 L
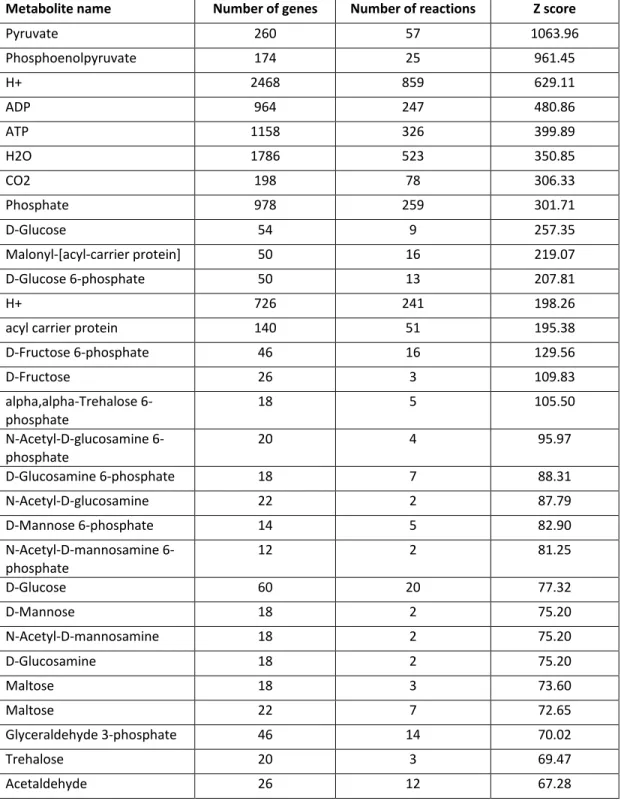
Table S1.3. The top scoring 50 metabolites involved in the most regulated metabolic pathways, ordered by Z score value. This analysis was performed using gene
expression data between samples S8 and S3.
Metabolite name Number of genes Number of reactions Z score
Pyruvate 260 57 1063.96
Phosphoenolpyruvate 174 25 961.45
H+ 2468 859 629.11
ADP 964 247 480.86
ATP 1158 326 399.89
H2O 1786 523 350.85
CO2 198 78 306.33
Phosphate 978 259 301.71
D-Glucose 54 9 257.35
Malonyl-[acyl-carrier protein] 50 16 219.07
D-Glucose 6-phosphate 50 13 207.81
H+ 726 241 198.26
acyl carrier protein 140 51 195.38
D-Fructose 6-phosphate 46 16 129.56
D-Fructose 26 3 109.83
alpha,alpha-Trehalose 6- phosphate
18 5 105.50
N-Acetyl-D-glucosamine 6-
phosphate 20 4 95.97
D-Glucosamine 6-phosphate 18 7 88.31
N-Acetyl-D-glucosamine 22 2 87.79
D-Mannose 6-phosphate 14 5 82.90
N-Acetyl-D-mannosamine 6-
phosphate 12 2 81.25
D-Glucose 60 20 77.32
D-Mannose 18 2 75.20
N-Acetyl-D-mannosamine 18 2 75.20
D-Glucosamine 18 2 75.20
Maltose 18 3 73.60
Maltose 22 7 72.65
Glyceraldehyde 3-phosphate 46 14 70.02
Trehalose 20 3 69.47
Acetaldehyde 26 12 67.28
Maltohexaose 26 8 65.21
Maltopentaose 24 7 59.01
Formate 24 5 56.09
Sodium 42 16 54.91
D-Glucose 1-phosphate 30 10 54.58
Maltotetraose 22 6 52.09
N-acetylmuramate 6-
phosphate 10 2 48.06
Sodium 50 16 48.02
D-Galactose 22 6 47.82
D-Galactose 20 5 46.58
L-Serine 42 24 45.97
Acetate 42 17 44.94
L-Lactate 8 4 44.93
Glycerol 3-phosphate 42 15 44.41
S-Adenosyl-L-methionine 46 22 43.02
Ubiquinone-8 106 20 41.72
Maltose 6-phosphate 8 1 41.35
S-Adenosyl-L-homocysteine 40 19 41.28
Ubiquinol-8 108 21 39.82
Flavin adenine dinucleotide reduced
28 13 39.73