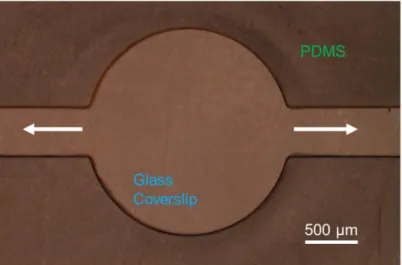
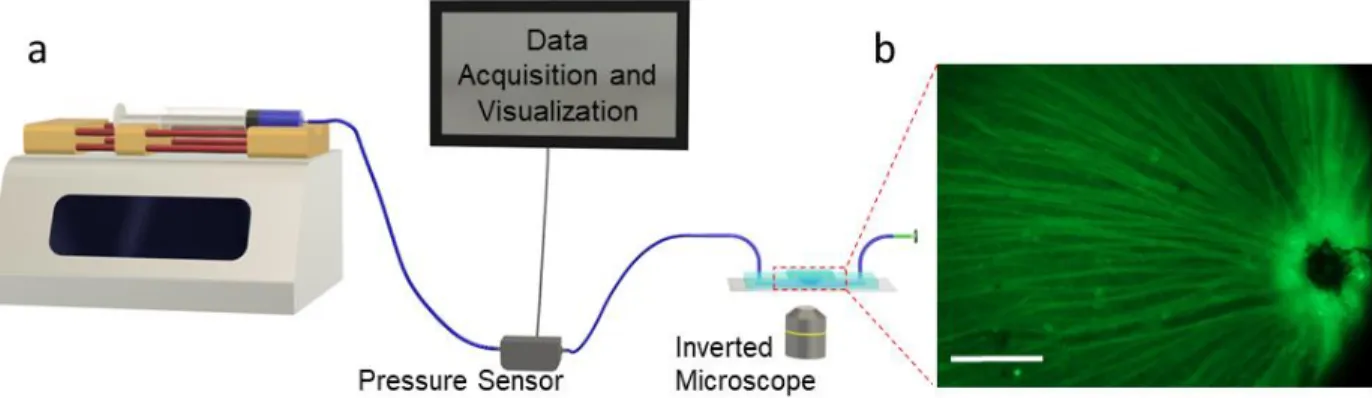
Fluorescent image of the retina placed on the final μpMEA device where the tissue is healthy. Optical image of a retina placed on top of the µpMEA device during blue food dye delivery.
Introduction to Microfluidic Platform for Retina Studies
Background
Microfluidic Platforms for Cell and Tissue Culture
- Cell Culture Systems
- Tissue Culture Systems
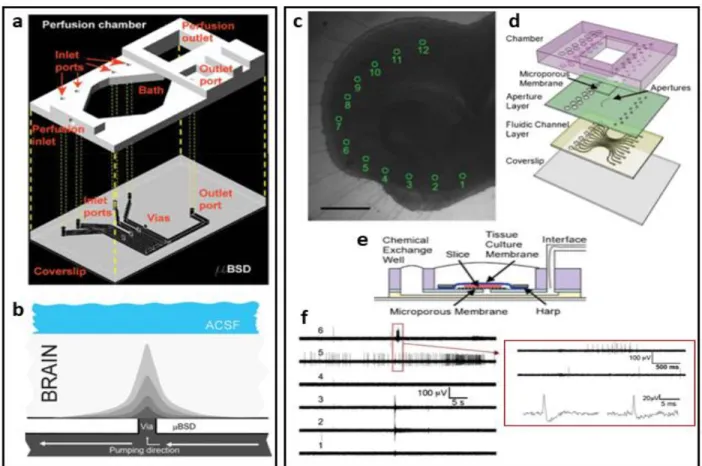
One of the major advantages of tissue culture over models consisting of individual cells is the cellular diversity and the extracellular matrix that holds cell types (tissues) together. Flow perfused through the delivery ports via passive pumping, and due to the inherently porous nature of the tissue, fluid was able to travel through the 350 μm thick samples (Figure 1.2b).

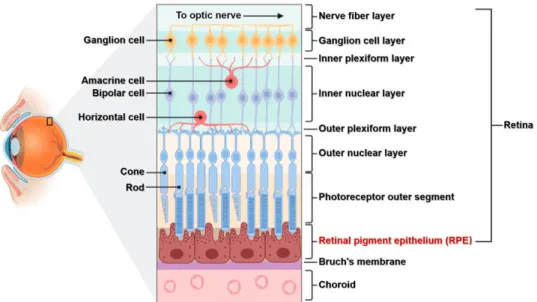
The Retina
Axons, covered by myelin, from individual RGCs join at the back of the eye to form the optic nerve head. In the case of RGCs, their individual axons bundle together at the back of the brain to form the optic nerve head.
Technologies for Probing and Sensing ex vivo Retina
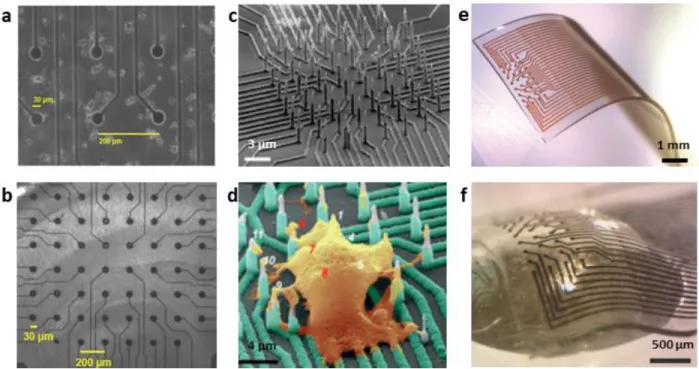
The stretchability of the PDMS substrate allows an intimate contact between the device and curved surfaces. A local, small potential change caused by the cell leads to a modulation of the transistor current.
Overview of the Dissertation
In the following sections, three microfluidic platforms with different sensing techniques that can dynamically monitor the behavior of retinal cells are presented. In addition, large-scale scanning photocurrent microscopy is used to map neuronal processes occurring in retinal explants.
Introduction to Microfluidic Platform for Retina Studies
Device Design
- Rapid, Biocompatible and Reliable Bonding
- Agarose as a Porous Medium
- Device Assembly and Experimental Set Up
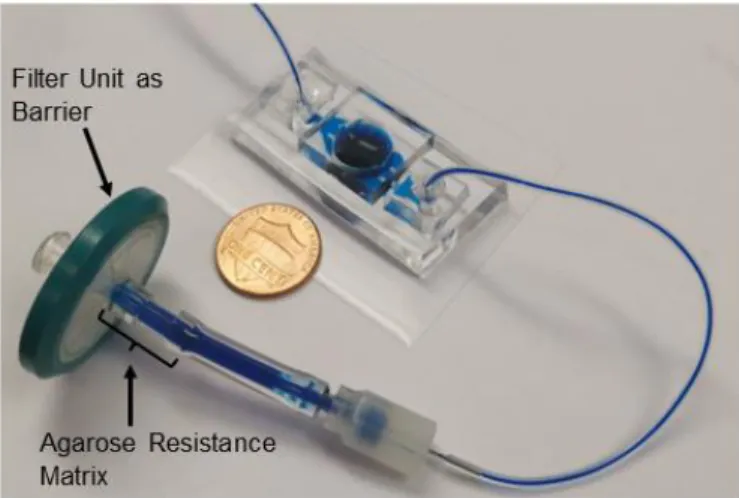
Furthermore, the explanted retina is flattened and attached to the top of the glass coverslip via an agarose support. Tygon tubing containing the porous agarose gel was attached to the outlet portion of the device via a fitter. The agarose resistance matrix encapsulated in the tubing is attached to the outlet of the platform.
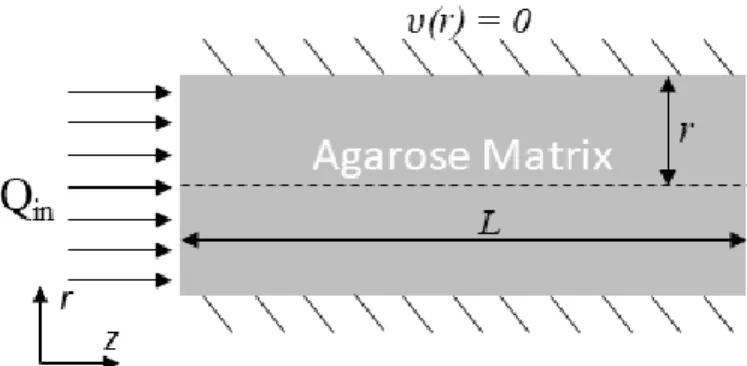
The pressure drop was measured via a manometer sensor (MPS1; Elveflow, Paris, France) connected to the inlet of the microfluidic chip.
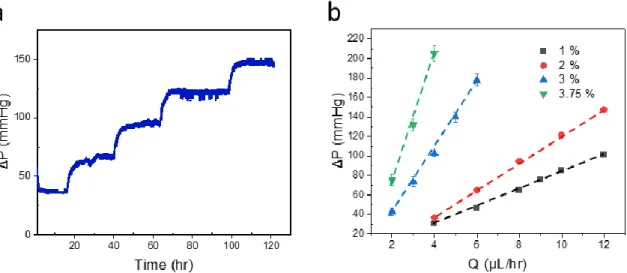
Agarose Characterization
Finally, after baseline imaging, when it was ready to increase the pressure in the chamber, the tube containing the solidified agarose was connected to the outlet tubing of the device. Flow enters the porous domain from the left side, fills the empty space of the porous structure and increases the pressure drop. Permeability measures the ability of a fluid to pass through a porous domain, which is directly related to the porosity, firmness, and deformation of the gel under tension.
To achieve and maintain desired pressures with specified flow rates, a thorough characterization of the gel permeability was performed.
Dynamic Response of Explanted Retina to Elevated Pressures
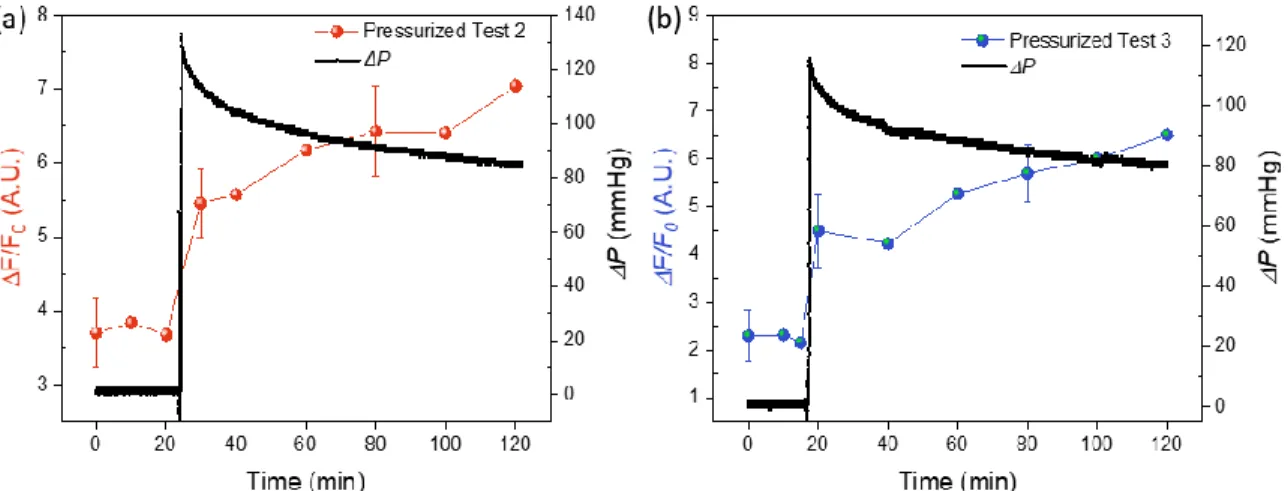
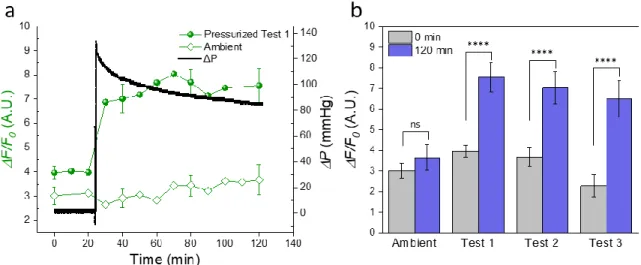
Representative trace showing ΔF/F0 studies of ambient and elevated pressure RGCs with the intracellular Ca2+ dye Fluo4-AM. Exposure to elevated pressure significantly increases intracellular calcium flux in RGCs, as reflected by an average 119.16% change in fluorescence with pressure. Exposure to elevated pressure significantly increases intracellular calcium flux in RGCs, which is reflected by 90.16%.
Exposure to elevated pressure for 40 min significantly increases intracellular calcium flux in RGCs, as reflected by a 104% change in fluorescence with pressure.
Summary
After lowering the pressure to baseline, intracellular calcium remained relatively stable for 30 min before decreasing to 72% of maximum by 120 min. To illustrate the feasibility and potential of the device, whole rat retinal tissue was used to measure dynamic changes in RGC intracellular Ca2+ in response to pressure. Previous studies of retinal cell and tissue responses to pressure have been limited by the fact that calcium influx cannot be measured at short time intervals in response to increased pressure.
An additional advantage of the microfluidic device characterized in this study is that it provides a platform to measure a wide range of pressures in tissue culture, with the possibility of measuring not only cell responses to acute and sustained increases in pressure, but even to pressure fluctuations. .
A microfluidic Perforated Microelectrode Arrays for Local Chemical Stimulation of
Device Design and Fabrication
- PDMS Open-Channel Layer
- Perforated Polyimide Layer
- Stamp-and-Stick Through Biocompatible Epoxy
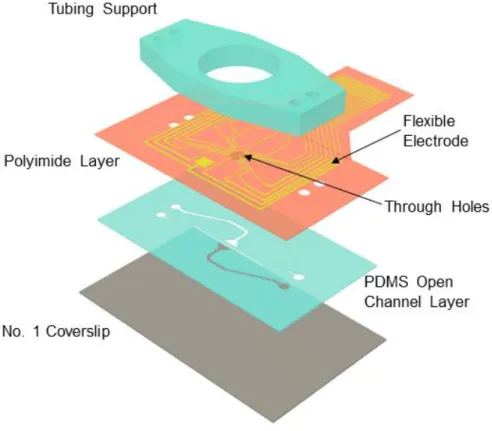
Finally, the trigger liner was peeled off, leaving the PDMS open channel structure irreversibly connected to the coverslip (Figure 3.3a – Step 4), as shown in Figure 3.4. Then, through holes were fabricated on the PI layer by photolithography and dry etching (Figure 3.3b-step 3). Finally, a 1.2 μm thick SU-8 (SU-8 2002, Microchem) film was patterned by open graphene active window photolithography (Figure 3.8d).
As can be seen in Figure 3.10a, the epoxy spread into several channels and led to blockage.
MEA Set-Up and Retina Preparation
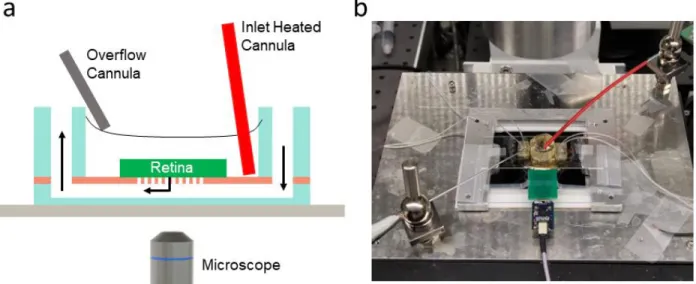
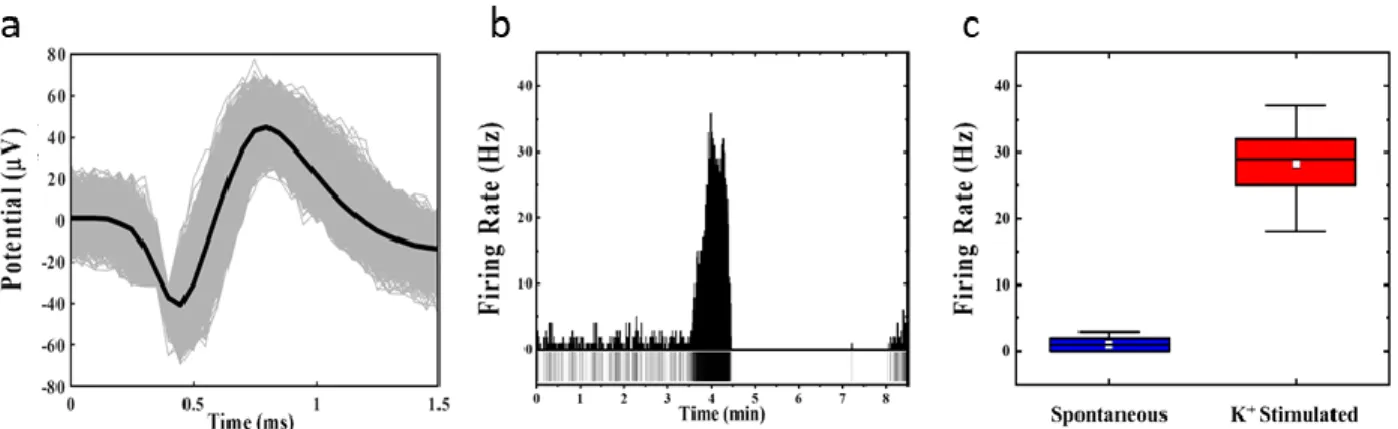
In this way, the shape of the action potential can be plotted as a function of time, showing a waveform of the nearest neurons in contact with the electrodes. Top view photo of the device mounted on the inverted microscope showing the perfusion heated inlet (red), overflow cannula (metallic silver – bottom right), suction tubing and electrical leads. To ensure the likelihood of a successful retinal experiment, three key elements are notable for retinal tissue preparation.
First, removal of the eyecup in oxygenated medium soon after sacrificing the mouse is essential to ensure that the RGC layer does not become hypoxic.
Comparison between Commercial and Custom Microfluidic-pMEA
The neuronal response during stimulation is further analyzed by studying the firing frequency of the cell, as shown in Figure 3.13b. Corresponding histogram and raster plot (carpet) of action potential firing rate as a function of time. Adding the second channel reduced the percent pressure difference to 55% (Figure 16d, Figure 17).
Statistical analysis results of the pressure distribution across the holes in three different configurations, showing a maximum percentage difference in pressure between the holes experiencing the highest and lowest negative pressure of 122%, 3% and 55%, respectively.
Local Delivery Capability of the μpMEA Platform
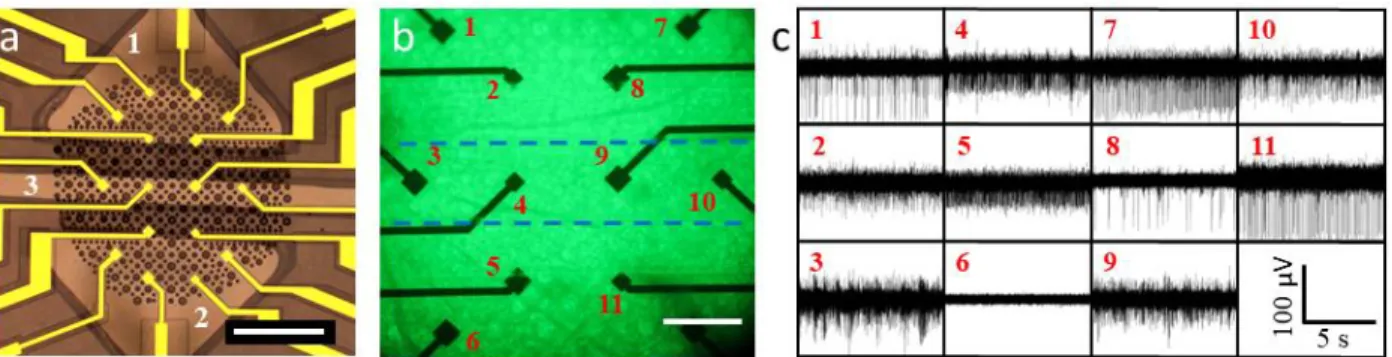
Four of the 16 electrodes were placed on the microfluidic delivery channel to measure the response of the RGCs in direct contact with the reagents flowed through the delivery channel. Once a retina was placed on top of the PI layer, a suction flow rate of 15 μl/min was started to seal the through holes with the retina and flowed in color dye to the delivery channel. Placement of the ONH directly on the delivery channel leads to poor sealing of the through holes, causing leakage from the retinal well to the delivery channel when local stimulation is performed (blue dye – Figure 3.19c,d).
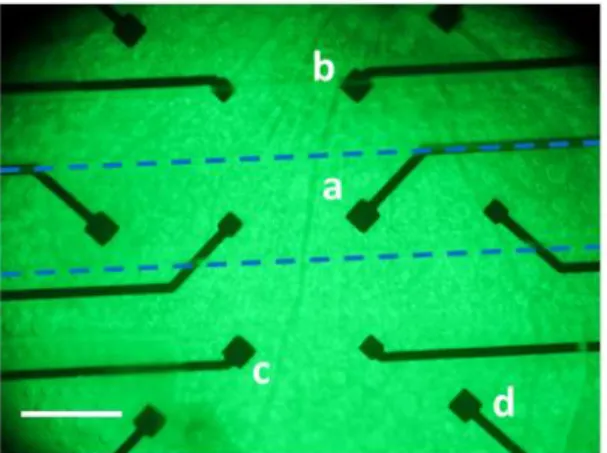
Optical and fluorescence image of a retina placed on top of the μpMEA where the ONH is partially placed on the delivery channel, causing leakage and poor sealing of the delivery channel.
Local K + Stimulation of the Retina
- Intercellular RGC Communication
Spontaneous activities of RGCs during delivery of Ames' medium observed by two electrodes from Figure 3.20 located ON the delivery channel (a), and 180 μm away from the delivery channel (b). The cells detected by the electrodes on the delivery channel displayed a standard response to high K+ stimulation (Figure 3.24a), as previously described. Interestingly, some electrodes located outside the delivery channel detected patterns similar to the electrodes located on the delivery channel.
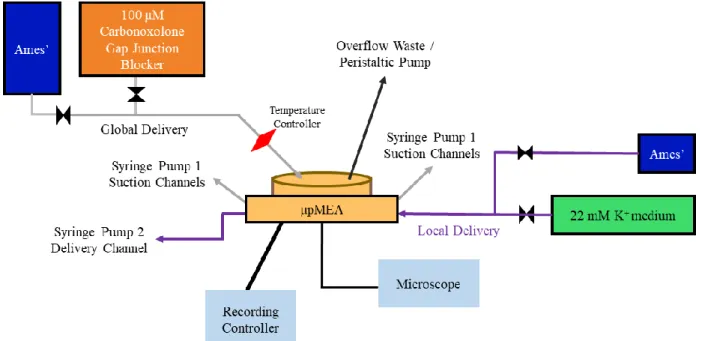
Schematic diagram showing a retina globally bathed by Ames (blue) while high K+ (green) flows through the inflow channel.
Spike Waveform Analysis
Number of detected APs located outside the delivery channel that experienced depolarization block due to locally delivered high K + stimulation while globally surrounded by Ames (blue) and global CBX (orange). Waveforms represent the mean waveform of all spikes detected during different stimulations in a single experiment.
Graphene Electrode-Based μpMEA
- Light Induced Stimulation of the Retina
- Negative Pressure Analysis through the Polyimide Perforated Membrane
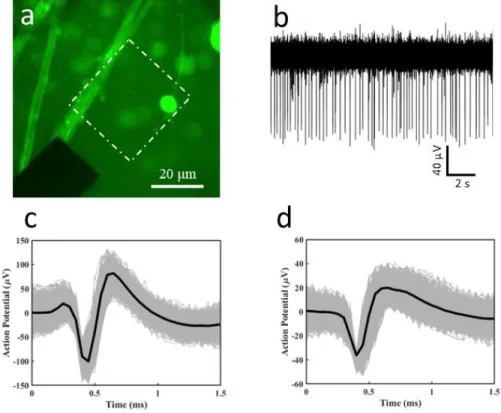
However, only biphasic spikes (Figure 3.31b-c) were recorded by the electrode, which is likely due to retinal deformability. As shown in Figure 3.20, the application of negative pressure is crucial for the detection of neuronal activity. At this focal length, the axon bundles and nerve fibers (located in the retinal layer closest to the device) are in better focus in the areas surrounding the perforations, and most of the bundles are not in the sensing region of the graphene probe.
Axon bundles are most defined on the graphene probe and the metal conductor at 7.2 μm above the reference point (Figure 3.33c).
Summary
These images clearly show that the two retinal layers closest to the probe are the nerve fiber and ganglion cell layers. The white dashed lines delineate the graphene sensing region and the red dashed circles correspond to the holes in the polyimide layer.
Integration of Graphene Field-Effect-Transistors on a Perforated Microfluidic Platform
- Design and Fabrication of the Microfluidic Platform with Integrated gFETs
- Experimental Set-Up
- Scanning Photocurrent Microscopy (SPCM)
- gFETs Characterization
- SPCM Measurements of Whole Mice Retina
A schematic of the elements related to the optoelectronic characterization of gFETs and retinal tissue is presented in Figure 4.3. Prior to biological experiments, the electrical transport properties of the graphene transistors were characterized by gate-dependent current measurements. In our experiments, photocurrent mapping of the bare graphene transistors was performed before placing the retina on the graphene transistors.
Fluorescence and photocurrent scanning images of the same graphene transistor under the retina of a THY1.2-YFP mouse, e.
Conclusion and Future Outlook
Summary
To illustrate the potential of the device, we examined the dynamic intracellular RGC Ca 2+ in response to pressure increases in the whole mouse retina. μpMEA combines electrical and visual sensing capabilities with local chemical stimulation in the pursuit of investigating intercellular communication of RGCs and their response to chemical biomarkers. In addition, transparent graphene electrodes were incorporated into the μpMEA to recover the anatomical origin of recorded action potentials by high-resolution confocal imaging.
Finally, graphene field effect transistors were adapted in the μpMEA to overcome the intrinsic spatiotemporal limitations of microelectrode arrays for extracellular electrical recordings.
Perspective and Future Outlook
Most research is conducted on electrical stimulation to reactivate activity in inner retinal regions and restore visual input.109,245 However, electrical stimulation has limitations as it simultaneously excites ON and OFF RGCs and their axons, limiting the spatial resolution of the stimulation. An alternative solution is the focal delivery of the neurotransmitter glutamate directly to the ganglion cell layer. The μpMEA platform can be used to design a series of experiments to compare the effects of the two different stimulation routes and even combine them to explore new avenues to address irreversible blindness.
By controlling the amplitude and location of the signal source relative to the transistor's graphene channel, we hope to gain a better understanding of the spatial resolution of this innovative technique as well as its limitations.
Calcium Imaging and Fluorescence Analysis
Uncertainty Analysis
A critical analysis of the available in vitro and ex vivo methods to study retinal angiogenesis. Measurements of the extracellular potassium concentrations in the isolated rabbit retina with different types of potassium-sensitive microelectrodes. Axonal transmission in the retina introduces a small spread of relative timing in the ganglion cell population response.
Long-range synchronization of oscillatory light responses in the cat retina and lateral geniculate nucleus.

![Table 2.1. Undeformed agarose concentration, porosity, length, and permeability c [g/mL] ϕ (Eq](https://thumb-ap.123doks.com/thumbv2/123dok/10732408.0/55.918.137.779.304.793/table-undeformed-agarose-concentration-porosity-length-permeability-eq.webp)