MOISTURE EXPANSION IN CERAMICS
BY
DUNCAN MARTIN
A THESIS
SUBMITTED TO THE FACULTY OF
ALFRED UNIVERSITY
IN PARTIAL FULFILLMENT OF THE REQUIREMENTS FOR THE DEGREE OF
MASTER OF SCIENCE
IN
CERAMIC ENGINEERING
ALFRED, NEW YORK
MAY, 2019
MOISTURE EXPANSION IN CERAMICS
BY
DUNCAN MARTIN
B.F.A. UNIVERSITY OF WISCONSIN-MILWAUKEE (2015)
SIGNATURE OF AUTHOR
APPROVED BY
WILLIAM M. CARTY, ADVISOR
HOLLY SHULMAN, ADVISORY COMMITTEE
WILLIAM LACOURSE, ADVISORY COMMITTEE
CHAIR, ORAL THESIS DEFENSE
ACCEPTED BY
GABRIELLE G. GAUSTAD, DEAN KAZUO INAMORI SCHOOL OF ENGINEERING
Alfred University theses are copyright protected and may be used for education or personal research only.
Reproduction or distribution in part or whole is
prohibited without written permission from the author.
Signature page may be viewed at Scholes Library,
New York State College of Ceramics, Alfred University,
Alfred, New York.
TABLE OF CONTENTS
Page
Table of Contents ... iii
List of Tables ... v
List of Figures ... vi
Abstract... ix
I. INTRODUCTION ... 1
II. LITERATURE REVIEW ... 4
A. MOISTURE EXPANSION IN CERAMICS ... 4
B. POROSITY ... 5
C. COMPOSITION AND CAUSES... 7
D. REHEAT ... 9
E. CRAZING... 10
F. AUTOCLAVE... 11
III. EXPERIMENTAL PROCEDURE ... 13
A. MATERIAL ... 13
B. SAMPLE PREPARATION ... 15
C. MEASUREMENTS ... 16
D. RELATIVE HUMIDITY ... 17
E. AUTOCLAVE... 18
F. THERMOGRAVIMETRIC ANALYSIS (TGA) AND RE-FIRE ... 20
G. DENSITY AND ABSORPTION... 21
IV. RESULTS AND DISCUSSION ... 23
A. AMBIENT RELATIVE HUMIDITY ... 23
B. AUTOCLAVE... 35
C. ROLE OF OPEN POROSITY... 36
D. COMPOSITION AND THE ROLE OF FLUX ... 44
E. RECOVERABILITY ... 52
V. SUMMARY AND CONCLUSIONS ... 56
VI. REFERENCES ... 58 VII. APPENDIX ... 61
LIST OF TABLES
Page
Table I. Weight Percentage Body Compositions ...13
Table II. Oxide Weight Percentage ...14
Table III Oxide UMF ...14
Table IV. Equilibrated Relative Humilities for Salt Solutions ...17
Table V. Equations for Ambient Moisture Expansion Rate ...32
Table VI. Equations for Autoclave Moisture Expansion Rate ...32
Table VII. Ambient and Autoclave Time Dependencies ...33
Table VIII.Water Pick Up for Various Apparent Porosities ...42
Table IX. Chemical Water Pick Up ...49
Table X. Material properties ...62
LIST OF FIGURES
Page Figure 1. Maximum rate of expansion was found to be in samples fired to around
1000°C. Moisture expansion after 2, 8, 30, and 200 hours of autoclave
exposure and natural values (N) after 90 days.25 ... 6 Figure 2. Reheating to recover expansion. High temperature reheats of 1000°C show
additional shrinkage from sintering, making the true amount of moisture recovery impossible to determine. ...10 Figure 3. Mineral component triaxial diagram of the four clay compositions in
relation to each other. ...14 Figure 4. The ratio of alumina to silica is kept at a ratio of 5:1 when the K2O + Na2O
levels are normalized to 1. ...15 Figure 5. Marking of samples. Measured in length with a micrometer. ...16 Figure 6. Equilibrium relative humidity with the use of salt solutions.31 ...18 Figure 7. Compositions #1-3 samples measured moisture expansion under three
relative humidity conditions. ...24 Figure 8. Composition #1-3 samples combined relative humidity. ...25 Figure 9. Composition #2 “Porcelain” samples initial incubation period of 20 weeks
before moisture expansion starts to occur. Barometric pressure over three years in which the measurements were taken.34 ...27 Figure 10. Ceramic body absorbing water before reaching critical volume causing
moisture expansion. ...28 Figure 11. All four compositions fired to 1000°C were subjected to the autoclave.
Each composition has a large increase in expansion after one hour in the autoclave. ...29 Figure 12. Compositions 1-3 moisture expansion on logarithmic time scale. ...31
Figure 13. Autoclave and ambient. ...34
Figure 14. Autoclave compared to ambient conditions. Composition #2 samples follow the same slope on a logarithmic scale. Autoclave at lower pressure being equivalent to around 10 years of natural moisture expansion. ...35
Figure 15. Relationship between moisture expansion and pressure. ...36
Figure 16. Composition #2 at 1000°C and 1300°C and Composition #3 at 1300°C. There is a large difference between samples at different densities and apparent porosities...37
Figure 17. Densification as a function of temperature. ...39
Figure 18. Water absorption as a function of temperature. ...39
Figure 19. Relationship between water absorption and Apparent Porosity. ...40
Figure 20. TGA recorded measurements of ceramic samples with different apparent porosity percentages that were placed in an autoclave for 1 hour. There is an initial weight loss that takes place up to 110°C of physically absorbed water leaving the specimen. The additional weight loss after 110°C is water that has been chemically absorbed. ...41
Figure 21. Physical water pick up from ceramics in relation to the apparent porosity. One hour autoclave 1900 kPa (275psi). The amount of physical water picked up depends on the ceramics apparent porosity. Higher apparent porosity percent samples have a greater physical water amount. ...43
Figure 22. Different compositions fired to attain 24.4%±2.5 apparent porosity and 11%±1.6 apparent porosity. Samples were autoclaved for 1 hour. ...45
Figure 23. Samples with 24.4%±2.5 apparent porosity have different amounts of expansion after being in an autoclave for an hour. Compositions with more flux show a greater increase in moisture expansion despite being at the same apparent porosity. The samples with 11%±1.6 apparent porosity follow the same trend. ...46
Figure 24. Additional apparent porosities and their effect on moisture expansion. ...47
Figure 25. Each composition was taken with 24.4%±2.5 apparent porosity (#1 at 1150°C, #2 at 1125°C, #3 at 1100°C, and #4 at 1050°C) and heated to 500°C in the TGA. The compositions with a higher flux amount show more moisture expansion than the compositions with a lower amount
of flux while having approximately the same apparent porosity percent. ...48 Figure 26. Ceramics limited expansion as apparent porosity approaches zero percent
and proper firing conditions. Underfired ceramics unable to form glass also show a reduction in moisture expansion. ...50 Figure 27. Map of predicted moisture expansion based on the flux amount in the
ceramic and apparent porosity when the atmosphiric conditions are kept at a constant. All samples were placed in the autoclave for one hour at 1900 kPa (275psi). ...51 Figure 28. Composition #2 (“Porcelain”) samples were placed in the autoclave at
1900 kPa for 1 hour and then reheated to 500°C. Moisture expansion
recovery occurs upon reheating. ...52 Figure 29. Composition #4 (“Low Fire Porcelain”) samples were placed in the
autoclave at 1900 kPa for 1 hour and then reheated to 500°C. Moisture expansion recovery occurs upon reheating. ...53 Figure 30. Weight loss continues at temperatures past 500°C. Ceramic samples
autoclave 1900 kPa; 1 hour...54 Figure 31. Weight loss on heating, then weight gain on cooling as water is picked up.
Composition #4 1000°C 2 hours autoclaved at 1900 kPa. ...55 Figure 32. Kerosene density. ...61
ABSTRACT
It is widely accepted that ceramic bodies are unaffected by humidity. This study examines the moisture expansion behavior of four ceramic compositions fired to produce a range of porosities. Porosity and flux level were found to the greatest contribution to moisture expansion in porcelain bodies. Samples were evaluated under ambient humidity conditions (50-98% RH for up to 2 years) and in accelerated cyclic autoclave tests (1900 kPa (275psi) for up to 5 hours) with linear expansion measured periodically. Expansion increases linearly with the log of exposure time in all experiments (ambient and autoclave). The results indicate, depending on the time spent in the autoclave, accelerated testing can approximate 1000-10,000 years in ambient conditions.
I. INTRODUCTION
Moisture expansion is an under researched characteristic of ceramics. Several studies have shown that over time there is a reaction between the ceramic and water in the air causing a volume expansion. This volume expansion can cause additional stress either between the ceramic body and the glaze, or throughout a brick or tile structure.
This expansion is most noticeable in areas with a high humidity where the water in the air reacts with the ceramic. One under looked area, where moisture expansion could be a concern, is ceramic art in museums. Museums keep the air conditions at a constant relative humidity.1 This is a standard to prevent damage to paintings caused by stretching the canvases when there are fluctuations in humidity, the result of an unregulated environment. While this constant humidity is good for preventing damage to paintings, it can be enough moisture in the air to cause moisture expansion in ceramic bodies that are kept in the same space.
Past research on moisture expansion in ceramic bodies has looked at environmental conditions that cause expansion. Ceramic bodies that are kept with a desiccant show no moisture expansion over time, while bodies kept in natural conditions can exhibit moisture expansion.2-4 Additionally, moisture expansion can be accelerated by the use of an autoclave. Using an autoclave to accelerate moisture expansion can be a useful method for testing if a ceramic body will be susceptible to moisture expansion in a few hours. Moisture expansion has been observed to occur at different rates depending on the ceramic body composition and firing conditions.2,5-8
In this study, moisture expansion was observed in ceramic bodies, such as earthenware and porcelain. Different ceramic bodies were fired at a range of temperatures in order to determine how the role of porosity and the chemical composition affects the rate of moisture expansion. Specimens were either stored in containers with a controlled humidity or subjected to an autoclave. By using analysis of both conditions, a correlation between the two was developed as a way to use autoclave specimens to predict long term natural moisture expansion. This allowed for further analysis to be done on measuring different rates of expansion as a function of porosity and chemical compositions over a short period of time.
The results of this work found that increasing the amount of flux (RO+R2O) of a ceramic body resulted in an increase in the rate of moisture expansion. This is due to water molecules chemically binding to the glass phase of the ceramic body. Increasing the flux (glass former) allowed for more space for water to bind, resulting in moisture expansion. Additionally, under-firing ceramic bodies to the point where the glass phase has yet to form showed a decrease in the rate of moisture expansion, indicating that the glass phase of the ceramic is a driving factor for moisture expansion to occur.
Porosity was found to be another factor in the rate of moisture expansion. Dense ceramic bodies, with near zero porosity, showed no moisture expansion. Increasing the porosity increases the rate of expansion as long as the firing temperature is high enough to form glass. Even without the formation of glass, moisture expansion still occurs in porous ceramic bodies due to water physically accumulating in the pores.
Based on the data collected, a model of expected moisture expansion can be created given the chemistry and porosity of the ceramic body. Porous ceramic bodies
with a high flux level will experience moisture expansion over time, and special care may be necessary for irreplaceable objects such as art work in museums. To prevent moisture expansion from occurring, a fully dense ceramic body is required. In cases were a dense body is not possible, reducing the amount of flux can help mitigate some of the moisture expansion that will occur.
II. LITERATURE REVIEW
A. Moisture Expansion in Ceramics
Moisture expansion is a volume and mass expansion that occurs in ceramic bodies that are exposed to humidity.2,4,5,9-12 Water vapor in the air reacts with ceramic over time and causes volume expansion. This expansion usually only occurs in the pores of the ceramic body and not the glaze.7,9,13-15 When the ceramic body expands, it causes stresses between the glaze and the body which can lead to crazing.14,16,17 Moisture expansion can also be a factor in causing structural damage in brick and tile due to movement after installation.2,5,6,10,14,18
There is an incomplete understanding of the causes that contribute to moisture expansion.19 The water vapor is thought, to accumulate physically in the pores20 as well as to bind chemically.6,18,21 Moisture expansion increases in volume on a logarithmic time scale if the ceramic is left in humid conditions.8,22-24 There have been several models proposed for moisture expansion.21,24 Most models use the following equation:24
ε(𝑡) = γ𝑡(1 𝑁⁄ )+ ε0 (1)
Where ε is moisture expansion.
ε0 is a rapid expansion that occurs immediately after firing.
γ is the rate of expansion.
N is a variation among ceramics ranging from ~3 to
~5.
This trend of expansion has been measured over long periods of time, in some cases samples were observed for as long as 35 years.22,24 The value of N is an intrinsic property of the ceramic body based on the temperature it is fired and the composition of the clay. Additionally, the conditions in which the ceramic body is kept, such as temperature and relative humidity, influence the expansion rate.24 There is no universal way proposed to report numbers for the rate of moisture expansion as a material property for ceramics.8 This is due to many variations between ceramic compositions and atmospheric conditions to which the ceramic is subjected.
B. Porosity
The porosity of ceramics has been shown to be a significant factor in moisture expansion.4,8,9,25 Ceramic bodies with a high porosity and water absorption will have a high-volume expansion when exposed to moisture or an autoclave. By Contrast, bodies with a low or nonexistent absorption will have little or no moisture expansion.9,16 Ceramics fired to 1000°C will gain the most in volume when exposed to moisture.2,25 Ceramic bodies that have been fired to temperatures below 1000°C, as shown in Figure 1, have a reduced expansion compared to the same composition body fired to 1000°C when kept in the same humidity conditions.2,25
Figure 1. Maximum rate of expansion was found to be in samples fired to around 1000°C. Moisture expansion after 2, 8, 30, and 200 hours of autoclave exposure and natural values (N) after 90 days.25
It is thought that the maximum moisture expansion occurring at 1000°C is caused by the development of amorphous matter.25 When heated to around 500°C metakaolin loses its water and starts to decompose. The spinel phase forms at 925°C which frees up amorphous silica, before turning into mullite at 1050-1100°C.26 This phase change frees additional amorphous silica. This amorphous silica is thought to be the cause of increased moisture expansion in ceramic bodies fired to 1000°C.25 Firing temperature is an important factor in causing moisture expansion in ceramics either due to the porosity or the phase transformations that take place at high temperatures.4,25
The more porous the ceramic body is the more surface area it has in contact with the air.
This is thought to increase the rate of moisture expansion either due to chemical absorption or water condensing in the pores.27
C. Composition and Causes
Moisture expansion also appears to be dependent on the chemical composition of the fired ceramic body.2,5-8 This is shown when ceramic bodies are fired to the same temperature with similar porosity yet vary in composition.4,14 When plotting moisture expansion versus time on a logarithmic scale, expansion follows a linear progression.
However this linear progression varies enough that no universal equation fits all ceramic bodies.7,24,25 This is due to the difference in the composition of the ceramic bodies.
Variations in atmospheric in conditions are a factor in moisture expansion.3,19 The rate and amount of moisture expansion, can also be dependent on the relative humidity that the ceramic is kept in.2,3 Moisture expansion may not occur at all in dry climates.3,19 Additionally, warmer temperatures with a humid environment have been observed to increase the rate of expansion in ceramic tiles compared to colder environments with the same relative humidity.7,8
Several theories have been put forward that explain the mechanics of moisture expansion. One theory is that the water vapor accumulates both physically and chemically, which expands the volume as more water is added.6,21 It has been suggested that the pores physically filling with water does not permanently increase the moisture expansion.6 The water that accumulates in the pores of the ceramic is thought to only increase the volume expansion by a small amount and to be reversible.6 Moisture expansion occurs as the water takes up physical space by binding chemically with the
minerology phases in the fired ceramic.6 Another mechanism by which the ceramic is thought to expand is from being fired at a low temperature. The rehydration of dehydrated clay causes an expansion.2
An additional theory that has also been suggested is a ceramic body can be in a state of internal compression caused by the surface tension.28 When water vapor is exposed to the ceramic, the water molecules reduce the surface energy which relieves the internal compression causing the ceramic to expand in volume.7 The chemical composition is then suggested to be the cause of varying levels of internal compression in the ceramic. The rate of expansion would then be determined by how much stress the ceramic is initially placed under.
The effects of composition have been studied and many factors are said to increase the rate of moisture expansion.3 The mineralogy of the ceramic plays a factor in the rate and amount of moisture expansion that occurs over time.3,8 Regarding the mineralogy, many reported conditions play a part in expansion. Increasing amorphous material, such as silica, has been reported to be a factor with increased moisture expansion.2,6 There have also been studies done that show silica and alumina do not contribute much to the expansion rates.6 Glass and crystalline phases lower moisture expansion.2 Using talc in a body was shown to lower the rate of moisture expansion compared to a porcelain body.4
Particle size is a small factor in moisture expansion. Decreasing the particle size of flint (from around 30µ to around 5µ) was shown to reduce the moisture expansion of ceramic rods by minimal in autoclave tests.29 This change in the rate of volume
expansion is only a slight contribution to moisture expansion compared to the effect of porosity or composition.
D. Reheat
Reheating ceramics is a proposed method to remove water that has been absorbed chemically and physically.3,6,10,18,21
This is a way to reverse any moisture expansion that has occurred. If heated to adequate temperatures, the ceramic returns to its original dimensions.
Reheating ceramics could potentially be used for investigating moisture expansion for a quality control purpose or as a predictor for past or future moisture expansion.3,6,11,15,21,23
There has been discussion about the best method for reheating.10,11 Temperatures around 900°C remove nearly all the water absorbed. Low temperature reheating below 573°C (which is suggested to be the optimal reheating temperature), despite possibly not removing all the water from the ceramic, is now thought to be the best method.11 This is to avoid quartz inversion as α quartz changes to β quartz. Firing above the quartz inversion temperature can cause a displacement throughout the microstructure creating either an increase or decrease in volume from the initial measurements.10,11 While this may not matter for reversing expansion of objects such as brick or tile, it can make a difference when doing experiments to measure the amount of reversed moisture expansion. Sintering during the reheat is also a concern for temperatures close to the original firing temperature. (Figure 2)
Figure 2. Reheating to recover expansion. High temperature reheats of 1000°C show additional shrinkage from sintering, making the true amount of moisture recovery impossible to determine.
It is shown that there is very little difference in moisture expansion recovery between high temperatures (900°C) and low temperatures (550°C) when the low temperatures are held for a longer time (up to 2 hours).11,21 Reheating may not be suitable for ceramic art or archeological artifacts that could be susceptible to moisture expansion as it could be damaging (change in color, removal of non-ceramic material, ect.). Using reheating to predict moisture expansion of past or future ceramic pieces requires knowledge of the rate of expansion for that particular ceramic composition.3,6,10,21,23,24
This is because of the variation in ceramic body compositions, temperature they were fired to, and atmospheric condition in which they were kept.
E. Crazing
Crazing in a glaze is the formation of small cracks associated with a difference in thermal expansion between the glaze and the ceramic body.13 Crazing also occurs due to
moisture expansion of the ceramic body. This is usually seen after some time has passed and moisture accumulated in the body.7,14
Glaze expansion is minimal or nonexistent.13 When the ceramic body expands and the glaze does not, the tensile stresses will cause the glaze to craze.14 Studies have shown moisture expansion can induce crazing. When using aged samples in crazing tests, there was found to be an increase in crazing relative to specimens that had been recently fired.7 This is due to moisture expansion applying additional stress to the glaze in conjunction with the crazing test. Crazing tests are not always a reliable predictor because the process only accounts for stresses between the glaze and the ceramic body.
There may be outside or additional stressors that are not accounted for, such as moisture expansion or the way tiles or ceramics are applied.7
Along with crazing, moisture expansion can cause building damage, cracking in masonry, and lifting of wall and floor tiles.10 This is usually associated with a freeze- thaw cycle, but it has also been proposed that moisture expansion causes a displacement throughout the structure by adding additional stress.10,19
F. Autoclave
Autoclaving acts as an accelerated aging process, and is a useful way to test the long-term moisture expansion rates.5,7,16 By applying high pressure (up to 2070 kPa (300psi)) and steam to ceramic samples, the increase in volume can be used as a quick predictor of how the ceramic will expand over several years.5,7
Boiling ceramics can be used as way to see if moisture expansion will occur.5,6,8,15 Boiling ceramic tiles has been shown to be the equivalent of three years of moisture expansion in natural conditions.15 Boiling is not considered the preferred way to predict
how much moisture expansion will develop as it does not mimic how expansion, under natural conditions, occurs.5,8
When autoclaving ceramic samples, additional reactions can occur that will affect the measured change in volume.5,7,10,25,30
These reactions are relatively small compared to the overall reaction with the steam.10 Despite these effects, autoclaving is still considered the best method to artificially age ceramics for moisture expansion tests.5,7
Autoclave testing for moisture expansion works on the same principle as crazing testing for glazes.7,11 There are many different standards for moisture expansion testing and they are not easy to compare to each other.11 Autoclave measurements must be correlated to natural expansion in ambient conditions for each ceramic body because of many factors such as ambient conditions and composition.11
III. EXPERIMENTAL PROCEDURE
A. Material
Four body compositions in Table I were made with varying levels of flux (RO+R2O), alumina (Al2O3) and silica (SiO2) (also see Figure 3). The alumina and silica were kept at a constant ratio of around 5:1 (Figure 4). With keeping the alumina and silica molar ratio a constant, the only change was the amount of flux between the different compositions. The more flux a ceramic body has the lower temperature the ceramic needs to be fired to densify. This was designed to create a range of densities at any given temperature with the different compositions.
Composition #1 has the least amount flux in its recipe, comparable to an earthenware body. Composition #4 has the most flux, similar to a low fire porcelain.
The experiment was designed such that at any given temperature Composition #1 will have a lower density than Composition #4. Composition #2 is closest to what is seen in a typical porcelain clay body and Composition #3 is a soft paste porcelain.
Table I. Weight Percentage Body Compositions Clay Composition
#1
Clay Composition
#2
Clay Composition
#3
Clay Composition
#4
EPK 31.7 EPK 15.3 EPK 24 EPK 19.9 OM4 37 OM4 15.3 OM4 28 OM4 23.2
Grolleg 18.3
G200 6.5 G200 25.5 G200 33.9 G200 48.2 Silica 24.7 Silica 25.5 Silica 14.2 Silica 8.6
“Earthenware” “Porcelain” “Soft Paste Porcelain”
“Low Fire Porcelain”
Table II. Oxide Weight Percentage
Composition SiO2 Al2O3 Na2O K2O MgO CaO Fe2O3 TiO2 L.O.I #1 63.42 23.93 0.45 1.92 0.11 0.26 0.58 0.73 4.69 #2 62.70 22.78 1.53 5.99 0.07 0.39 0.38 0.46 2.95 #3 65.66 20.67 0.91 3.59 0.11 0.26 0.42 0.33 2.27 #4 62.70 22.78 1.53 5.99 0.07 0.39 0.38 0.46 2.95
Table III Oxide UMF
Composition SiO2 Al2O3 Na2O K2O MgO CaO Fe2O3 TiO2
#1 45.48 9.32 0.18 0.53 0.20 0.09 0.19 0.46
#2 21.47 3.54 0.24 0.64 0.08 0.04 0.07 0.17
#3 16.35 3.33 0.25 0.66 0.06 0.03 0.05 0.13
#4 12.19 2.47 0.26 0.68 0.04 0.02 0.03 0.08
Figure 3. Mineral component triaxial diagram of the four clay compositions in relation to each other.
Silica (UMF)
0 10 20 30 40 50
Alumina (UMF)
0 2 4 6 8 10
K2O + Na2O Normalized to 1
5:1
#1
#2
#3
#4
Figure 4. The ratio of alumina to silica is kept at a ratio of 5:1 when the K2O + Na2O levels are normalized to 1.
B. Sample Preparation
Each clay mixture was made into a slurry and filter pressed into a workable clay body. Clay bodies were then extruded into rods (1.27cm diameter and approximately 20cm length). The rods were fired to 1000°C (5°C/minute ramp, with a one hour dwell).
The rods were then cut to 5-8cm in length. The rods were machined using a lathe to square each face and the sides. This was to help with the difficulties in measuring the slight changes in expansion of the ceramics. When both ends of the ceramic rod are machined parallel, accurate measurements can be taken of the samples. Some samples were re-fired at a range of 1050°C to 1300°C (in increments of 50°C) as part of the experimental design. This re-fire was done after machining as it is easier to machine low fired ceramics than high fired ceramics.
C. Measurements
Linear measurements of the samples were made by marking the ends of the rods and recording the length with a micrometer. Marking the location that the measurements were taken from insures greater accuracy in recording the length of the samples. The micrometer allows accuracy when measuring the smallest changes in the samples.
Measurements were made of each sample before using in any test to get an initial length.
Figure 5. Marking of samples. Measured in length with a micrometer.
D. Relative Humidity
Saturated salt solutions were used as a method to keep samples in a constant relative humidity. By keeping salt solutions in sealed containers, the air equilibrates to a constant relative humidity (RH). The amount of relative humidity is dependent on what type of salt is used in the saturated solution (Table IV). The saturated salt solutions were:
Magnesium Nitrate, Sodium Chloride, and Potassium Sulfate.
Table IV. Equilibrated Relative Humilities for Salt Solutions Saturated Salt Solution Relative Humidity (%)
Magnesium Nitrate 50
Sodium Chloride 75
Potassium Sulfate 98
A relative humidity of 50% was chosen to match that used by museums, which keep their collection at, including ceramics.31 The relative humidity of 98% was used as an extreme to test what effect a near 100% RH environment would have on ceramic moisture expansion. The last condition of 75% RH was chosen for a middle point between 50% and 98% RH. Samples were kept at room temperature and measured once a month.
Temperature (°C)
0 10 20 30 40 50 60
Relative Humidity (%)
40 50 60 70 80 90 100
Potassium Sulfate Sodium Chloride Magnesium Nitrate Ambient
Temperature Range
Figure 6. Equilibrium relative humidity with the use of salt solutions.31 E. Autoclave
An autoclave was used to accelerate the moisture expansion in the ceramic samples. This method was used to measure relatively large (compared to ambient conditions) increases in moisture expansion in a short period. The autoclave was used following the manufacturer’s instructions for operation. The following protocol was used when testing the four clay compositions:
Add 0.5L of distilled water to autoclave.
Add samples to mesh basket and close lid.
Turn on all switches (on/off, and 2 heating) with release valve open.
When steam starts to leave the pressure valve (approximately 30 minutes) close the valve.
When the pressure reaches 690 kPa (100 psi) after 30-40 minutes, turn off one of the heating switches, while the autoclave continues to 1900 kPa (275 psi).
Turn off autoclave after one hour, and open valve to let steam out slowly.
After the pressure reaches zero, open the lid and let contents cool to room temperature.
The autoclave self regulates to keep a set pressure, which is established before using. The autoclave was set for 1900 kPa (275 psi). This relatively high pressure was chosen to produce a large increase in moisture expansion. The large increase allows for a greater accuracy in the sample measurements. After running the autoclave, the samples were removed and measured. The autoclave has a maximum run time of about an hour at peak pressure. When samples were left for over two hours, the gasket would start to become brittle and crack and cause a slow leak. Because of this, samples were exposed to the autoclave for one hour at a time to avoid the autoclave from leaking. Samples were put into the autoclave multiple times to expose them for longer periods at accelerated conditions. This allowed the samples to be measured in between autoclave runs to get the evolution of the sample’s moisture expansion. For low pressure autoclave settings (552 kPa (80 psi)), one of the heating switches was turned off immediately after the pressure release valve was closed. This was to prevent the autoclave from heating up to quickly and building up pressures above 552 kPa.
F. Thermogravimetric Analysis (TGA) and Re-fire
Samples that had been placed in the autoclave for one hour were then heated to test for any recoverability in length caused by moisture expansion. Samples were reheated in a furnace to 500°C (rate 5°C/minute hold at temperature one hour). This temperature was chosen because it is above the boiling point of water, but lower than the original firing temperature. By keeping the temperature below the original firing temperature, it prevented the samples from additional sintering, which would cause a decrease in volume unrelated to moisture leaving the ceramic. After reheating, the samples were measured and put in the autoclave for an additional hour, then measured again, and reheated again. This was to see if the samples could go through multiple expansions and reductions in volume. A control sample was included with each re-heat and measured to show that the changes in length were due to moisture leaving the ceramic.
After being placed in the autoclave for one hour, additional samples were broken into small pieces (1-3mm in diameter) to fit in a TGA. Samples were heated at a range of 500°C to 1000°C in the TGA. Some of these samples were heated in the above range and held at temperature before cooling to see if there was any additional weight loss. A portion of the TGA samples were cooled in a controlled rate (10°C/min) in the TGA after reaching temperature to determine if any weight gain occurs on cooling.
G. Density and Absorption
Density and water absorption tests were done for each of the four clay compositions. These tests were done with the water immersion method following a standard method32 modified for a small specimen size. This method is done by first drying out the ceramic samples overnight at 120°C. After the samples were dried, they are weighed for an initial dry weight. The samples were then boiled in water for two hours to saturate the pores in the ceramic. After boiling, the samples were then removed, and their surface was dried, and then weighed for their saturated weight. After the saturated weight is recorded, the samples were then weighed and then submerged in water to obtain the suspended weight. The following equations were then used to calculate the density and water absorption percent:
𝜌 = 𝐷𝑟𝑦
𝑆𝑎𝑡−𝑆𝑢𝑠 (2)
𝐴𝑏𝑠% = (𝑆𝑎𝑡−𝐷𝑟𝑦
𝐷𝑟𝑦 ) ∗ 100 (3)
Where ρ is the density (g/cm3).
Abs% is water absorption percentage (%).
Sat is the saturated weight of the ceramic sample (g).
Dry is the dry initial weight of the ceramic sample (g).
Sus is the suspended weight of the ceramic sample (g).
The density and water absorption were measured on samples that had been fired to a range of 1000°C to 1300°C (in increments of 50°C). This was done to obtain a range of how each composition densifies as it increases in temperature and how their densities effect the water absorption. These tests were repeated using kerosene as a control to ensure there was no extra water absorption in the ceramics when testing with water. The concern was that testing a material with a natural moisture absorption that using water for testing may not be accurate. Another standard was used for kerosene.33 The difference in standards is modifications were made to account for the different densities between kerosene and water.
𝜌 = (
𝐷𝑟𝑦 𝑆𝑎𝑡−𝑆𝑢𝑠)
0.82 (4)
𝐴𝑏𝑠% = [(
𝑆𝑎𝑡−𝐷𝑟𝑦 𝐷𝑟𝑦 )
0.82 ] ∗ 100 (5)
IV. RESULTS AND DISCUSSION
A. Ambient Relative Humidity
The literature suggests one of the contributing factors to moisture expansion is the relative humidity (RH) of the environment that the ceramic is kept in.2,3,19 It is thought that an elevated RH environment would result in an increase in moisture expansion. An environment with little to no water in the air would result in little or no moisture expansion.
The samples that were measured and kept in 50% RH, 75% RH, and 98% RH, were shown to have a normal distribution of measured data, passing a Shapiro-Wilk test of normality. In Figure 7 all three relative humidity levels fell within the expected measurable range of each other, the implication being that the different humidity are statistically indistinguishable from one another. The samples kept in the 98% relative humidity container did not always show the most moisture expansion (Figure 7), which is contradictory to what is suggested in the literature. 2,3,19 This is true for all ceramic compositions tested. For relative humidity to influence moisture expansion, the RH environment may have to be lower than 50% RH to see a decrease in the rate of expansion. Because the expansion measurements between the different relative humidity levels are statistically indistinguishable, all the data points were averaged together and treated as one relative humidity (Figure 8).
Time (Hours)
0 5000 10000 15000 20000 25000
Expansion (%)
0.00 0.02 0.04 0.06 0.08 0.10 10 W
eeks 20 W
eeks 30 W
eeks 40 W
eeks 1 Year
1.5 Years 2 Years Composition #1
"Earthenware"
2.5 Years 3 Years
Time (Hours)
0 5000 10000 15000 20000 25000
Expansion (%)
0.00 0.02 0.04 0.06 0.08 0.10 10 W
eeks 20 W
eeks 30 W
eeks 40 W
eeks 1 Year
1.5 Years 2 Years Composition #2
"Porcelain"
2.5 Years 3 Years
Time (Hours)
0 5000 10000 15000 20000 25000
Expansion (%)
0.00 0.02 0.04 0.06 0.08 0.10
50% Relative Humidity 75% Relative Humidity 98% Relative Humidity 10 W
eeks 20 W
eeks 30 W
eeks 40 W
eeks 1 Year
1.5 Years 2 Years Composition #3
"Soft Paste Porcelain"
Samples Fired 1000°C; 1 hour 2.5 Years
3 Years
Time (Hours)
0 5000 10000 15000 20000
Expansion (%)
0.00 0.02 0.04 0.06 0.08 0.10
50% Relative Humidity 75% Relative Humidity 98% Relative Humidity 10 W
eeks 20 W
eeks 30 W
eeks 40 W
eeks 1 Year
1.5 Years 2 Years Composition #3
"Soft Paste Porcelain"
Samples Fired 1000°C; 1 hour
Figure 7. Compositions #1-3 samples measured moisture expansion under three relative humidity conditions.
Time (Hours)
0 5000 10000 15000 20000 25000
Expansion (%)
0.00 0.02 0.04 0.06 0.08 0.10
Composition #1
"Earthenware"
10 W eeks
20 W eeks
30 W eeks
40 W eeks
1 Y ear
1.5 Years 2 Years
2.5 Y ears
3 Years
Time (Hours)
0 5000 10000 15000 20000 25000
Expansion (%)
0.00 0.02 0.04 0.06 0.08 0.10
Composition #2
"Porcelain"
10 W eeks
20 W eeks
30 W eeks
40 W eeks
1 Y ear
1.5 Years 2 Years
2.5 Y ears
3 Years
Time (Hours)
0 5000 10000 15000 20000 25000
Expansion (%)
0.00 0.02 0.04 0.06 0.08 0.10
Composition #3
"Soft Paste Porcelain"
10 W eeks
20 W eeks
30 W eeks
40 W eeks
1 Y ear
1.5 Years 2 Years
2.5 Y ears
3 Years
Figure 8. Composition #1-3 samples combined relative humidity.
Samples Fired 1000°C
The moisture expansion that occurs in ceramics does not show an immediate increase in volume for the first 20 weeks of experiment (Figure 9). After the first 20 weeks there is a relatively rapid increase in expansion. The moisture expansion rate then slows down as time progresses. This is consistent with all three compositions measured.
The change that occurs around the 20-week mark does not correspond to any major temperature changes as all the samples were kept in the same laboratory with regulated temperature control. Barometric pressure was looked at over the three years in which the measurements took place in order to eliminate it as a possible outside influence.34 There are no drastic changes in average barometric pressure changes at the time that the rapid increase of moisture expansion occurred (Figure 9). Throughout the three years of recorded barometric measurements, the average was 30.04 inHg (101.7 kPa) with a high and low of 30.82 and 29.06 inHg (104.8 kPa and 98.4 kPa). The first 20 weeks where the ceramic does not expand appears to be an incubation period in which any changes in the ceramic is not as significant.
Figure 9. Composition #2 “Porcelain” samples initial incubation period of 20 weeks before moisture expansion starts to occur. Barometric pressure over three years in which the measurements were taken.34
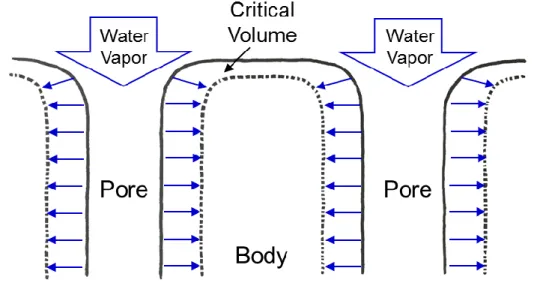
It is unclear what mechanisms are behind the incubation period. One possibility is the ceramic body needs to reach a “critical volume” before exhibiting any measurable expansion. This would take time as water absorbs into the ceramic body, up to half a year, and any moisture absorbed after reaching the “critical volume” would result in moisture expansion.
Figure 10. Ceramic body absorbing water before reaching critical volume causing moisture expansion.
The moisture expansion that occurs after the incubation period shows the rate that the ceramic will expand. This rate of expansion can also be seen in samples that were subjected to an autoclave for an accelerated expansion. The autoclave samples in Figure 11 show a large initial increase after 1 hour in moisture expansion, over twice the amount ambient conditions reach over two years. After 5 hours in the autoclave conditions the moisture expansion is approximately three times the amount of the ambient conditions.
The rate of moisture expansion slows down the longer the samples are kept in the autoclave conditions similar to the ambient conditions. The autoclave does not exhibit an
incubation period due to the amount of moisture expansion that occurs in a short period of time. The accelerated conditions of the autoclave are so great that the incubation period cannot be detected.
Time (Hours)
0 5 10 15 20
Expansion (%)
0.00 0.05 0.10 0.15 0.20 0.25
Composition #1 Composition #2 Composition #3 Composition #4 1000°C; 1 Hour
Ambient Moisture Expansion Range
Figure 11. All four compositions fired to 1000°C were subjected to the autoclave.
Each composition has a large increase in expansion after one hour in the autoclave.
Despite the difference in moisture expansion between autoclave and ambient, both conditions follow a logarithmic curve over time with a large initial increase in moisture expansion that slows in its rate of expansion over time. To compare the two conditions, the ambient was plotted on a logarithmic time scale in Figure 12 in order to express the rate of expansion into a linear equation in Table V. The same can be done for
the autoclave condition in Table VI to define the rate of expansion under accelerated conditions. These equations use a linear slope equation by taking the logarithmic of time:
𝐸𝑥𝑝(%) = 𝑚 ∗ 𝐿𝑜𝑔(𝑡) + 𝑏 (6)
Where Exp(%) is the moisture expansion percentage.
m is the slope.
t is time.
b is the intercept.
Time (Hours)
103 104 105
Expansion (%)
0.00 0.02 0.04 0.06 0.08 0.10 10 W
eeks 20 W
eeks 30 W
eeks 40 W
eeks 1 Year
1.5 Years 2 Years Composition #1
"Earthenware"
r2=0.86 3 Years
Time (Hours)
103 104 105
Expansion (%)
0.00 0.02 0.04 0.06 0.08 0.10 10 W
eeks 20 W
eeks 30 W
eeks 40 W
eeks 1 Y
ear 1.5 Years
2 Y ears
Composition #2
"Porcelain"
r2=0.82 3 Y
ears
Time (Hours)
103 104 105
Expansion (%)
0.00 0.02 0.04 0.06 0.08
0.10 10 W eeks
20 W eeks
30 W eeks
40 W eeks
1 Year 1.5 Years
2 Years Composition #3
"Soft Paste Porcelain"
r2=0.9 3 Years
Figure 12. Compositions 1-3 moisture expansion on logarithmic time scale.
Samples Fired to 1000°C
Table V. Equations for Ambient Moisture Expansion Rate Composition #1 “Earthenware” Exp(%)=0.036*Log(t)-0.1058%
Composition #2 “Porcelain” Exp(%)=0.032*Log(t)-0.0949%
Composition #3 “Soft Paste Porcelain” Exp(%)=0.044*Log(t)-0.1316%
Table VI. Equations for Autoclave Moisture Expansion Rate Composition #1 “Earthenware” Exp(%)=0.04547*Log(t)+0.1102%
Composition #2 “Porcelain” Exp(%)=0.0335*Log(t)+0.1482%
Composition #3 “Soft Paste Porcelain” Exp(%)=0.0512*Log(t)+0.1190%
Composition #4 “Low Fire Porcelain” Exp(%)=0.0729*Log(t)+0.1125%
The ambient and autoclave slopes (Table V) are similar to each other. A plot of the ambient and autoclave moisture expansion (Figure 13) shows that autoclaved ceramics have a similar expansion slope as the ambient conditions. Because the slopes are similar, an estimated equivalent ambient time can be found for the autoclave conditions in Figure 14. The ambient relative humidity samples were compared to autoclave samples that were subjected to a pressure of 552 kPa (80psi). The autoclave samples (552 kPa) at one hour were found to fit along the ambient slope at approximately 10 years if they have been left in ambient conditions. For autoclave pressures of 1900 kPa (275psi) the first hour was found to be the equivalent of 4,200 years for an ambient time. This creates a relation between the autoclave and ambient conditions that can be used to estimate how a ceramic body will expand over several years in a short period of time.
Figure 13 also shows that by using a lower pressure in the autoclave it influences the estimated equivalent ambient time. It has been show that moisture expansion continues to occur even after 30 years.22
Table VII. Ambient and Autoclave Time Dependencies Composition #1 Composition #2 Composition #3
Ambient Slope 0.036 0.032 0.044
Autoclave Slope (552 kPa, 80psi)
-- 0.0703 --
Autoclave Slope (1900 kPa, 275 psi)
0.04547 0.0335 0.0512
Time (Hours)
10-1 100 101 102 103 104 105
Expansion (%)
0.00 0.05 0.10 0.15 0.20 0.25
Ambient
Autoclave 1900 kPa (275 psi) Autoclave 552 kPa (80 psi)
10 W eeks
20 W eeks
1 Year 3 Years
10 Years Compostion #2
1 Hour
5 Hours 10 Hours
r2=0.87
r2=0.88
r2=0.82
Figure 13. Autoclave and ambient.
Time (Hours)
10-1 100 101 102 103 104 105 106 107 108 109 1010
Expansion (%)
0.00 0.05 0.10 0.15 0.20 0.25
Ambient
Autoclave1900 kPa Autoclave 552 kPa 10 W
eeks 20 W
eeks 1 Year
3 Years 10 Years
30 Years 100 Years
1000 Years 10000 Years Compostion #2
r2=0.88
Figure 14. Autoclave compared to ambient conditions. Composition #2 samples follow the same slope on a logarithmic scale. Autoclave at lower pressure being equivalent to around 10 years of natural moisture expansion.
B. Autoclave
Autoclaving ceramic specimens are shown to be a useful tool to accelerate moisture expansion. An equivalent natural time can be found for an autoclave pressure by finding where the measured expansion lines up on the natural moisture expansion slope (Figure 14). Because there is a difference between specimens autoclaved at 552 kPa, 1900 kPa, and natural atmospheric conditions (around 100 kPa), it is clear the pressure is a factor in moisture expansion. The relationship between expansion and pressure is plotted in Figure 15. It appears that moisture expansion, as a function of