Nano-Calorimetry for Point of Care Diagnostics By
Brad Lubbers
Dissertation
Submitted to the Faculty of the Graduate School of Vanderbilt University
in partial fulfillment of the requirements for the degree of
DOCTOR OF PHILOSOPHY in
Biomedical Engineering May 2015
Nashville, Tennessee
Approved:
Franz Baudenbacher, Ph.D., Chair Kevin Currie, Ph.D.
Robert Galloway, Ph.D.
Raymond Mernaugh, Ph.D.
Joel Tellinghuisen, Ph.D.
Hak-Joon Sung, Ph.D.
ii
ACKNOWLEDGEMENTS
I wish to thank my wife, Paige, for putting up with me these last many years and giving me the driving force to continue, even when I wanted to throw in the towel. I thank God for strength and guidance and also for my parents and in-laws constant support and prayers. I thank Franz for giving me the autonomy to take this project where I saw fit, but at the same time guiding me in the proper direction. I also thank my committee for overseeing this project and giving it their approval. Thanks also to everyone in BME and VIIBRE who assisted in aspects of this project.
TABLE OF CONTENTS
Page
ACKNOWLEDGEMENTS ... ii
LIST OF TABLES ... vi
LIST OF FIGURES ... vii
Chapter I: Introduction To Nano-Calorimetry For Point Of Care Diagnostics ... 1
Objective ... 1
Specific Aims ... 1
Aim 1: Construct high sensitivity calorimeters ... 2
Aim 2: Apply high sensitivity calorimeters to nanoliter volume Thermometric ELISA . 3 Aim 3: Develop an automated calorimeter suitable for point of care diagnostics ... 3
Background ... 4
Calorimetry ... 4
Theory ... 4
Calibration ... 8
Performance ... 9
Modeling ... 10
Enzymes ... 11
Enzyme Immobilization ... 13
ELISA ... 14
Point of Care Diagnostics ... 17
References ... 21
II: Isothermal Titration Calorimetry In Nanoliter Droplets With Sub-Second Time Constants .. 25
Abstract ... 25
Introduction ... 26
Experimental Section ... 27
Sensor Description ... 27
Amplifier Design ... 27
iv
Sample Delivery ... 31
Sample Stabilization ... 31
Time Constant Measurements ... 34
Sensitivity Calibration ... 34
Sensor Modeling ... 34
Results and Discussion ... 35
Modeling ... 35
Determination of the Power Sensitivity ... 38
Device Optimization ... 40
Error ... 43
Determination of Time Constant ... 43
Minimum Detectable Energy ... 44
Conclusions... 46
Acknowledgements ... 46
References ... 47
III: Nanoliter Droplet Based Calorimeter For Point Of Care ELISA ... 49
Abstract ... 49
Introduction ... 49
Results & Discussion ... 51
Thermometric ELISA ... 51
Device Design ... 53
Trastuzumab Binding ... 54
Reduction in sample volume ... 56
Serum Matrix Effects ... 57
Conclusions... 58
Acknowledgements ... 58
Supplementary Material for Chapter III ... 59
Device modeling ... 59
Device Fabrication ... 60
Thermometric ELISA ... 62
References ... 65
IV: Nano-Calorimetry Based Point Of Care Biosensor For Metabolic Disease Management ... 66
Abstract ... 66
Introduction ... 67
Methods ... 70
Materials ... 70
Device modeling and fabrication ... 71
Device characterization ... 72
Enzymatic measurements ... 73
Results and Discussion ... 75
Acknowledgements ... 78
References ... 79
V: Conclusions And Future Research ... 81
Summary of Findings ... 81
Future Research ... 84
Appendix A: MATLAB Code ... 85
Time constant calculation ... 85
Pico-calorimeter detrending and signal integration ... 86
Enzyme kinetics fitting ... 91
TELISA curve fitting and signal integration ... 92
B: MATLAB Integration of COMSOL Code for Device Optimization ... 95
C: LabView Code ... 99
D: Additional Methods ... 101
Model Fitting ... 101
Device Optimization ... 102
Thermopile Material Selection ... 103
References ... 107
vi
LIST OF TABLES
Table Page
1. Comparison of different micro-calorimeters ... 9
2. Comparison of reaction enthalpies and enzyme kinetics ... 12
3. Device properties. ... 73
4. Bulk and thin-film properties of common thermoelectric materials ... 104
5. Figure of merit ... 105
LIST OF FIGURES
Figure Page
1. Calorimeter heat flow ... 7
2. Column based Thermometric ELISA ... 16
3. POC glucose devices... 18
4. Device layout. ... 28
5. Noise spectral density ... 30
6. Baseline correction... 32
7. Baseline shift to volume relationship ... 33
8. Exothermic acid-base neutralizations used for calibration ... 37
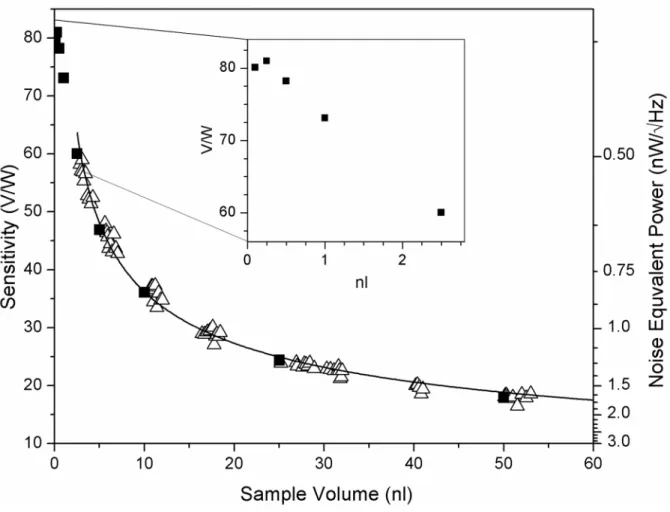
9. Experimentally determined sensitivity ... 40
10. Device modeling ... 42
11. Time constant ... 44
12. Sample injections ... 45
13. Thermometric ELISA steps ... 51
14. Small volume performance ... 52
15. Calorimeter optimization ... 53
16. Nanocalorimeter device layout ... 55
17. Thermometric ELISA signal and dose response. ... 57
18. Calorimeter microfabrication steps ... 61
19. Baseline correction and τ calculation ... 64
20. Differential nanocalorimeter layout ... 71
21. Catalase assay ... 74
22. Phenylalanine assay ... 77
23. Calorimeter control and recording front panel... 99
24. Calorimeter control and recording block diagram ... 100
25. Combined ρ and S measuring probe. ... 103
CHAPTER I
Introduction To Nano-Calorimetry For Point Of Care Diagnostics
Objective
The goal of this work is to develop microfabricated highly sensitive calorimeters for the research community and for point of care diagnostics.
Specific Aims
Essential to all chemical reactions, molecular interactions, and biological processes, is the transfer of energy according to the laws of thermodynamics. This energy flow must result in a change in energy and can be measured according to the first law of thermodynamics:
∆𝑈=𝑄 − 𝑊 (1)
where ΔU is the change in internal energy, Q is the heat added or taken out of the system, and W is the work performed by the system. In an isolated system, U must remain constant, so all processes that produce work either consume or produce heat, and this heat can be measured. The field of isothermal calorimetry deals with measuring this heat and characterizing reactions and processes based on it. The more accurately and quickly that temperature changes can be measured, the more details about the process can be elucidated.
In the interest of maximizing calorimeter performance and reducing sample consumption, there is a drive towards smaller sample volumes. This maximizes sensitivity and minimizes the time constant by reducing the thermal mass of the sample and measurement system. Calorimeter sensitivity can also be improved through heat flow modeling and low thermal conductivity
membrane materials like photo-definable Su-8. Using microfabrication techniques, nanowatt sensitivity thermopile based sensors can be built, but traditionally suffer tradeoffs between ease of sample handing and sensitivity. Standing drop calorimeters provide the highest sensitivity, but suffer from a lack of integrated liquid handling. Flow through calorimeters based on microfluidic channels offer simple sample handling, to the point of fully automated measurement systems, but traditionally have low sensitivity.
Calorimetry can be applied to many different disciplines, but for the most part it is limited to the research lab for use in physical materials study, chemical reaction measurements, and binding studies of drugs and proteins. Translation to the clinical setting has been slow due to the problems mentioned above. Here we propose using standard microfabrication techniques to build calorimeters capable of sub-nanowatt sensitivity for use in point of care diagnostic testing.
For the first time, automated liquid handing that does not degrade device performance will be presented. The combination of nanoscale calorimetry with thin film capillary devices will allow for a scalable measurement system applicable to a number of disciplines including isothermal titration calorimetry for drug interaction screening, Thermometric Enzyme-Linked Immunosorbent Assay (TELISA) for blood antibody monitoring, and point of care (POC) diagnostic testing of many different blood analytes.
Aim 1: Construct high sensitivity calorimeters
The first aim of this dissertation was to construct and optimize thermoelectric calorimeters capable of sub-nanowatt sensitivity. This was accomplished through experimental determination of optimal nano-calorimeter materials and construction methods, heat flow modeling, and iterative optimization. The successful completion of this aim provided the basic measurement devices essential to the next aim.
Aim 2: Apply high sensitivity calorimeters to nanoliter volume Thermometric ELISA
The second aim combined standard ELISA reagents with nanoliter calorimetry to realize the small volume Thermometric ELISA. We successfully demonstrated TELISA by miniaturizing reactions and providing a quantitative thermal readout of analyte concentration.
Serum matrix effects were mitigated while sample throughput was increased and sample consumption decreased. This novel technology paves the way for point of care diagnostic essential for the management of metabolic disease undergoing enzyme replacement therapy as outlined in specific aim 3.
Aim 3: Develop an automated calorimeter suitable for point of care diagnostics
The final aim used thermal and diffusion modeling to design a capillary based nano- calorimeter suited to POC diagnostics. We demonstrated the one-step measurement of common blood analytes through the thermal detection of enzymatic reactions in nanoliter sized capillary channels. By doing away with cumbersome micro-pipetting steps and eliminating most sources of error, we propel nano-calorimetry from the research lab to the clinical setting and beyond.
Background
Calorimetry
The field of calorimetry deals with the measurement of heat and energy changes associated with chemical reactions, binding events, phase changes, and metabolism to name a few1-4. These measurements can be made with a variety of different calorimeters with some of the most common being differential scanning calorimeters, isothermal titration calorimeters, and bomb calorimeters5. For the purposes of measuring the minute amounts of energy produced by living cells, protein binding, and small volume chemical reactions, isothermal calorimetry is most applicable5. In this form, the sample is kept in a near adiabatic condition while any heat flow changes resulting from reactions or internal processes are monitored. The temperature can be detected by any number of technologies including Resistive Temperature Detectors (RTD’s), thermistors, resonance changes, and thermal expansion; though the most common is based on the thermoelectric effect6,7. Isothermal calorimeters can be further subdivided based on their sample volume and minimum detectable energy. The most sensitive calorimeters use microchip fabrication technology, operate with nanoliter sample volumes, and have sensitivities approaching one nanowatt8.
Theory
Since the main sensing function of any calorimeter is to measure temperature changes, the more precisely those changes can be measured, the better the device performance becomes.
As noted, the thermoelectric effect, and more specifically the Seebeck effect, is the most common method for precise temperature measurement in isothermal calorimetry. Discovered in 1821 by Thomas Johann Seebeck, the Seebeck effect relies on the generation of current when
two dissimilar metals are connected and their junctions held at different temperatures. The voltage potential is directly proportional to the temperature difference between the hot (measuring) and cold (reference) junctions and is quite linear over modest temperature ranges (ΔT<100 C)9. The voltage produced is due to the differential thermal charge carrier drag along the length of wire with the ends at different temperatures and its sign and magnitude are dependent on material properties10. This self-generation of voltage is one of the main advantages of a thermocouple over a thermistor or RTD. Potential self-heating produced by the latter devices completely overwhelms any small temperature changes. The Seebeck coefficient (S) can be determined for metals and semiconductors and is measured in units of microvolt/Kelvin. When a thermocouple is formed from materials of known S and the resulting voltage (V) measured, the temperature difference between the two junctions can be found by:
∆𝑇= (𝑆1− 𝑆2)∙ 𝑉 (2) For a single junction this voltage would be quite small, but by placing many thermocouples in series and forming a thermopile, the effect is additive. Materials with a high S make for high sensitivity thermopiles; however S and conductivity are roughly inversely proportional with the highest S materials being semiconductors with very high resistances9,10.
Electrical resistance is an important factor of thermopiles as it determines the principle noise component. Since thermopiles self-generate voltage, Johnson-Nyquist noise can be described by the spectral noise density:
𝑉𝑛 = �4 𝑘𝐵𝑇𝑅 (3)
where kB is the Boltzmann’s constant, T the resistor’s absolute temperature, and R the resistance of the thermopile. Therefore a balance must be struck between high S and low R. Many research
grade calorimeters utilize low resistance metals like gold and nickel that are easily processed using microfabrication techniques, but lack high S11,12. Utilization of bismuth and antimony based thermopiles produces very high sensitivity devices with moderate resistance, but are more difficult to work with at the sub 100 μm linewidths needed for nanoliter scale calorimeters13. Others utilize microfabrication friendly, high S semiconductors for thermopile materials, but suffer from high overall resistance (>200 kΩ)14.
Another important consideration is heat flow out of the calorimeter. The higher the resistance to heat flow, the longer heat remains in the calorimeter at the hot junction where it can be measured. The total Seebeck coefficient for the thermopile (Stot) and the total heat flux away from the sample (Gtot) are combined in the follow equation to give the overall power sensitivity (Psens) in V/W for a thermoelectric calorimeter:
𝑃𝑠𝑒𝑛𝑠= 𝑆𝑡𝑜𝑡⁄𝐺𝑡𝑜𝑡 (4) Gtot is expressed in terms of amount of power in W needed to raise the sample temperature 1 K.
The Gtot term is comprised of several different fluxes including flux through the thermopile traces, supporting substrate, air, and radiation. At such small ΔT, radiation is negligible and the main flux pathway is through the substrate. For this reason, most high sensitivity calorimeters are fabricated on suspended membranes surrounded by air (Figure 1). The open form of calorimeter, shown in Figure 1 benefits from minimal contact between the sample droplet and membrane. In the closed or microfluidic form, the sample drop is contacted on all sides by the microfluidic channel. This provides thermal conduction away from the sample and greatly increases Gtot. By reducing the thickness and thermal conductivity of the membrane and thermopile, Gtot can be minimized. Traditionally silicon nitride and silicon dioxide have been used as membrane materials due to their strength and compatibility with microfabrication techniques. Compared to
SiN or SiO2, utilizing a polymeric membrane can reduce membrane heat flux by as a factor of 4015. Polymeric membranes of parylene-C or Su-8 have been used on a few high sensitivity calorimeters, but are not yet the norm12,16. Su-8 is a well suited membrane material as it possess a very low thermal conductivity (~0.25 W/m∙K), is photopatternable, withstand temperatures up to 300 °C, and is resistant to all but the harshest chemicals17.
With Gtot and Vn known, another important parameter can be calculated, minimum detectable power change (Pmin) with the following equation:
𝑃𝑚𝑖𝑛= 𝛷 𝑃⁄ 𝑠𝑒𝑛𝑠 (5)
Φ is total noise, both thermal and electronic, but for a well isolated system with a low noise amplifier, Φ is mainly comprised of Vn. Similarly, the parameters Φ and Stot can be used to find the minimum detectable temperature change with the following equation:
𝑇𝑚𝑖𝑛 = 𝛷 𝑆⁄ 𝑡𝑜𝑡 (6)
Equations 5 and 6 specify the minimum detectable signal with a signal to noise ratio of 1, however a more realistic ratio of 2 or 3 may be needed to provide a measurable signal. Though a
Figure 1. Calorimeter heat flow. For an ideal calorimeter with a sample droplet sitting atop the sensing thermopile and membrane, the main heat flux (red lines) is through the thermopile and membrane, with little transferred through the air.
small Pmi n may be advantageous for some measurements, the response time (τ) of the system may be more important for fast processes with rapid changes in enthalpies. The following equation shows how τ is inversely proportional to Gtot:
𝜏 = 𝐶𝑡𝑜𝑡⁄𝐺𝑡𝑜𝑡 (7)
Ctot is the total thermal mass of the calorimeter sensing area, including the sample itself. For an open, suspended membrane calorimeter, this is principally the sample thermal mass. A reduction in sample volume enhances τ and increases the effective bandwidth. Since Pmin is in units of W/Hz1/2, an increase in bandwidth leads to a lower minimum detectable energy.
While equations 4-7 provide useful insight into calorimeter parameters, they assume ideal conditions of uniform heat distribution, flux, and thermal conductivity in the sample.
Experimental results may differ significantly from the equation predictions and in its place finite element analysis modeling provides a more accurate model of calorimetric systems. Being that any model is no more accurate than the parameters input into it, it is worthy to note the thin film properties of many materials differ significantly from the bulk values in the sub-micron range9,18. In order to create a robust model, these thin film parameters must either be measured or the model fit to empirically determined values for equations 3-6.
Calibration
The measurement of the parameters in equations 3-6 can take several forms depending on the calorimeter design. τ can be measured directly based on sample heating via a built in heater strip or laser heating. Likewise, Psens can be measured in a similar fashion if a known amount of energy is input into the system. Using a built in heater near the sample volume provides the easiest method of sensitivity determination19,20, but suffers from error due to localized heating
around the resistive element that does not originate within the sample volume. Laser heating of the sample is also problematic if the sample or membrane is semi-transparent in the laser wavelength. A more experimentally accurate determination of sensitivity can be made using binary chemical reactions21,22. In this form, the reaction of measured amounts of acid and base within the sample droplet mimics closely the thermodynamics of reactions of interest.
Performance
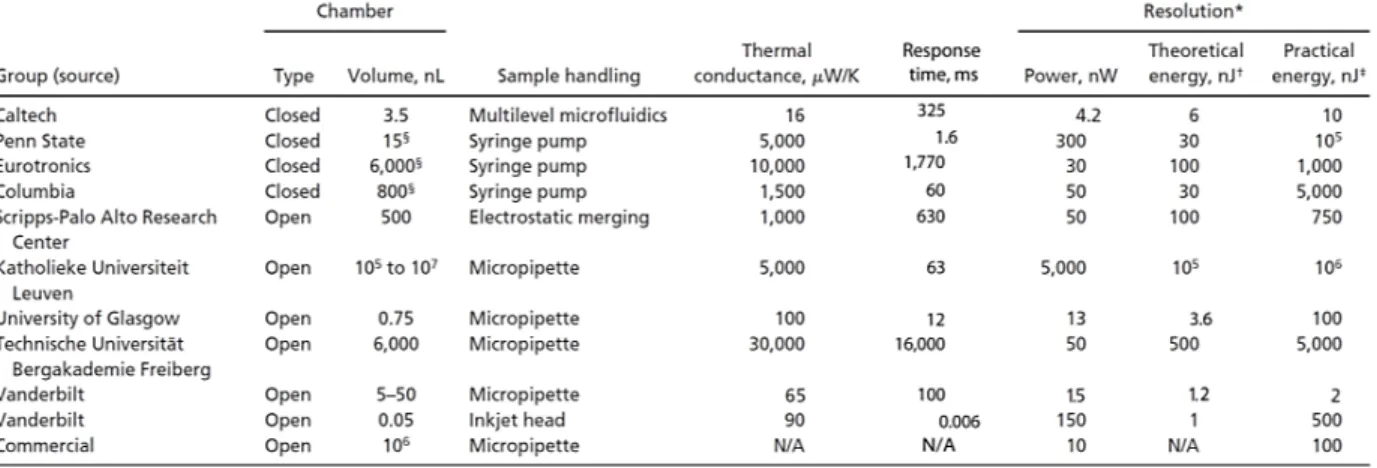
When comparing different calorimeters it is useful to look at not only their minimum power sensitivity, but also their thermal conductance as shown in Table 1. Closed calorimeters utilize microfluidics for sample handing and hence are easier to operate and do not suffer from sample evaporation problems. Aside from the Caltech device, most are lacking in sensitivity due to the large Gtot contributed by the microfluidic channels and conductance through the sample fluid itself. The low thermal conductance of the Caltech device was due to vacuum insulation of the sample sensing area12. The closed, microfluidic devices also suffer from a degradation of practical Pmin due to flow noise through the chamber. An equally deleterious reduction in
Table 1. Comparison of different micro-calorimeters. Adapted12
practical Pmin is seen for the open calorimeters due to sample evaporation and micropipette injection errors. This error was reduced considerably for the first Vanderbilt calorimeter listed through baseline shift correction and better sample chamber sealing23. No calorimeters to date have shown a practical energy resolution of less than 1 nJ. In order to reach this goal, better sample handling, evaporation control, and higher power sensitivity is needed. Towards this goal heat diffusion modeling can be applied to optimize calorimeter design.
Modeling
Finite element analysis (FEA) is a powerful mathematical tool for simulating chemical or thermal diffusion processes. The basis of FEA is the subdivision of a complex mathematical model into smaller, finite subunits (the mesh) in which partial differential equations can be more readily approximated24. Though originally applied to structural engineering problems, FEA can be used to analyze many different processes; of which heat flow, microfluidics, and molecular diffusion are of the most interest to the work at hand25. With the advent of software like COMSOL Multiphysics and MATLAB, multiple properties can be simulated at once with the ability to perform iterative feedback optimizations of calorimeter designs. This not only aids calorimeter design, but also guides experimental design by predicting the thermal output and reaction kinetics of chemical and enzymatic processes. However, as with any other model system, FEA is highly sensitive to imperfections in the model. This is especially true in the case of nano-calorimeters, which are composed of thin film materiuals and normally operated in the microfluidic flow regime. The thin film properties of materials, especially metals, can vary greatly from their bulk properties due to grain boundaries restricting the mean free path9. This necessitates empirical testing of thin film materials, as citable sources are sparse and can vary greatly depending on how the films were prepared26. Another approach to improve model
accuracy is the least-square fitting of model parameters to actual experimental results from the device in question.
Enzymes
Many different biological assays rely on enzymatic reactions to produce quantifiable signals (e.g. fluorescent, chemiluminescent, colorimetric, potentiometric, amperometric, acoustic, or calorimetric to name a few)6,27-32. These signals may be the direct result of an enzyme consuming the analyte and causing an optical absorbance change, as in the case of a peroxide assay utilizing catalase. The signaling could be more complex like that of a phenylalanine assay based on PAL that measures the pH change due to ammonia production33. By far the most widely utilized biosensor is that based on the amperometric measurement of H2O2 resulting from the oxidation of glucose by GOx in the commercial glucose sensors used by diabetics6. Much like equation 1 from the first law of thermodynamics, any enzymatic reaction can be studied using the Gibbs equation to find the change in energy:
∆𝐺 = ∆𝐻 − 𝑇∆𝑆 (8)
where ΔG (at a constant temperature) is the change in free energy, ΔH is the total heat change (enthalpy), T is temperature, and ΔS is the change in entropy. Since we are dealing with calorimetry, we are primarily interested in changes in enthalpy, since that leads to changes in temperature. The quantifications of this heat provides the basis for all calorimetric biosensors34. We are also concerned mainly with reactions that are exergonic (-ΔG) at or near room temperature so reactions will proceed towards the products. Utilizing nano-calorimeters to study enzymatic reactions with large -ΔH allows for the detections of very low concentrations of reactants (analytes). Even though any reaction with -ΔG will occur spontaneously, the time scale
over which it happens is determined by its energy of activation (Ea). As shown in Table 2, the decomposition of hydrogen peroxide into water and oxygen has a relatively large ΔG and ΔH, making it a good candidate for calorimetric measurements. However, its Ea is very high (+75 kJ/mol) meaning that the likelihood of spontaneous decomposition is rare at room temperature.
The actual rate is exponentially dependent on Ea as the Arrhenius equation (9) shows35.
𝑘= 𝐴 ∙ 𝑒−𝐸𝑎𝑅𝑇 (9)
A change of 2.48 in Ea leads to 10 fold increase in reaction rate. The Ea of H2O2 in the presence of catalase is only +8.4 kJ/mol meaning H2O2 reacts millions of times faster than on its own. Ea
is not the only factor governing reaction kinetics, the Michaelis-Menten equation links enzyme kinetics and substrate concentration to the overall rate:
𝑣= 𝑘𝑐𝑎𝑡[𝐸0][𝑆]
𝐾𝑚+ [𝑆]
(10)
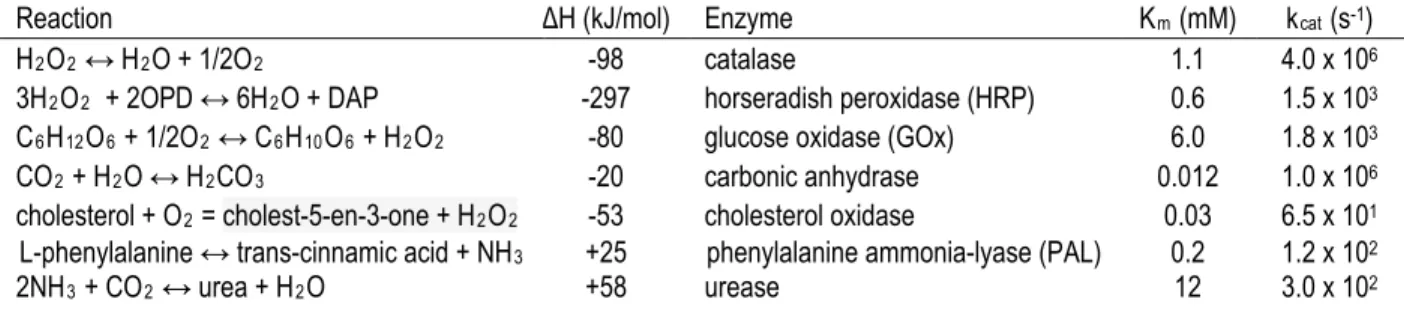
where kcat is the maximum turnover rate, Km is substrate concentration at half kcat rate, [E0] is enzyme concentration, and [S] is substrate concentration. Enzymes with high kcat and large ΔH (like catalase and glucose oxidase) are good candidates for calorimetric biosensors, as they consume substrate quickly and produce a large output, even at the low concentrations that may be present in diagnostic samples (Table 2). A common enzyme class, oxidases, have many
Table 2. Comparison of reaction enthalpies and enzyme kinetics. Adapted35-40
Reaction ΔH (kJ/mol) Enzyme Km (mM) kcat (s-1)
H2O2 ↔ H2O + 1/2O2 -98 catalase 1.1 4.0 x 10⁶
3H2O2 + 2OPD ↔ 6H2O + DAP -297 horseradish peroxidase (HRP) 0.6 1.5 x 10³ C6H12O6 + 1/2O2 ↔ C6H10O6 + H2O2 -80 glucose oxidase (GOx) 6.0 1.8 x 10³
CO2 + H2O ↔ H2CO3 -20 carbonic anhydrase 0.012 1.0 x 10⁶
cholesterol + O2 = cholest-5-en-3-one + H2O2 -53 cholesterol oxidase 0.03 6.5 x 101 L-phenylalanine ↔ trans-cinnamic acid + NH3 +25 phenylalanine ammonia-lyase (PAL) 0.2 1.2 x 10²
2NH3 + CO2 ↔ urea + H2O +58 urease 12 3.0 x 10²
corresponding blood analytes of interest (i.e. cholesterol, carbohydrates, many amino acids)34. These are energetic on their own and the H2O2 produced can be coupled to catalase to more than double the output heat39. Similarly, an enzyme such as phenylalanine ammonia-lyase that releases NH3 can be coupled to a dehydrogenase or urease to increase output. However, the enzyme kinetic values cited in many textbooks differs greatly from reported experimental kinetic data due to differences in enzymes and reaction environments41. This necessitates experimental validation and modeling to determine the true kinetic values under actual reaction conditions as any calorimetry based assay will be sensitive to changes in reaction rates. Similarly, the enthalpy values are sensitive to buffer conditions, concentration, and temperature, and as such need to be experimentally determined and factored into the modeling.
Enzyme Immobilization
While some research grade calorimetric biosensors utilize unbound enzymes, a commercial biosensor requires some form of enzyme immobilization. This is usually accomplished through crosslinking, covalent bonding, or physical entrapment of the enzymes42. Enzyme preservation is equally important and aims to prevent loss of enzyme structure and activity through enzyme modification, structural confinement, or stabilization reagents that maintain pH and humidity43. The most common class of calorimetric biosensors are based on flow through columns containing support matrixes to which the principle enzyme or analyte is bound39. One of the first flow through sensors utilized hexokinase bound to glass beads in a 1 ml column to measure glucose concentration44. Modern sensors often rely on chemical crosslinking with glutaraldehyde or affinity linking to bind enzymes to high surface area resin. A large excess of enzyme is required for these column based calorimeters since both Ctot and Gtot are large as compared to nanocalorimeters, however this excess allows columns to be used hundreds of times
with minimal enzyme degradation39. Dip type sensors in which the enzyme is immobilized directly to the transducer are common also45. A support matrix of porous carbon or silica gel (sol-gel) contains the enzymes and prevents complete desiccation46. Silica sol-gels are formed when colloidal silica solutions are allowed to gel through organometallic or acid/base catalysts47. When the sol-gel solvent is allowed to evaporate after gelling, a highly cross-linked, and high surface area (>300 m2/g) xerogel is formed. If an enzyme is present during gelling, it becomes entrapped in the gel and many have succeeded in creating enzyme containing xerogels that retain high activity. In many cases, enzyme activity is maintained better than lyophilized enzymes due to the stabilizing effects of the sol-gel48. For applications in which a monolayer of enzyme or antibody bound to a surface is desired, bioaffinity and passive absorption are commonly used.
Bioafinity based on the biotin/avidin linking system can produce nearly irreversible binding due to high binding affinity (>1 x 10-15 M) of the pair49. Many proteins can be biotinylated in neutral conditions, thereby avoiding harsh chemical crosslinking environments. Similarly, many proteins will self-assemble on gold surfaces due to thiol interaction or passively absorb due to hydrophilic/phobic interactions with surfaces at their isoelectric point pH50,51. Monolayer formation is advantageous for nanocalorimetry systems where there is no available volume for a 3-D support matrix. Regardless of the immobilization technique, Km , kcat, and optimal pH can vary due to the constraining effect of the carrier52. Steric hindrance and hydrophilic/phobic interactions with the support medium can significantly reduce enzyme activity and must be taken into account.
ELISA
Enzyme-linked immunosorbent assays (ELISAs) have become the gold standard for measuring antibodies and antigens, both native and introduced, in biological samples since the
1970s32. ELISA has replaced radioimmunoassay in most cases due to greater flexibility and the avoidance of radioactive antigens53. Of the many commercially available ELISA kits, most utilize an enzyme linked to a detecting antibody to produce a colorimetric, chemiluminescent, or fluorescent signal that can be quantified using a microplate reader54. There are several different types of ELISA, with each suited to particular applications.
The simplest ELISA (direct) relies on an antigen coated sample well in which the sample (usually diluted serum) containing the primary antibody (Ab1) of interest is added. Then a secondary antibody (Ab2) containing a reporter enzyme is added and its output read. This is best for measuring antibody titers in serum, but can suffer from serum matrix effects that lead to non- specific binding of serum component to the sample well surface. The second type (sandwich) uses sample wells that are precoated with Ab1. Then the sample containing the antigen or antibody of interest is allowed to interact. Then a reporter enzyme linked Ab2 specific to the antigen or antibody, but binding in a different spot than Ab1 is introduced and read. A sandwich ELISA is less susceptible to serum matrix-effects and when combined with an antigen standard can produce quantitative results. The final main type (competitive) relies on competitive binding of a known and unknown antigen. A known amount of enzyme linked antigen or antibody is mixed with the sample and then exposed to a coated well and read. If the antigen or antibody of interest is present in the sample, it will compete with the enzyme linked one and produce less signal55. This is well suited to situations were a complementary Ab2 is not available but quantitative results are still needed.
Optical transduction is the most common ELISA detection method, with chemiluminescence often regarded as the most sensitive, allowing antigen detection below 1 pg/ml with appropriate enzyme amplification systems56. Though less sensitive, calorimetry is a viable detection method for ELISA. Flow through calorimetric biosensors have been utilized in thermometric ELISA (TELISA) to measure ug/ml levels of insulin, IgG, and albumin to name a few57,58. Prior TELISA systems have operated in a competitive assay mode whereby an enzyme
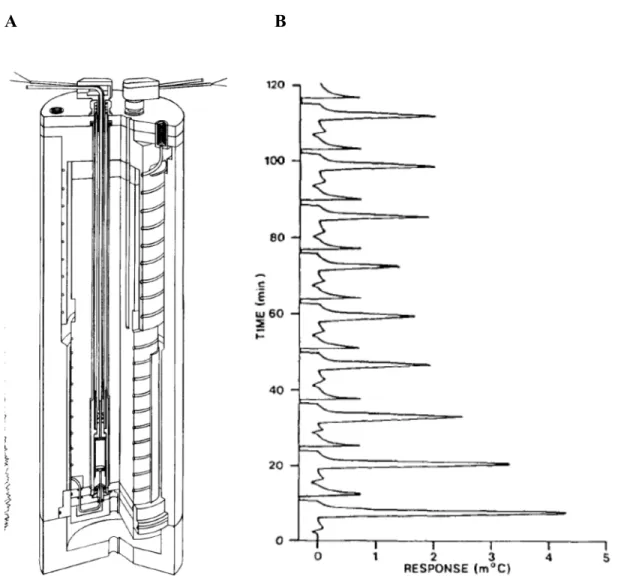
A B
Figure 2. Column based Thermometric ELISA (A) The measurement cell contained a sample and reference column, both in an insulated, temperature controlled casing. (B) Response from TELISA experiment with porcine proinsulin. In ascending order, 0, 5, 10, 20, 30 40 µg/ml, followed by triplicate samples from an E. coli cultivation. Adapted34. © 1990 Elservier Science Publishers B.V.
linked antibody or antigen is included with the sample and after washing, is exposed to the substrate to produce a measurable heat output. Being column based (Figure 2A), sample consumption is rather large (i.e. > 0.5 ml) and response time is 3 orders of magnitude slower than in nano-calorimeters59. In order to provide a quantitative measurement of an analyte in a sample, standard analyte concentration curves must be generated during sample analysis for accurate quantification of analyte concentrations in samples (Figure 2B). Additionally, personnel time and the antibodies needed to carry out ELISAs can be costly. This, in combination with sample consumption and the long time needed to perform ELISA precipitates the need for a rapid, low- volume, calibration-free ELISA system.
Point of Care Diagnostics
The goal of point-of-care (POC) diagnostics is to provide near instantaneous results for many common blood tests that previously required expensive laboratory equipment and personnel time. POC blood glucose meters made up almost half of the $15.5 billion POC market in 201360. Though not a replacement for a clinical lab test, the information provided by the testing can help diabetic patients regulate their glucose levels through medication and diet.
Phenylketonuria represents another disease where at-home monitoring is needed to help effectively manage the disease. Affecting 1 in 15,000 people worldwide, the genetic disease phenylketonuria prevents the metabolism of the essential amino acid phenylalanine (Phe), leading to high blood concentrations that can cause mental retardation if not treated though diet and/or enzyme replacement therapy61. Though much faster and more accurate than the bacterial inhibition assays of the 1960’s, tandem mass spectrometry (MS/MS) testing of blood Phe levels is still limited to the clinical laboratory62. With new enzyme replacement therapies for phenylketonuria undergoing human clinical trials, the need for at home Phe monitoring to dictate
dosing and diet is even greater63. Prior devices for POC Phe measurement have lacked long term stability33, and as with most glucose sensors are dependent on constant enzyme activity for accurate measurements.
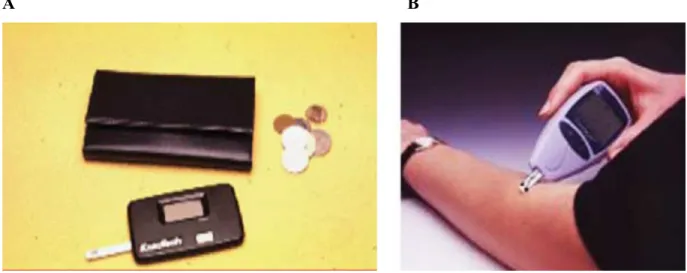
A successful POC device by definition should be useable by someone with no technical training and insensitive to most user errors. For example, early generation blood glucose monitors required the end user to enter codes related to the sensitivity of the GOx based sensor and were a common cause of errors64(Figure 3A). By improving manufacturing tolerances, changing detection methods, and increasing enzyme stability, current generation devices have eliminated coding. Equally important is patient compliance with the testing. Early devices required > 10 µl of blood, necessitating painful finger sticks prompting many patients to skip routine testing64. Current devices requiring <1 µl of blood allow for less painful arm sticks (Figure 3B). Others have developed non-invasive glucose monitors based on saliva glucose levels65,66, but these have not yet reached market as the correlation between saliva and blood glucose levels vary67. A user friendly POC device should not require the user to add reagents to
A B
Figure 3. POC glucose devices. (A) Early devices required manual coding and a large sample size.
(B) Current devices feature alternative site testing and automatic coding. Adapted65. © 2004 Elservier B.V.
or treat the sample, nor require them to precisely measure the sample volume. Controls must be in place to alert the user if there is a problem with the sample or the test itself. Lateral flow assays (LFAs) have accomplished this well through the use of parallel control reactions. Most LFAs rely on ELISA technology to selectively bind to and indicate the presence of a specific blood or urine antigen or antibody67. In the case of home pregnancy tests, if insufficient sample is provided or there are other problems with the device, the control line will not develop, indicating the user to reject the results.
Biosensors are the basis for most POC diagnostic technologies. However, only a few calorimetric biosensors suited to POC have been developed pertaining to the measurement of blood glucose or urine urea due to the large enthalpy changes associated with these reactions (- 80 and -61 kJ/mol)68,69. In the case of Davaji and Lee, a thin film resistive temperature detector is employed, so temperature senility is limited to 26 mK and noise limited minimum glucose concentration is 1.51 mM. A paper strip held the glucose oxidase enzyme in close proximity to the sensing surface, however it had to be added to the flow strip at the beginning of each measurement and evaporative effects caused a large drift in the calorimeter signal. Lai and Tadigadapa’s device relied on a Y-cut quartz resonator for temperature sensing, giving higher temperature sensitivity. However, the entire device had to be placed in a 37 ˚C oven during measurements, microfluidic pumping systems were required, and the uncertainty in their urea detection results were too high for reliable use. In order to create a user-friendly POC device, liquid handing must be automated and insensitive to user error.
One approach that avoids the high thermal conductance’s of standard microfluidics while still allowing for efficient, evaporation limited sample delivery is to utilize capillary action in thin channels to draw samples in. Much like a LFA or glucose test strip, the required amount of
sample is automatically drawn. Excess sample goes to an overflow reservoir or once full, no more sample is pulled into the reaction zone.
References
1. Reading, M., Elliott, D. & Hill, V. L. A New Approach to the Calorimetric Investigation of Physical and Chemical-Transitions. J. Therm. Anal. 40, 949-955 (1993).
2. Leavitt, S. & Freire, E. Direct Measurement of Protein Binding Energetics by Isothermal Titration Calorimetry. Curr. Opin. Struct. Biol. 11, 560-566 (2001).
3. Mabrey, S. & Sturtevant, J. M. Investigation of Phase-Transitions of Lipids and Lipid Mixtures by High Sensitivity Differential Scanning Calorimetry. Proc. Natl. Acad. Sci.
U. S. A. 73, 3862-3866 (1976).
4. Kemp, R. B. The Application of Heat Conduction Microcalorimetry to Study the Metabolism and Pharmaceutical Modulation of Cultured Mammalian Cells. Thermochim.
Acta 380, 229-244 (2001).
5. Braissant, O. et al. Biomedical Use of Isothermal Microcalorimeters. Sensors-Basel 10, 9369-9383 (2010).
6. De Corcuera, J. I. R. & Cavalieri, R. P., in Encyclopedia of Agricultural, Food, and Biological Engineering (Taylor & Francis, 2007), pp. 119-123.
7. Inomata, N. et al. Pico Calorimeter for Detection of Heat Produced in an Individual Brown Fat Cell. Appl. Phys. Lett. 100 (2012).
8. Johannessen, E. A. et al. A Suspended Membrane Nanocalorimeter for Ultralow Volume Bioanalysis. IEEE Trans Nanobioscience 1, 29-36 (2002).
9. Boyer, A. & Cisse, E. Properties of Thin-Film Thermoelectric-Materials - Application to Sensors Using the Seebeck Effect. Materials Science and Engineering B-Solid State Materials for Advanced Technology 13, 103-111 (1992).
10. Vanherwaarden, A. W. & Sarro, P. M. Thermal Sensors Based on the Seebeck Effect.
Sensor Actuator 10, 321-346 (1986).
11. Johannessen, E. A. et al. Micromachined Nanocalorimetric Sensor for Ultra-Low- Volume Cell-Based Assays. Anal. Chem. 74, 2190-2197 (2002).
12. Lee, W. et al. High-Sensitivity Microfluidic Calorimeters for Biological and Chemical Applications. Proc. Natl. Acad. Sci. U. S. A. 106, 15225-15230 (2009).
13. Kopparthy, V. L. et al. Thermoelectric Microfluidic Sensor for Bio-Chemical Applications. Sensor Actuat B-Chem 166, 608-615 (2012).
14. Zhang, Y. Y. & Tadigadapa, S. Calorimetric Biosensors with Integrated Microfluidic Channels. Biosens. Bioelectron. 19, 1733-1743 (2004).
15. Zhang, X. & Grigoropoulos, C. P. Thermal Conductivity and Diffusivity of Free- Standing Silicon Nitride Thin Films. Rev. Sci. Instrum. 68, 1115-1120 (1995).
16. Mattsson, C. G. et al., IEEE Sensors 2007 (Atlanta, GA, 2007), pp. 836-839.
17. Lorenz, H. et al. High-Aspect-Ratio, Ultrathick, Negative-Tone near-Uv Photoresist and Its Applications for Mems. Sensor Actuat a-Phys 64, 33-39 (1998).
18. Bourque-Viens, A. et al. Modelling and Experimental Validation of Thin-Film Effects in Thermopile-Based Microscale Calorimeters. Sensor Actuat a-Phys 150, 199-206 (2009).
19. Johannessen, E. A. et al. Heat Conduction Nanocalorimeter for Pl-Scale Single Cell Measurements. Appl. Phys. Lett. 80, 2029-2031 (2002).
20. Chancellor, E. B. et al. Heat Conduction Calorimeter for Massively Parallel High Throughput Measurements with Picoliter Sample Volumes. Appl. Phys. Lett. 85, 2408- 2410 (2004).
21. Wadso, I. Design and Testing of a Micro Reaction Calorimeter. Acta Chem. Scand. 22, 927-& (1968).
22. Briggner, L. E. & Wadso, I. Test and Calibration Processes for Microcalorimeters, with Special Reference to Heat Conduction Instruments Used with Aqueous Systems. J.
Biochem. Biophys. Methods 22, 101-118 (1991).
23. Lubbers, B. & Baudenbacher, F. Isothermal Titration Calorimetry in Nanoliter Droplets with Subsecond Time Constants. Anal. Chem. 83, 7955-7961 (2011).
24. Strang, G. & Fix, G. J., An Analysis of the Finite Element Method. (Prentice-Hall Englewood Cliffs, NJ, 1973).
25. Reddy, J. N. & Gartling, D. K., The Finite Element Method in Heat Transfer and Fluid Dynamics. (CRC press, 2010).
26. Nix, W. Mechanical Properties of Thin Films. Metall. Trans. A 20, 2217-2245 (1989).
27. Voller, A., Bartlett, A. & Bidwell, D. E. Enzyme Immunoassays with Special Reference to Elisa Techniques. J. Clin. Pathol. 31, 507-520 (1978).
28. Du, D. et al. Sensitive Immunosensor for Cancer Biomarker Based on Dual Signal Amplification Strategy of Graphene Sheets and Multienzyme Functionalized Carbon Nanospheres. Anal. Chem. 82, 2989-2995 (2010).
29. Ahmed, M. U. et al. Electrochemical DNA Biosensor Using a Disposable Electrochemical Printed (Dep) Chip for the Detection of Snps from Unpurified Pcr Amplicons. Analyst 132, 431-438 (2007).
30. Chen, X. et al. Electrochemical Immunosensor for Simultaneous Detection of Multiplex Cancer Biomarkers Based on Graphene Nanocomposites. Biosensors Bioelectron. 50, 356-361 (2013).
31. Xie, B. et al. Fast Determination of Whole-Blood Glucose with a Calorimetric Micro- Biosensor. Sensor Actuat B-Chem 15, 141-144 (1993).
32. Premjeet, S. et al. Enzyme-Linked Immuno-Sorbent Assay (Elisa), Basics and It’s Application : A Comprehensive Review. J. Pharm. Res. 4, 4581-4583 (2011).
33. Zhuo, W. et al., presented at the Engineering in Medicine and Biology Society, 2005.
IEEE-EMBS 2005. 27th Annual International Conference of the, 2005 (unpublished).
34. Danielsson, B. Calorimetric Biosensors. J. Biotechnol. 15, 187-200 (1990).
35. Nelson, D. L., Lehninger, A. L. & Cox, M. M., Lehninger Principles of Biochemistry.
(W.H. Freeman, New York, 2008).
36. Liu, H. et al. Enthalpy Change and Mechanism of Oxidation of O-Phenylenediamine by Hydrogen Peroxide Catalyzed by Horseradish Peroxidase. Thermochim. Acta 443, 173- 178 (2006).
37. Hamilton, T. M., Dobie-Galuska, A. A. & Wietstock, S. M. The O-Phenylenediamine- Horseradish Peroxidase System: Enzyme Kinetics in the General Chemistry Laboratory.
J. Chem. Educ. 76, 642 (1999).
38. Domalski, E. S. Selected Values of Heats of Combustion and Heats of Formation of Organic Compounds Containing the Elements C, H, N, O, P, and S. J. Phys. Chem. Ref.
Data 1, 221-277 (1972).
39. Lammers, F. & Scheper, T. Thermal Biosensors in Biotechnology. Adv. Biochem. Eng.
Biotechnol. 64, 35-67 (1999).
40. Goldberg, R. N., Tewari, Y. B. & Bhat, T. N. Thermodynamics of Enzyme-Catalyzed Reactions--a Database for Quantitative Biochemistry. Bioinformatics 20, 2874-2877 (2004).
41. Bar-Even, A. et al. The Moderately Efficient Enzyme: Evolutionary and Physicochemical Trends Shaping Enzyme Parameters. Biochemistry (Mosc). 50, 4402-4410 (2011).
42. Sheldon, R. A. Enzyme Immobilization: The Quest for Optimum Performance. Adv.
Synth. Catal. 349, 1289-1307 (2007).
43. Minteer, S. D., Enzyme Stabilization and Immobilization : Methods and Protocols.
(Humana Press, New York, 2011).
44. Bowers, L. D. & Carr, P. W. An Immobilized-Enzyme Flow-Enthalpimetric Analyzer:
Application to Glucose Determination by Direct Phosphorylation Catalyzed by Hexokinase. Clin. Chem. 22, 1427-1433 (1976).
45. Gibson, T. D., Pierce, B. L. J. & Parker, S. M., in Biosensors for Food Analysis, edited by A. O. Scott (Woodhead Publishing, 2005), pp. 46-53.
46. Ellerby, L. et al. Encapsulation of Proteins in Transparent Porous Silicate Glasses Prepared by the Sol-Gel Method. Science 255, 1113-1115 (1992).
47. Brinker, C. J. & Scherer, G. W., Sol–Gel Science. (Academic Press, San Diego, 1990).
48. Bhatia, R. B. et al. Aqueous Sol−Gel Process for Protein Encapsulation. Chem. Mater.
12, 2434-2441 (2000).
49. Diamandis, E. P. & Christopoulos, T. K. The Biotin-(Strept)Avidin System: Principles and Applications in Biotechnology. Clin. Chem. 37, 625-636 (1991).
50. Hakkinen, H. The Gold-Sulfur Interface at the Nanoscale. Nature chemistry 4, 443-455 (2012).
51. Ebersole, R. C. et al. Spontaneously Formed Functionally Active Avidin Monolayers on Metal-Surfaces - a Strategy for Immobilizing Biological Reagents and Design of Piezoelectric Biosensors. J. Am. Chem. Soc. 112, 3239-3241 (1990).
52. Tischer, W. & Wedekind, F., in Biocatalysis - from Discovery to Application, edited by Wolf-Dieter Fessner, A. Archelas, D. C. Demirjian et al. (Springer Berlin Heidelberg, 1999), Vol. 200, pp. 95-126.
53. Fowler, E. & Cheng, N. Comparison of Radioimmunoassay and Elisa Methods for Detection of Antibodies to Chromatin Components. J. Immunol. Methods 62, 297-303 (1983).
54. Lequin, R. M. Enzyme Immunoassay (Eia)/Enzyme-Linked Immunosorbent Assay (Elisa). Clin. Chem. 51, 2415-2418 (2005).
55. Voller, A., Bidwell, D. E. & Bartlett, A. Enzyme Immunoassays in Diagnostic Medicine.
Theory and Practice. Bull. W.H.O. 53, 55-65 (1976).
56. Avrameas, S. Amplification Systems in Immunoenzymatic Techniques. J. Immunol.
Methods 150, 23-32 (1992).
57. Mattiasson, B. et al. Thermometric Enzyme Linked Immunosorbent Assay: Telisa.
Biochim. Biophys. Acta 483, 221-227 (1977).
58. Mattiasson, B. & Nilsson, H. An Enzyme Immunoelectrode. Assay of Human Serum Albumin and Insulin. FEBS Lett. 78, 251-254 (1977).
59. Danielsson, B. The Enzyme Thermistor. Appl. Biochem. Biotechnol. 7, 127-134 (1982).
60. Elder, M., Point of Care Diagnostics, BCC Research, (2014).
61. Gamez, A. et al. Toward Pku Enzyme Replacement Therapy: Pegylation with Activity Retention for Three Forms of Recombinant Phenylalanine Hydroxylase. Molecular therapy : the journal of the American Society of Gene Therapy 9, 124-129 (2004).
62. Banta-Wright, S. A. & Steiner, R. D. Tandem Mass Spectrometry in Newborn Screening:
A Primer for Neonatal and Perinatal Nurses. J. Perinat. Neonatal Nurs. 18, 41-58; quiz 59-60 (2004).
63. Longo, N. et al. Single-Dose, Subcutaneous Recombinant Phenylalanine Ammonia Lyase Conjugated with Polyethylene Glycol in Adult Patients with Phenylketonuria: An Open- Label, Multicentre, Phase 1 Dose-Escalation Trial. The Lancet 384, 37-44.
64. Newman, J. D. & Turner, A. P. F. Home Blood Glucose Biosensors: A Commercial Perspective. Biosensors Bioelectron. 20, 2435-2453 (2005).
65. Soni, A. & Jha, S. K. A Paper Strip Based Non-Invasive Glucose Biosensor for Salivary Analysis. Biosensors Bioelectron. 67, 763-768 (2015).
66. Agrawal, R. P. et al. Noninvasive Method for Glucose Level Estimation by Saliva. J Diabetes Metab 4, 266 (2013).
67. Yetisen, A. K., Akram, M. S. & Lowe, C. R. Paper-Based Microfluidic Point-of-Care Diagnostic Devices. Lab Chip 13, 2210-2251 (2013).
68. Davaji, B. & Lee, C. H. A Paper-Based Calorimetric Microfluidics Platform for Bio- Chemical Sensing. Biosensors Bioelectron. 59, 120-126 (2014).
69. Son Vu Hoang, L. & Tadigadapa, S., presented at the Sensors, 2012 IEEE, 2012 (unpublished).
CHAPTER II
Isothermal Titration Calorimetry In Nanoliter Droplets With Sub-Second Time Constants1
By
Brad Lubbers & Franz Baudenbacher
Abstract
We reduced the reaction volume in microfabricated suspended-membrane titration calorimeters to nanoliter droplets and improved the sensitivities to below a nanowatt with time constants of around 100 ms. The device performance was characterized using exothermic acid- base neutralizations and a detailed numerical model. The finite element based numerical model allowed us to determine the sensitivities within 1% and the temporal dynamics of the temperature rise in neutralization reactions as a function of droplet size. The model was used to determine the optimum calorimeter design (membrane size and thickness, junction area, and thermopile thickness) and sensitivities for sample volumes of 1 nl for silicon nitride and polymer membranes. We obtained a model sensitivity of 153 pW/Hz1/2 for a 1 µm SiN membrane and 79 pW/Hz1/2 for a 1 µm polymer membrane. The time constant of the calorimeter system was determined experimentally by using a pulsed laser to increase the temperature of nanoliter sample volumes. For a 2.5 nanoliter sample volume, we experimentally determined a noise equivalent power of 500 pW/Hz1/2 and a 1/e time constant of 110 ms for a modified commercially available infrared sensor with a thin-film thermopile. Furthermore, we
1 Reproduced with permission from Lubbers, B. & Baudenbacher, F. Isothermal Titration Calorimetry in Nanoliter Droplets with Subsecond Time Constants. Anal. Chem. 83, 7955-7961 (2011). © 2011 American Chemical Society.
demonstrated detection of 1.4 nJ reaction energies from injection of 25 pl of 1 mM HCl into a 2.5 nl droplet of 1 mM NaOH.
Introduction
Isothermal titration microcalorimetry is one of the most powerful techniques to characterize chemical binding mechanism and biological processes through enthalpy changes at constant temperatures1. In a series of additions, reagent are injected into a sample volume under isothermal conditions and by integrating small temperature increases over time, as compared to the baseline temperature, reaction enthalpies are determined2,3.
Micromachined membrane based calorimeters allow for a dramatic reduction in sample volumes and thermal mass and therefore enable measurements with very small heat capacities4. Combined with a sensitive thermometer relying on the Seebeck effect, these devices reach detection limits in the nanowatt range5. Since change in enthalpy is a nearly universal fingerprint of binding reactions and phase transitions, these devices are used in areas such as bioscience6, biophysical chemistry7, chemical engineering8, drug development9, antibody engineering10 and cellular assays to determine cellular growths or metabolic rates11.
Many biothermodynamic processes occur at characteristic time constants linked to intrinsic physical kinetics or metabolic/signaling activity of living cells. Of particular interest is protein binding/folding/unfolding12, phase transitions,4 or physiometry to determine the activity of living cells13.
The reduction of the sample volume implies a decrease in the time constant; allowing the temporal dynamics of the chemical and biological processes become accessible. In this study we reduced the reaction volume to nanoliter droplets and utilized a membrane based calorimeter to
obtain time constants on the order of 100 ms and detection of nJ reaction energies. The response time of the system depends on the location of the heat generated, the diffusion of heat in the sample volume, and the thermal coupling of the sample volume to the heat sink. To understand these different contributions, we derived a detailed finite element model to represent the data and used the model to optimize the device performance.
Experimental Section
Sensor Description
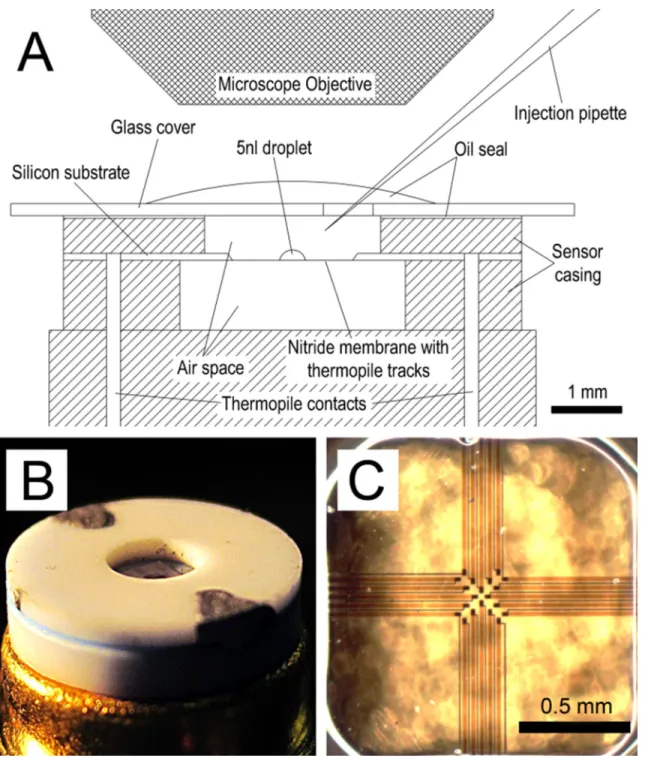
In order to measure sub-nanowatt reaction enthalpies and characterize chemical processes, very small ΔT (<100 µK) must be detected. A commercial infrared (IR) radiation sensor (S-25, Dexter Research) was evaluated for calorimetry as the manufacturer states a sensitivity of 193 V/W, a time constant (τ) of 9 ms, and a moderate thermopile resistance of 23 KΩ, which defines the noise floor of the system. Since the sensor is designed for IR detection and not for calorimetry, the stated sensitivity and τ will vary due to the presence of the sample drop and the method of calibration. The sensor consists of 20 bismuth/antimony (Bi/Sb) thermopile junctions on a suspended 1.5 µm thick silicon nitride/silicon oxide membrane. A 0.5 mm deep by 2 mm wide chamber is formed on top of the membrane by the sensor casing and is an ideal size for holding small, nanoliter sample droplets (Figure 4B).
Amplifier Design
The intrinsic noise of the micromachined calorimeter is dominated by the Johnson- Nyquist noise of the thermopiles and can be described by the spectral noise density:
𝑉𝑛 = �4 𝑘𝐵𝑇𝑅 (11)
Figure 4. Device layout. (A) Side-view schematic of calorimeter setup showing chamber sealing with oil and sample delivery pipette. Additional shielding (not shown) around the sensor reduces thermal fluctuation noise. (B) Angle view of sensor showing sample well in center. (C) Top view of sensor membrane showing 20 Bi/SB thermopile junctions with an active area of 0.0625 mm2 and sensitivity of 3600 µV/K.
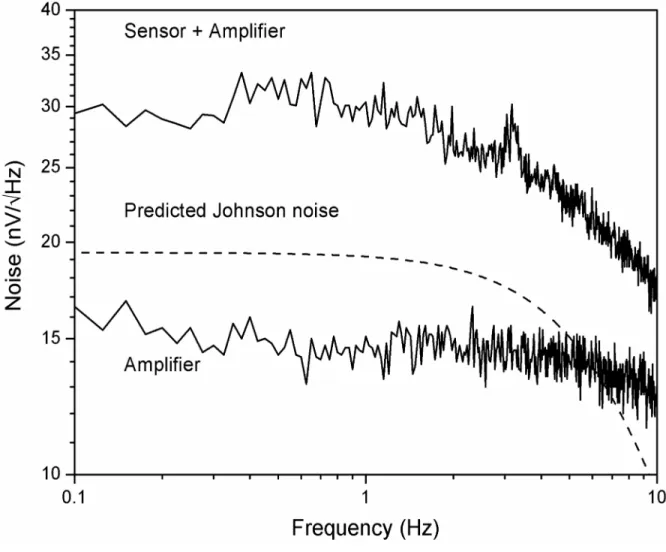
where kB is the Boltzmann’s constant, T the resistors absolute temperature, and R the resistance of the thermopile. The 23 kΩ thermopile resistance results in a noise density of 19.4 nV/Hz1/2. In order to operate the calorimeter close to the intrinsic noise floor, the amplifier noise should be much smaller so as not to contribute substantially to the overall noise. Since isothermal calorimeters are typically operated near DC, the contribution of flicker or 1/f noise from the amplifier often becomes a dominating factor. Therefore, we selected a zero offset DC chopper amplifier (LMP2021, National Semiconductor) as the amplifier for our read out circuitry. Noise spectra were measured using a 3265A Dynamic Signal Analyzer (Hewlett-Packard). The noise spectrum of our amplifier is essentially white with a noise floor of 15 nV/Hz1/2, which leads to an overall sensor and amplifier noise of 30 nV/Hz1/2 (Figure 5). Above 1.5 Hz, the sensor plus amplifier signal decreases due to the characteristics of the 7 Hz low pass filter.
The cutoff frequency of the amplifier depends on the thermal time constant, which in turns is a function of sample volume. At a minimum realistic sample volume of 2.5 nl we obtained a time constant of 110 ms or f-3dB of 1.45 Hz. This represents the bulk time constant of the sensor and therefore we selected a cutoff frequency of 7 Hz to suppress 60 Hz line noise and reduce the Johnson noise bandwidth. The amplifier output was sampled using a National Instruments 12 bit PCI-6024E A/D card. Through oversampling and decimation, its effective bit count was increased to 16 and therefore the digitization noise was reduced to 7 nV/Hz1/2 at a gain of 25,000. All measurements were performed at room temperature (22-24 °C). During setup and measurements, the chamber of the sensor was covered by a glass cover slide with an access hole drilled for sample delivery (Figure 4). The cover slide was sealed with mineral oil to prevent sample evaporation. Thermal fluctuations were greatly reduced by adding additional copper shielding to the sensor casing. Without the additional thermal shielding the sensor was extremely
susceptible to any air drafts or changes in the ambient temperature. In addition, the grounded copper ring and a metal amplifier enclosure reduced EMF noise. The combined effects of the low noise amplifier, shielding, and filtering reduced the RMS noise to 30.1 nV in the 0-1 Hz bandwidth and the peak-to-peak noise of the system to approximately 290 nV over a 10 second window under actual experimental conditions.
Figure 5. Noise spectral density of the amplifier, sensor, and calculated Johnson noise of the sensor, all at a 7 Hz cutoff. The combined sensor and amplifier noise is 30.1 nV in a 1 Hz bandwidth and free of 1/f noise.
Sample Delivery
Liquid sample injections were performed using a micromanipulator (MP-285, Sutter Instrument Co.) and a pressure driven injection system (PicoSpritzer II, Parker Hannifin Corp.), both controlled through LabVIEW (Appendix C). This allowed automated pipette placement and sample injection of sample volumes between 25 pl and 50 nl onto the sensor. Pipettes were prepared by pulling on a Flaming/Brown pipette puller (P-87, Sutter Instrument Co.) and fire polished to a 1-20 µm ID using a microforge (MF-9, Narishige). Pipettes were calibrated before and after measurements by making repeated injections into a small diameter tube and measuring the total volume dispensed. In comparison to microfluidic based calorimeter devices, there is no noise contribution from the flow of reactants14
Sample Stabilization
Since our sample volume is a free standing nl sized droplet, evaporation is a major issue.
In an unsealed sensor chamber, 2.5 nl of water would evaporate in a few seconds, so we have to stabilize the sample volume and reduce evaporation. The main strategy involved the use of a glass lid with a sealed sample injection port (Figure 4A). Since pipette access to the sensor surface was necessary for sample delivery, mineral oil was used as vapor tight seal that a micron sized delicate pipette tip could penetrate. However, sample evaporation was never completely reduced to zero and becomes critical as the sample volume is reduced14. For example a 5 nl water drop left on the sensor overnight would evaporate completely. This residual evaporation leads to a constant cooling flux and offsets the sample temperature slightly but measurably from the ambient temperature. The offset was integrated over the time it took for the evaporation of the droplet and was equivalent to the enthalpy of vaporization of the sample volume at the beginning. As the evaporating droplet changes geometry or droplets are injected, the evaporative
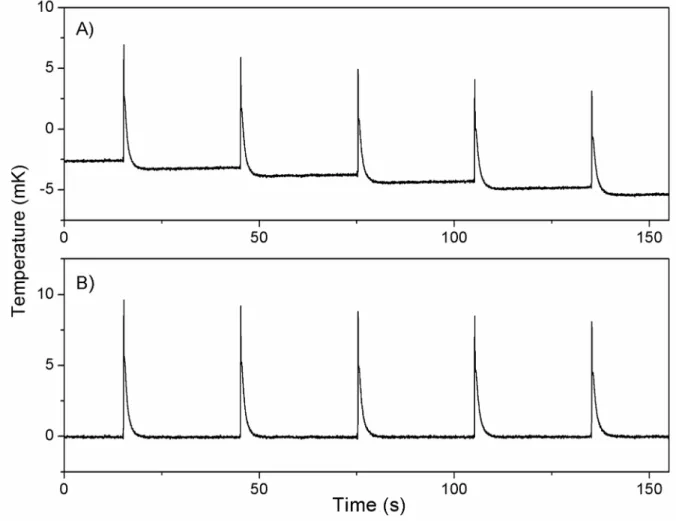
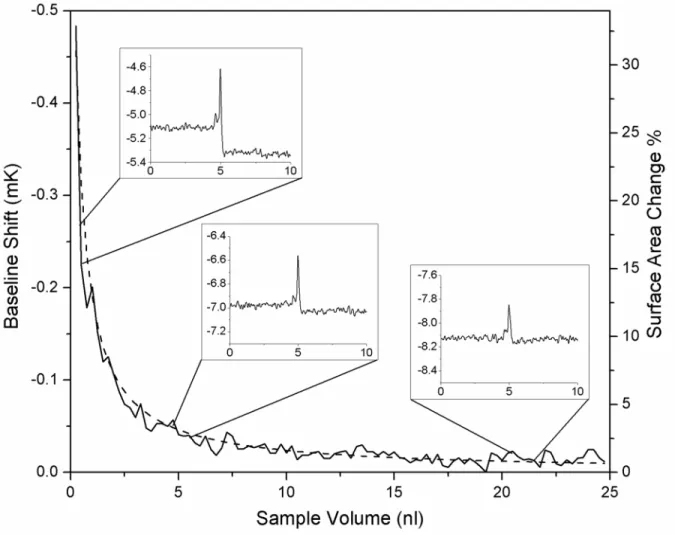
flux will be altered. Therefore, injections of liquid reagent into a sample drop results in a lower signal baseline (Figure 6). When smaller water drops were repeatedly injected to increase the base droplet, it was found that the baseline shift scaled with the change in surface area of the drop (Figure 7). Though the evaporative flux per area remains constant during an experiment, it
varies between experiments due to changes in sensor sealing efficiency. In order to account for the baseline shift when determining the energy evolved in a reaction, the shift occurs instantly and can be approximated as a step function with amplitude y. When the signal is convolved with a step function of amplitude -y, the original signal can be easily recovered (Figure 6B). The
Figure 6. Baseline correction. A series of 100 pl injections of 0.05M HCl into 2.5 nl of 0.05M NaOH obtained for calibration. (A) Raw data and (B) data with the baseline shift and offset corrected for.
evaporative sample cooling leads to a temperature difference (ΔT) between the sample volume and the injected reactants. This temperature difference causes a slight peak during any injection and the peak energy equals the specific heat of the injected sample multiplied by ΔT. The water injection peaks in Figure 7 have energies of 4.6 – 8.2 nJ, giving a calculated ΔT of 4.8 – 8.6 mK which is a realistic ΔT. We were able to eliminate, and even drive this peak negative, by holding the base drop several mK above ambient temperature using a focused laser.
Figure 7. Baseline shift to volume relationship. Shift in baseline of water droplets injected with 250 pl of additional water (inserts). The baseline shift scales with the surface area change (dashed line) of the drops due to the increased evaporative flux from the drop surface. The positive spikes during injection are due to the ΔT between the injected water and the cooled base droplet.
Time Constant Measurements
The sensor time constant (τ) was measured at different sample volumes using a 650 nm laser as a heat source. The laser was focused through the microscope optics to a point in the center of the sensor ~100 µm wide. Starting with an empty membrane, the laser was pulsed slowly (0.1 Hz) and 1 nl of ddH2O was repeatedly injected onto the sensor until 50 nl was reached. τ was calculated from the 1/e rise and fall time at 0-50 nl using MATLAB (Appendix A).
Sensitivity Calibration
Sensitivity was determined using the neutralization reaction between HCl and NaOH.
Stocks of HCl and NaOH were freshly prepared in ddH2O at concentrations of 0.01 M, 0.05 M, 0.1 M, and 0.5 M filtered with a 0.22 µm syringe filter before use. New glass pipettes were used each time to prevent contamination and tip fouling. To calibrate, a drop of NaOH between 2.5-50 nl was injected onto the sensor membrane and allowed to stabilize resulting in a flat temperature baseline. Then, a pipette containing HCl was used to inject small (0.5%-2% of base drop) volumes of HCl into the center of the NaOH drop. Identical molarity of the acid and base were used to eliminate dilution effects. The signal output was recorded in LabVIEW (Appedix C) and then exported to MATLAB for data analysis (Appendix A). Sensitivity was determined by integrating the area under the curve from the exothermic reaction and dividing by the predicted reaction energy.
Sensor Modeling
In order to validate our findings and provide insights on how to optimize measurement sensitivity, a 2-D radial heat conduction model of the sensor was constructed in Comsol
Multiphysics. The model included the sensor casing, glass cover, Si substrate, membrane, thermopiles, air spaces, and sample droplet. The heat origin was a sphere the same size as the injected HCl in the middle of the NaOH drop. Since some parameters (membrane thermal conductivity (Gmem) and total thermopile Seebeck coefficient (Stot)) were not provided by the sensor manufacturer, these were determined by least squares fitting of the model to experimental data. Using these parameters, sensitivity and τ were calculated in MATLAB using the Comsol data at several volumes between 0-50 nl. This model was then utilized in designing a 2nd generation calorimeter with optimized dimensions at small sample volumes for improvements in sensitivity and τ (Appendix B).
Results and Discussion
Modeling
The use of Comsol Multiphysics allowed for rapid modeling and the ability to least squares fit the modeling parameters to the experimental data in MATLAB. The three main parameters characterizing a calorimeter are power sensitivity (P), minimum detectable power (Pmin), and time constant (τ). They are related through the following equations:
𝑃 = 𝑆𝑡𝑜𝑡⁄𝐺𝑡𝑜𝑡 (12)
where Stot is the total Seebeck coefficient of the thermopiles and Gtot is the total thermal conductance away from the sample drop. The minimum detectable power is predicted by:
𝑃𝑚𝑖𝑛 = 𝛷 𝑃⁄ (13)
where Φ is the total electronic and thermal noise of the system. The temporal response is predicted by