It has greatly expanded the fields of application over the past decades, benefiting from the advances in MEMS technology. In this chapter, a series of gold nanodots on a flexible membrane is introduced to optimize the performance of the sensor.
NANOPHOTONIC APPLICATION TO
TARGETED MOLECULAR ANALYSIS
Introduction to plasmonic fluorescence enhancement
Challenges for plasmonic fluorescence enhancement
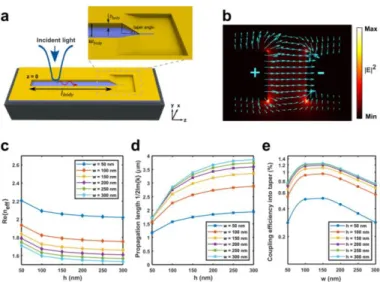
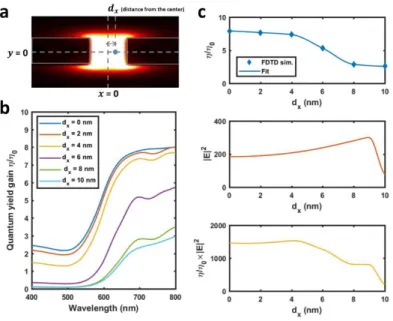
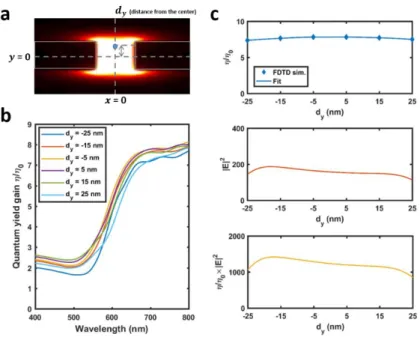
The device design was optimized for (a) efficient coupling of the excitation light into the device body, (b) optimal transverse confinement of the EM field—high and uniform |E|2 of the guided mode—through the constriction, and (c) efficient longitudinal confinement of the EM field at the tip. Finite-difference time-domain (FDTD) simulations were used to achieve effective confinement of the fundamental antisymmetric (AS) mode of the SPP at the 3D-narrowed gap tip of the plasmonic nanocavity.

Demonstration of 3D tapered nanocavity at single molecular resolution
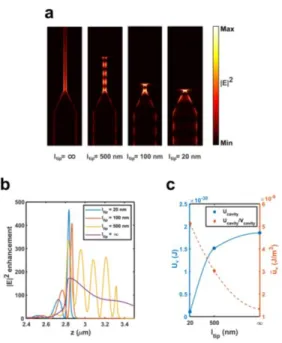
As discussed earlier, the tip region of the device exhibits a hotspot of uniformly distributed, strongly confined electromagnetic field (Figure 1.4.8a). Plot shows data points, mean and s.d. for six units at each condition. a) Cross-sectional view of the hotspot formed at the tip.
Conclusion
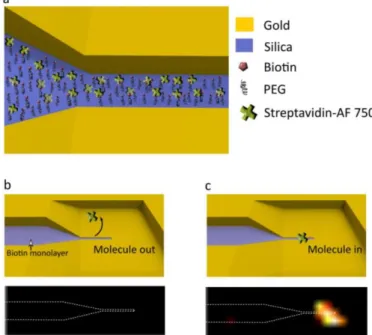
Fluorescence intensity (subtracted background) obtained using peaks of different lengths after performing the biotin and SAF-750 binding assay.
Methods and materials .1 Device fabrication .1 Device fabrication
- Simulations
- Molecular binding tests
- Calculation of experimental enhancement factor
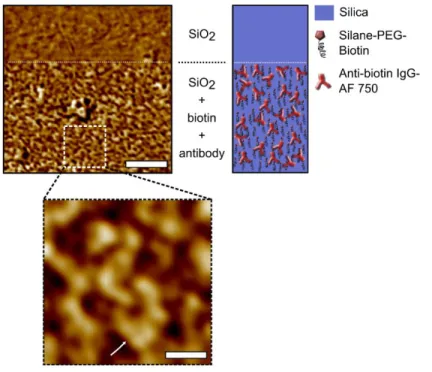
The solution was added to the substrates with stirring and dye molecules were allowed to bind to the functionalized substrates for one hour. Solution was added to the chips and left undisturbed for one hour to allow physisorption of the peptide hormone to the surfaces. BSA (0.1%) was then added to the chips and allowed to interact with the surface to account for any nonspecific binding.
The antibody was diluted in PBS at a concentration of 0.05 mg/ml and added to the chips. To test the behavior of smaller probes, dye molecules (AF-750) were covalently linked directly to the silica base of the nanocavities.
Bibliography
INTRAOCULAR PRESSURE (IOP) SENSING
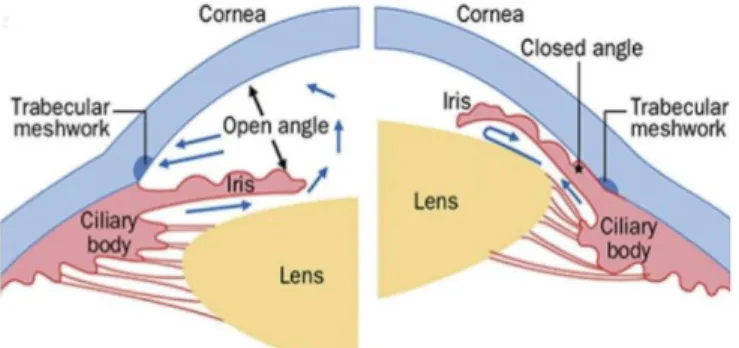
Introduction to glaucoma
IOP can be influenced by activity, diet and other factors that are not yet fully understood [17-21]. This is similar to the approach used to treat other chronic progressive diseases such as hypertension and diabetes, where home monitoring of blood pressure and blood sugar levels is an integral part of disease management. Furthermore, pathophysiological studies and drug discovery research require accurate, frequent, and preferably automated assessments of IOP in humans and laboratory animals [23,24].
Over the past decades, animal models have contributed significantly to the understanding of the cellular and molecular bases of glaucoma [ 25 ]. However, the relationship between IOP and other factors, such as obesity, genetic contributions [26,27], retinal ganglion cell death [28], age and ocular blood circulation [29], is not yet fully understood due to the limited accuracy and utility of conventional tonometry.
IOP sensing techniques
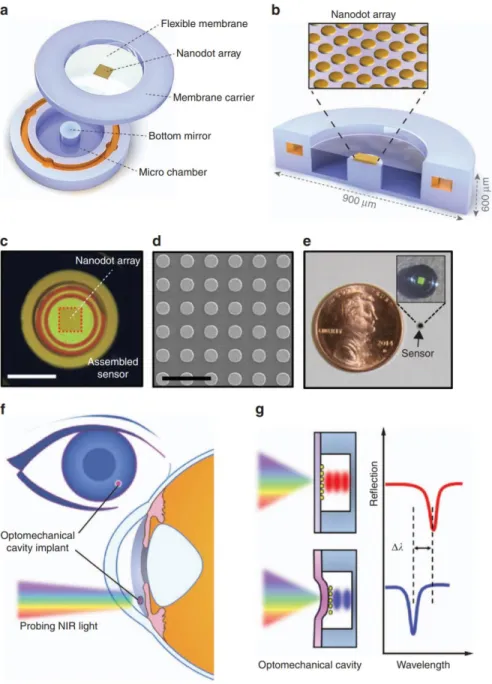
Design and principle of nanophotonic IOP sensor
A schematic cross-sectional view of an assembled sensor and a zoomed-in image of the nanodot array in the SiN membrane (inset). As expected, the resonance (peak-to-valley) amplitude is maximized when the nanodot diameter is 600 nm, matching the reflectance of the nanodot-integrated SiN membrane to that of Si (0.3) (Figure 2.3.2e). The thickness of the SiN membrane was optimized to maximize the amplitude of the sensor resonance.
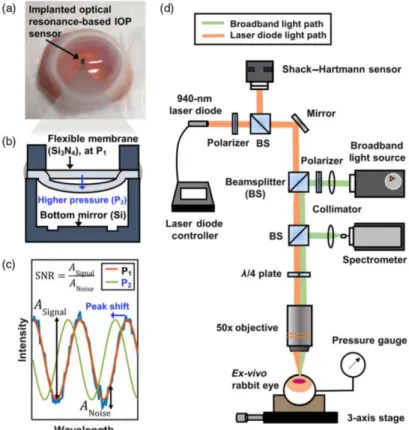
600 μm was chosen as the diameter of the SiN-membrane to facilitate the fabrication and assembly of the cavity. The accuracy, range and linearity of the fabricated nanophotonic IOP sensors were tested in a controlled pressure chamber filled with saline (Figure 2.3.4a).
Ex vivo and in vivo demonstration of nanophotonic IOP sensor
The two haptic arms then unfolded spontaneously to extend into the iridocorneal angle and mechanically anchor the sensor in the anterior chamber (Figures 2.4.2e, f). The sensor is the black circular object with a central bright area representing the nanodot array. The translucent material surrounding the sensor is the epoxy adhesive used in sensor construction and sensor attachment to the IOL.
Before the saline injection, the sensor IOP reading was 8 mmHg and the TonoVet-derived IOP was 6.3 mmHg. The sensor-derived IOPs (black symbol, n =20) and TonoVet-derived IOPs (open blue circles, n=6) mirror each other, showing an increase in IOP after injection followed by a gradual decrease over the following 43 -55 min.

Effect of optical aberrations on IOP readouts using nanophotonic IOP sensor
The SNR of the acquired spectra from the implanted reference chips showed a negative correlation with the rms wavefront error (Figure 2.5.2e). The magnitude of the optical aberrations we characterized in the ex vivo rabbit eyes were very close to the values previously reported in other studies [79]. This is partly attributed to the smaller defocus term in the second-order rms wavefront error as the depth of the sensor location decreased and allowed for better focusing.
The rms wavefront error increased with the distance from the implant to the center of the pupil or the optical axis of the eye. The first-order Zernike coefficients contributed the most to the larger rms wavefront error observed at a greater distance from the center of the pupil (Figure 2.5.4d).
Conclusion
Photograph of three IOP sensors implanted in the anterior chamber of an ex vivo rabbit eye. c) RMS wavefront error of the reading from each implanted IOP sensor. d) error of the effective wavefront of each Zernike order at different locations. e) Comparison between digital manometer readings and implanted IOP sensors. f) SNR optical spectra of implanted IOP sensors plotted against effective wavefront error. In vivo testing demonstrated that the implanted nanophotonic IOP sensors were able to reliably measure short-term IOP changes that matched the simultaneously acquired TonoVet IOP readings. Furthermore, the effect of optical aberrations on the accuracy and SNR of optical IOP monitoring obtained using nanophotonic IOP sensors was studied.
If nanophotonic IOP sensors are eventually used in the clinical setting, sensors mounted on silicone haptics could potentially be implanted in all glaucoma patients in addition to those undergoing lens extraction and IOL placement. On the other hand, sensors mounted on silicone haptics did not elicit any noticeable inflammatory response in the anterior chamber after implantation, and the ocular recovery was excellent even on the second day after surgery with only mild incisional edema.
Methods and materials
- Nanophotonic IOP sensor fabrication
- Surgical Procedures for in vivo testing
- Experimental setup and calibration for aberration study
The sensor was attached to the silicone haptics with medical grade silicone adhesive (Med-1000 RTV silicone adhesive, Nusil Technology, Carpenteria, CA, USA). The use of animals in this study complied with the Association for Research in Vision &. A one-piece acrylic IOL (Acrysof SN60 WF, Alcon, Fort Worth, TX, USA) with a sensor attached was placed in the recommended IOL cartridge and loaded into the IOL inserter according to the manufacturer's instructions.
The antibiotic cefazolin was applied subconjunctivally and a neomycin/dexamethasone ointment was applied to the eye. The rabbit was then removed from anesthesia and allowed to resuscitate before being returned to the housing area.
Bibliography
Therefore, we could obtain the aberration data only from the active area of the sensor and the corneal area right above it. Before use, the integrated SH sensor was pre-characterized to remove any aberrations that may arise from the objective lens and other optical components in the experimental setup; this was done using a polished silicon chip immersed in water as a reflective surface for double-door calibration. After calibration, the experimental setup showed an accuracy of 9.317 nm or about λ∕101, which is very close to the accuracy of λ∕100 specified by the manufacturer.
ANGLE-AND-POLARIZATION INDEPENDENT
STRAIN/PRESSURE SENSING
Introduction to plasmonics
Challenges for plasmonic sensors
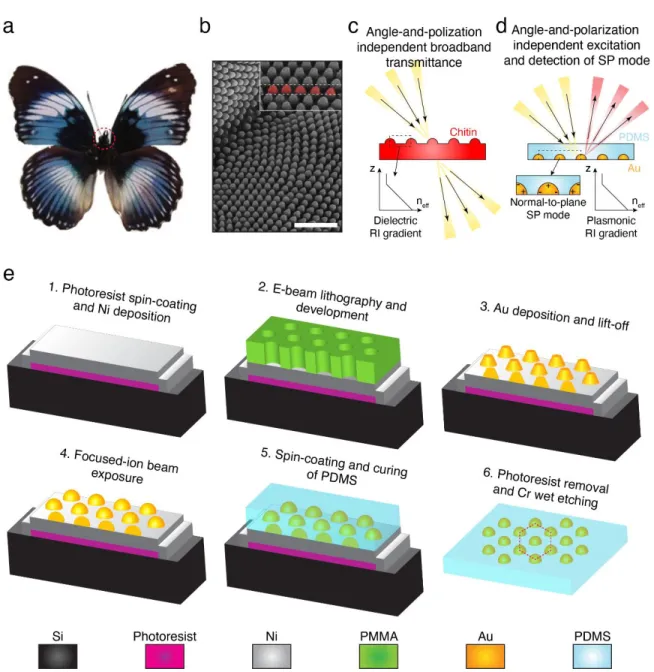
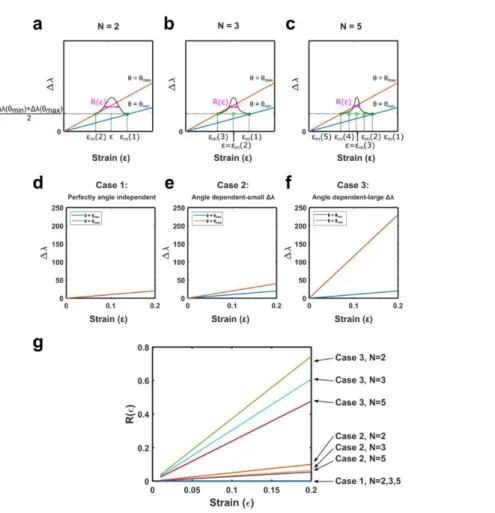
The paraboloid shape of the plasmonic RI gradient array is inspired by the geometry of protrusions on butterfly corneas. The left axis in Figure 3.3.2c shows the relationship between plasmonic RI gradient uniformity (σ(|dneff/dz|)) and |Δλ|. Normal-to-plane peaks can be detected within different ranges of θ depending on f and r of the plasmonic RI gradient array.
In contrast to the plasmonic RI gradient array, the non-RI gradient array exhibits an angle-dependent peak (Figure 3.3.4e). On the other hand, the gain peak of the non-RI gradient array is angle dependent, indicating the angle dependence of 𝑝⃗.
Opto-mechanical properties of normal-to-plane mode
When φ is plotted against r, the transition is clearly seen as the φ of the normal-to-plane mode is much smaller than that of the out-of-plane mode (Figure 3.4.1b). In doing so, we experimentally demonstrate the transition from an in-plane normal mode to an out-of-plane mode at f × (r while calculating R(ε) of the array under each strain. Comparing R(ε) before and after the transition, we we show that the in-plane normal mode is critical for angle- and polarization-independent performance.
A similar trend with the dependence on εy is observed in the TE polarization; the normal-to-plane mode is supported regardless of εx and switches to the out-of-plane mode under εy. This results in equation 3.4.5, which shows a significant dependence of the normal-to-plane mode on y.
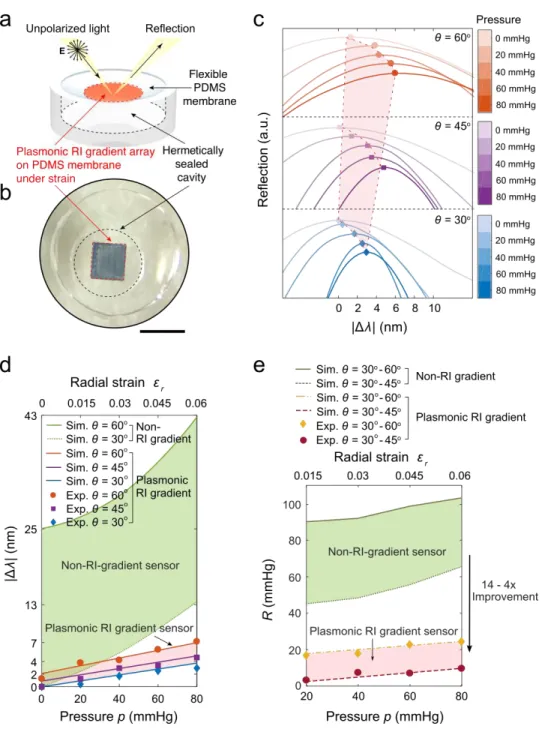
Application of normal-to-plane mode to angle-and-polarization independent strain/pressure sensing strain/pressure sensing
The maximum f achievable in the fabrication process (see 3.7 Methods and Materials) is 0.8 due to increasing structural instability of the developed e-beam resist at a larger aspect ratio. Based on the finite-element method (FEM) analysis, the thickness of the membrane was optimized to provide a displacement range of 0 – 160 um and a radial deformation range of. In Figure 3.5.1d, the experimental peak locations obtained from Figure 3.5.1c show good agreement with the simulation results (solid lines).
R(p) is calculated based on the following equation by replacing the terms involving ε with the corresponding terms expressed on p.
Conclusion
Methods and materials .1 Sample fabrication .1 Sample fabrication
- Computational analysis
- Optical measurements
A uniform mesh size of 1.5 nm was used in all structures and optical constants of Au from Johnson and Christy [52] were used. We adapted a setup for angular variable specular reflectance measurements by using a commercial spectrometer with a resolution of 0.4 nm (Flame, Ocean optics Inc.), a broadband tungsten light source (SLS201L, Thorlabs Inc.), a 0.014-NA objective (2X Plan Apo Infinity Corrected Long WD, Mitutoyo), and two rotation stages for the sample (CR1, Thorlabs Inc.) and fiber optic cable of the spectrometer (7R170E-190, Standa Ltd.). The size of the objective aperture was controlled using an iris (SM05D5, Thorlabs Inc.) to allow a resolution of 0.5°.
The focal spot of the incident light with a diameter of 500 µm was formed on the 1 mm x 1 mm active area of the sample and the specular reflection was measured while the incident angle varied from 0°, 25° to 60°. The custom-built polycarbonate pressure chamber had a 12.7 mm x 12.7 mm soda-lime glass window for optical measurements and was connected to a programmable syringe pump (NE-1000-US, New Era Pump Systems, Inc.) and a low-pressure gauge with a resolution of 0 .05 mmHg (McMaster-Carr).
Bibliography
The pattern was developed in the MIBK:IPA = 1:1 solution for 60 s, and 2 nm thick Cr and 100 nm thick Au were evaporated.