PERFORMANCE: NON-LINEARITY AND ASYMMETRY
Mahmoud M. Nourayi
ABSTRACT
The relationship between CEO compensation and firm performance is a field of intense theoretical and empirical research. The purpose of this study is to gain additional insights into the nature of this relationship by examining empirically the relatively unexplored areas of its non-linearity.
The findings of this study show strong evidence that supports the view that the relationship between executive compensation and firm performance is non-linear and asymmetric. Additionally, the structure of asymmetry is found to be dependent upon the measure of performance. Convexity characterizes the asymmetry of the relationship between executive com- pensation and market returns, while concavity distinguishes the asymme- try of the relationship between executive compensation and accounting returns.
1. INTRODUCTION
The classic principal–agent problem is the consequence of separation of control from the firm’s ownership associated with authorization of the
Advances in Management Accounting, Volume 15, 103–126 Copyrightr2006 by Elsevier Ltd.
All rights of reproduction in any form reserved ISSN: 1474-7871/doi:10.1016/S1474-7871(06)15005-4
103
managerial choice process. Expected to pursue the owner’s goals, the man- ager enjoys know-how and information advantages, while the owner does not. The owner, as the principal, is thus confronted with the probability that the manager, as the agent, may not pursue the owner’s goals, and designs ex ante mechanisms to solve the problem of efficient contracting in the pres- ence of incomplete information. If incomplete information is about pre- contract agent’s behavior, the principal faces a problem of adverse selection, which can be solved by self-selection mechanisms like signaling or screening.
If, on the other hand, incomplete information is about post-contract agent’s behavior, the principal encounters a moral hazard dilemma, which can be solved by designing specific incentives schemes to foster the agent’s effort (Lambert, 2001;Bebchuk & Fried, 2003).
The relationship between executive incentives and firm performance has been the subject of intensive theoretical and empirical scrutiny by research- ers from a variety of disciplines.1 Despite the vast amount of research a number of issues still remain unresolved. The concern about the existence of asymmetries and non-linearities in the relationship between executive com- pensation and firm performance, in particular, appear to have been left relatively unexplored.
Conceptually, the existence of asymmetries in the relationship between compensation and performance measures does not invalidate the theoretical underpinning of the agency model. As a matter of fact, it is conceivable that symmetry may not be optimal, as no theoretical reason exists to justify the presence of symmetric responses in compensation contracts. On the con- trary, asymmetric responses may be built into compensation contracts as a means to strengthen the incentive structure of compensation contracts.
From this perspective, asymmetry may be consistent with agency theory and optimal contracting arrangements to the extent that encouraging a risk- taking behavior, while shielding the executive from downside risks aligns the incentives of the executive with those of the shareholders. In fact, symmetric responses do not necessarily induce efforts in an agency context.
The purpose of this study is to gain further insights into the nature of the relationship between chief executive officer (CEO) compensation and firm performance by empirically examining this relatively unexplored area of asymmetry, using a panel of 455 U.S. firms spanning a period of seven years, from 1996 to 2002.
The remainder of the study proceeds as follows. Section 2 briefly reviews the literature on the relationship between firm size, firm performance, and executive compensation. Section 3 specifies a non-linear and asymmetric relationship between executive compensation and firm performance. The
data and their sources are described in Section 4, with Section 5 detailing the main empirical results. A brief conclusion and a summary of the empirical results appears in Section 6.
2. OVERVIEW OF THE LITERATURE
Early studies of executive compensation, such asCiscel and Carroll (1980), Healy (1985), andLewellen and Huntsman (1970), focused primarily on the linkages between executive compensation, firm size and profits. The rela- tionship between executive compensation and firm size is one of the most consistent empirical results in the compensation literature, with most studies reporting a compensation elasticity with respect to size of about 0.30 (Rosen, 1992), implying that executive compensation increases by about a third as firm size doubles. Subsequent research has confirmed the positive relation between firm size and executive compensation (Conyon, Peck, &
Sadler, 2000; Carpenter & Sanders, 2002; Cordeiro & Veliyath, 2003;
Indjejikian & Nanda, 2002;Yermack, 1995).
Executive compensation increases with the size of the firm because of the higher level of skills and managerial talent required by the higher degree of complexity and diversity of activities within such organizations. In the more recent past, stimulated in part by theoretical developments in agency theory (Holmstro¨m, 1979), the emphasis has shifted to the investigation of direct linkages between executive compensation and firm performance. Agency theory suggests that CEO incentives can be aligned with the preferences of the shareholders through compensation arrangements that reward the CEO in accordance with firm performance. Although the empirical order of magnitude of the relationship between compensation and performance still remains highly controversial, most of the research conducted in the past two decades has produced a significant amount of evidence in support of the hypothesis that firm performance positively affects executive compensation, for example, Murphy (1985, 1986), Jensen and Murphy (1990), Abowd (1990),Ely (1991),Boschen and Smith (1995), andKaplan (1994).
A related issue concerns the nature of firm performance measures. Re- searchers have examined the relationship between executive compensation and firm performance using accounting-based measures, such as profit, re- turn on equity, and return on assets, as well as market-based performance measures, such as stock price and total shareholder return. At the same time, they have also recognized that each of these measures has drawbacks of its own. From the shareholder’s perspective, return is generated from stock
price changes and is not defined in accounting terms. In theory, market- based measures are ex ante, forward-looking measures of performance, as they reflect managerial decisions that induce future profitability. Conversely, accounting-based measures are ex-post, historical measures of performance, and are thus conceptually less relevant from the shareholder’s perspective.
In practice, however, stock prices are a very noisy signal as they are fre- quently subject to significant market-wide fluctuations that mirror the de- terminants of the business cycle and the conditions of fiscal and monetary policy, and hence do not exclusively reflect executive performance (Bertrand
& Mullainathan, 2000). In contrast, accounting-based measures shield ex- ecutive performance from much of the noise and the accountability associ- ated with stock market fluctuations. Nevertheless, several studies have found evidence that executive compensation responds more to the market-based than the accounting-based performance measures. Coughlan and Schmidt (1985),Rich and Larson (1984),Murphy (1985), and Conyon et al. (2000), among others, find significant empirical evidence that connects executive compensation to market-based returns. Baber, Janakiraman, and Kang (1996), on the other hand, report that such linkages are primarily associated with non-cash compensation. Additionally, Boschen, Duru, Gordon, and Smith (2003)present evidence that indicates that firms give less emphasis to accounting-based measures and increasingly rely on market-based measures.
On the other hand, Lewellen and Huntsman (1970), Sloan (1993), and Carpenter and Sanders (2002), among others, find strong linkages between accounting-based measures of performance and executive compensation.
For the most part, executive compensation research has been confined to cash compensation as a proxy for total compensation, for example,Abowd (1990), Jensen and Murphy (1990), Lambert and Larker (1987), Mishra, Gobeli, and May (2000),Murphy (1985), and Sloan (1993), among others.
Cash compensation comprises salary and bonuses, but does not include other forms of compensation, such as long-term incentives payouts and stock option grants. In earlier studies the use of cash compensation was for the most part justified on the basis of data availability and the relative magnitude of the cash component in total compensation. However, the changes that occurred in the last decade in the composition of compensation contracts, such as the enormous expansion of non-cash compensation, and the significant proliferation in the number of firms offering stock options to their executives and employees, together with the Securities and Exchange Commission (SEC) mandated disclosure regarding stock option grants issued to executives,2have resulted an increased attention to the relevance of non-cash compensation in pay-performance studies, notably Bertrand and
Mullainathan (2000), Core, Guay, and Verrecchia (2003), Cordeiro and Veliyath (2003), andMain, Bruce, and Buck (1996), among others.
Asymmetry of performance effects entails a non-linearity in the relationship between executive compensation and firm performance. As a result, failure to account for such non-linearity may result in model misspecifications and em- pirical analyses, which preclude a full assessment of the effects of performance on executive compensation. Yet, a striking feature of the most empirical work to date is that few systematic attempts have been made to evaluate the pres- ence of asymmetric effects of firm performance measures on executive com- pensation. There is not much empirical evidence to date for the popular view (Crystal, 1991) that good performance is rewarded, while poor performance is ignored, or that compensation contracts are disproportionately more sensitive to positive than negative performance realizations (Joskow & Rose, 1994).
There is some evidence, however, that firms shield executive compensa- tion from current charges against accounting performance that are not necessarily within the CEO’s control (Gaver & Gaver, 1998), and from the contemporaneous effect on accounting performance of restructuring charges (Dechow, Huson, & Sloan, 1994).Gaver and Gaver (1998)use a sample of firms that reported ‘Extraordinary Items’ and/or ‘Discontinued Operations’
to demonstrate that nonrecurring losses on the income statement are not associated with CEO cash compensation, which suggests that compensation committees filter such losses from the determination of compensation. This action serves to reduce the riskiness of the CEO’s compensation, since nonrecurring losses (e.g., those due to the adoption of new accounting standards) are often beyond the control of the CEO.
As noted above, such actions do not undermine the predictions of agency theory.Dechow et al. (1994)argue that since restructuring charges are typi- cally associated with permanent reductions in costs (e.g., layoffs) and/or increased operational synergy, such charges tend to increase firm value and it is in the firm’s best interest to encourage the CEO to take such actions.
Eliminating the restructuring charge, which decreases current accounting measures, from the determination of compensation removes a disincentive for the CEO to take the steps necessary to maximize firm value.
3. MODEL SPECIFICATION AND RELEVANT HYPOTHESES
In this section, I outline a model of executive compensation that postulates a non-linear, asymmetric relationship between performance and executive
compensation, where positive and negative performance realizations of equal magnitude elicit an unequal compensation response.
Specifically, it is assumed that executive compensation is a semi-log-linear function of performance and a log-linear function of size:
lnCOMPit ¼aþb lnzitþdpitþit (i) where COMPit is the executive compensation in firm i at time t, zit rep- resents the firm size andpitdenotes the performance measure. The termitis a stochastic error, which is assumed to be serially uncorrelated with zero mean and constant variance, and independently distributed across firms. In Eq. (i), the parametersbanddrepresent the short-run elasticity of executive compensation with respect to the firm size, zit; and the short-run semi- elasticity with respect to performance, pit;respectively.3
Eq. (i) is derived on the stylized assumption that the relationship between (the logarithm of) executive compensation and firm performance is linear.
The effects of performance on executive compensation are assumed sym- metric, i.e., whether pit40 or pito0;they are equal in magnitude and op- posite in sign. On the other hand, asymmetry in performance effects requires that whenpit40 orpito0;the effects on executive compensation are not just opposite in sign, but also different in magnitude. Eq. (ii) removes the sym- metry assumption, and models the asymmetric effects in the compensation equation using, as an approximation, specification of the performance measure with threshold at pit¼0:
lnCOMPit¼aþb lnzitþd1posðpitÞ þd2negðpitÞ þit (ii) where posðpitÞand negðpitÞ denote the positive and negative values of per- formance measure,pit:
Eq. (ii) implies that the effect of performance on executive compensation depends upon whether pit is positive or negative. Whenpit40 is true, the short-run effect of performance on executive compensation is captured by the point estimate ofd1:Conversely, whenpito0 is true the short-run effect isd2:This asymmetric pattern of performance effects indicates that an im- provement or a worsening of a positive performance is not necessarily equivalent to an improvement or a worsening of a negative performance.
Thus, for example, the effect on executive compensation of an increase of 10 percentage points in pit;whenpit is positive (say, from 20 to 30) is not the same as that of an increase of 10 percentage points inpitwhenpitis negative (say, from 30 to 20).
Eq. (ii) incorporates the relevant empirical hypotheses underlying this study, which can be summarized as follows. First, the effects of firm performance
measures on executive compensation are asymmetric. This hypothesis is re- jected if the coefficient on the positive and negative values of the performance variable,d1 andd2;in Eq. (ii) are not significantly different from each other, i.e., d1 d2¼0: Second, alternative performance measures display different patterns of asymmetry. This hypothesis is rejected if, given two alternative measures of performance, say, p1it andp2it; the differences d11it d12it and d21it d22itare jointly not significantly different from zero, whered11itandd21it
are the coefficient estimates of posðp1itÞ andposðp2itÞ; d12it and d22it are the coefficient estimates of negðp1itÞ and negðp2itÞ; respectively. Noticeably, the rejection of the asymmetry hypotheses provides evidence that supports the conventional representation of the executive compensation model.
4. SAMPLE SELECTION, VARIABLE
MEASUREMENTS, AND DESCRIPTIVE STATISTICS
This section describes the sample, data sources and variable measurement.
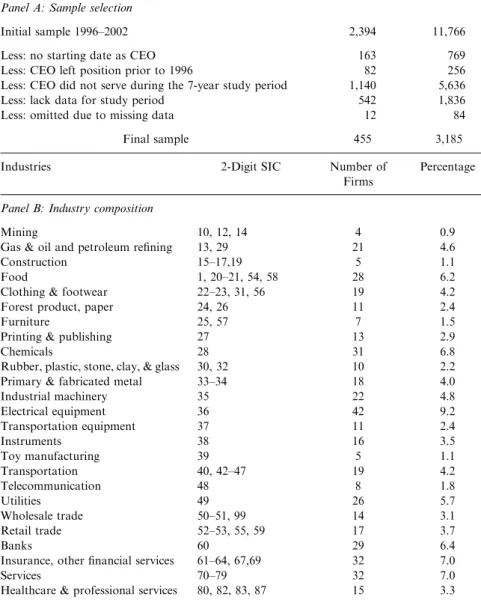
All data for this study are drawn from Standard and Poor’s (2004) Ex- ecuCompdatabase. The sample consists of panel data from 455 U.S. firms covering the period 1996–2002. This sample is obtained from an initial sample of 2,394 U.S. firms after imposing the condition that CEO tenure extend over the entire period 1996 to 2002, with full years of tenure during 1997–2002, and at least 6 months tenure in 1996. This condition is imposed to guarantee homogeneity in the pay-performance relationship and to con- trol to some degree for human capital heterogeneity within firms. Panel A of Table 1presents the sample selection process.
Detailed information about industry composition of the sample is pre- sented in Panel B of Table 1. The sample encompasses 25 industries, with 2-digit SIC ranging from 01 to 99. The largest sample representation is the electrical equipment industry, with 42 firms or about 9.2 percent of the sample, followed by insurance and other financial services, and services, each with 32 firms or about 7 percent of the sample, and the chemical industry with 31 firms or about 6.8 percent of the sample. The industries with the smallest sample representation are mining with 4 firms, about 0.9 percent, and toy manufacturing and construction, each with 5 firms, accounting for approximately 1.1 percent of the sample.
This sample has at least two advantages over other samples. First, it is random and utilizes the most recent available information. Not only does it include newer firms, but also large firms are not overly represented4as in the studies that use common data sources such asForbesorFortune. The sample
Table 1. Sample Selection & Industry Composition.
Number of Firms
CEO-Year
Panel A: Sample selection
Initial sample 1996–2002 2,394 11,766
Less: no starting date as CEO 163 769
Less: CEO left position prior to 1996 82 256
Less: CEO did not serve during the 7-year study period 1,140 5,636
Less: lack data for study period 542 1,836
Less: omitted due to missing data 12 84
Final sample 455 3,185
Industries 2-Digit SIC Number of
Firms
Percentage
Panel B: Industry composition
Mining 10, 12, 14 4 0.9
Gas & oil and petroleum refining 13, 29 21 4.6
Construction 15–17,19 5 1.1
Food 1, 20–21, 54, 58 28 6.2
Clothing & footwear 22–23, 31, 56 19 4.2
Forest product, paper 24, 26 11 2.4
Furniture 25, 57 7 1.5
Printing & publishing 27 13 2.9
Chemicals 28 31 6.8
Rubber, plastic, stone, clay, & glass 30, 32 10 2.2
Primary & fabricated metal 33–34 18 4.0
Industrial machinery 35 22 4.8
Electrical equipment 36 42 9.2
Transportation equipment 37 11 2.4
Instruments 38 16 3.5
Toy manufacturing 39 5 1.1
Transportation 40, 42–47 19 4.2
Telecommunication 48 8 1.8
Utilities 49 26 5.7
Wholesale trade 50–51, 99 14 3.1
Retail trade 52–53, 55, 59 17 3.7
Banks 60 29 6.4
Insurance, other financial services 61–64, 67,69 32 7.0
Services 70–79 32 7.0
Healthcare & professional services 80, 82, 83, 87 15 3.3
contains data from a wide variety of firms: those in the Standard and Poor’s 500, Standard and Poor’s Mid-Cap 400, and Standard and Poor’s Small- Cap 600, which provide considerable variation in firm size.5The sample is taken over a period of time and follows SEC regulations on disclosure requirements, as well as the FASB debate on accounting for stock options, which ultimately produced SFAS 123 ‘‘Accounting for Stock-based Com- pensation.’’ Thus, the sample corresponds to a period during which firms made compensation decisions in accord with current disclosure require- ments, and this adds to the generalizability of the findings.
Two measures of executive compensation are used in this study: cash compensation and total (cash and non-cash) compensation. Cash compen- sation (CASHCOMP) is defined as the sum of salary and bonus. Total compensation (TOTALCOMP), includes both cash and non-cash compen- sation. Non-cash compensation is composed of long-term incentive payouts, the value of restricted stock grants, the value of stock option grants, and any other compensation item for the year. Stock options are valued at the grant- date usingExecuComp’s modifiedBlack and Scholes (1973)methodology.6 Firm performance is modeled using both accounting-based and market- based measures. Market-based performance is measured as total one-year shareholder return on common stock (TRS), defined as the closing price at fiscal year-end plus dividends divided by the closing price of the prior fiscal year-end. Accounting-based performance is measured by return on assets (ROA), defined as income before tax, extraordinary items, and discontinued operations divided by average total assets. Finally, firm size is proxied by net annual sales (SALES).
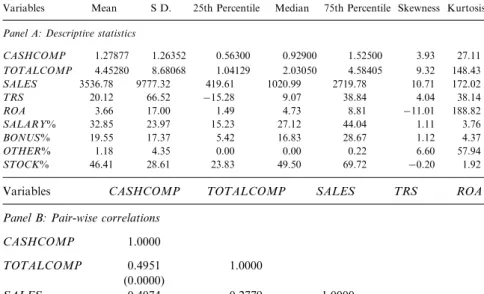
Table 2(Panel A) presents descriptive statistics of the relevant variables in the sample panels. The average cash compensation and total compensation over the seven-year period are $1.2788 and $4.453 million, respectively, and are much higher than the corresponding median values of $0.929 and $2.031 million. The mean of accounting returns is 3.66%, while the mean of stock market returns is 20.12%, and the average amount of sales is $3.537 billion.
Consistent with prior literature, accounting returns have lower volatility, as measured by the overall standard deviation, than stock market returns. This is generally consistent with the smoothing effects of accruals.
The pair-wise correlation matrix of the variables is reported in Panel B of Table 2. The highest correlation, as expected, is betweenCASHCOMPand TOTALCOMP (0.50). The correlation betweenSALESandCASHCOMP (0.41) is also strong and significant, as is that between SALES and TO- TALCOMP (0.28). Both measures of performance, TRS and ROA, also have a small significant positive univariate association with both measures
Table 2. Descriptive Statistics, and Correlations.
Variables Mean S D. 25th Percentile Median 75th Percentile Skewness Kurtosis
Panel A: Descriptive statistics
CASHCOMP 1.27877 1.26352 0.56300 0.92900 1.52500 3.93 27.11
TOTALCOMP 4.45280 8.68068 1.04129 2.03050 4.58405 9.32 148.43
SALES 3536.78 9777.32 419.61 1020.99 2719.78 10.71 172.02
TRS 20.12 66.52 15.28 9.07 38.84 4.04 38.14
ROA 3.66 17.00 1.49 4.73 8.81 11.01 188.82
SALARY% 32.85 23.97 15.23 27.12 44.04 1.11 3.76
BONUS% 19.55 17.37 5.42 16.83 28.67 1.12 4.37
OTHER% 1.18 4.35 0.00 0.00 0.22 6.60 57.94
STOCK% 46.41 28.61 23.83 49.50 69.72 0.20 1.92
Variables CASHCOMP TOTALCOMP SALES TRS ROA
Panel B: Pair-wise correlations CASHCOMP 1.0000
TOTALCOMP 0.4951 1.0000
(0.0000)
SALES 0.4074 0.2779 1.0000
(0.0000) (0.0000)
TRS 0.0322 0.0796 0.0403 1.0000
(0.0695) (0.0000) (0.0230)
ROA 0.0841 0.0514 0.0334 0.1161 1.0000
(0.0000) (0.0037) (0.0595) (0.0000)
Note: All data are from Standard and Poor’sExecuComp database.CASHCOMP is cash compensation, in millions of dollars, defined as the sum of salary and bonus.TOTALCOMPis cash and non-cash compensation, in millions of dollars. Non-cash compensation includes composed of long-term incentive payouts, the value of restricted stock grants, the value of stock option grants and any other compensation item for the year.TOTALCOMPpay includes stock grants (valued at the grant-date market price) and stock options (valued usingExecuComp’s modified Black–Scholes formula–ExecuCompvalues options using an ‘‘expected life’’ equal to 70% of the actual term. In addition,ExecuCompsets volatilities below the 5th percentile or above the 95th percentile to the 5th and 95th percentile volatilities, respectively; similarly, dividend yields above the 95th percentile are reduced to the 95th percentile.)SALESis net annual sales, in millions of dollars. ROAis return on assets, defined as income before tax, extraordinary items and discontinued operations divided by average total assets.TRSis total one-year shareholder return on common stock, defined as the closing price at fiscal year-end plus dividends divided by the closing price of the prior fiscal year-end. ROAand TRSare deciles.SALARY%,BONUS%,OTHER% andSTOCK% are the salary, bonus, other, and stock-based compensations as a percentage of total compensation. In a normal distribution, skewness is zero, and excess kurtosis is 3. Correlation coefficients’p-values are in parenthesis beneath the estimated correlation coefficients.
of compensation, CASHCOMP andTOTALCOMP. The pair-wise corre- lations between SALES, ROA, and TRS are below 0.10, which does not raise multicollinearity concerns. Consistent with previous studies, there is also a positive and significant correlation between stock market returns, TRS, and accounting returns, ROA, as well as an inconclusive association betweenSALESand both measures of performance.
5. EMPIRICAL RESULTS
This section summarizes the main empirical results of the study. I examined the pay-performance relationship using four alternative models. Two mod- els employ the stock market measure of performance (TRS) and the other model use the accounting measure (ROA). I also included firm net sales as the proxy for size in all models.
As a starting point, and for comparison purposes, I performed a fixed- effects estimation of cross-section time-series regressions based onsymmet- ric specifications of the relationship. Time-specific effects, in the form of yearly dummy variables are included in all the estimated models.
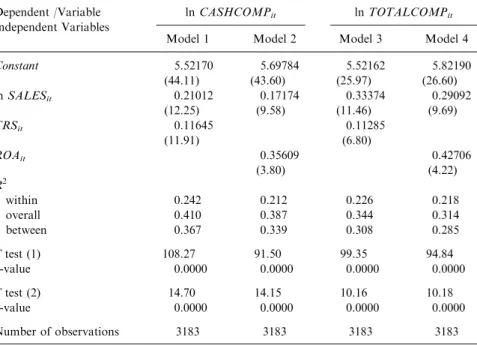
The estimates were obtained using the Within-Group (WG) estimator with cash compensation (CASHCOMP) or total compensation (TOTAL- COMP) as the dependent variable as shown below in models 1–4:7
lnðCASHCOMPitÞ ¼aþb lnðSALESitÞ þdTRSitþgDUMYEARtþit (1) lnðCASHCOMPitÞ ¼aþb lnðSALESitÞ þdROAitþgDUMYEARtþit
(2) lnðTOTALCOMPitÞ ¼aþb lnðSALESitÞ þdTRSitþgDUMYEARtþit
(3) lnðTOTALCOMPitÞ ¼aþb lnðSALESitÞ þdROAitþgDUMYEARtþit
(4) The results in Table 3 suggest that the statistical performance of the symmetric model is quite satisfactory. The WG estimator yields significant estimated coefficients with correct signs in all cases. The results with respect to size indicate that the relationship between executive compensation (both cash and total) and size is positive and significant, regardless of the measure of performance used.
Table 3reports twoFtests. The first concerns the null hypothesis that all coefficients except the constant are zero; the second refers to the null hy- pothesis that the fixed effects are not significantly different from zero. In both cases, and for all the four estimated models, the null hypothesis is soundly rejected. The elasticity of cash compensation with respect to size is approximately 0.21 in Model 1, 0.17 in Model 2, and about 0.29 or higher in the case of total compensation. These estimates are generally in accord with the findings of previous studies. Similarly, the results with respect to per- formance indicate that the relationship between executive compensation
Table 3. Within-Group Estimates of the Symmetric Model.
ln(CASHCOMPit)¼a+bln(SALESit)+dTRSit+gDUMYEARt+eit(1) ln(CASHCOMPit)¼a+bln(SALESit)+dROAit+gDUMYEARt+eit(2) ln(TOTALCOMPit)¼a+bln(SALESit)+dTRSit+gDUMYEARt+eit(3) ln(TOTALCOMPit)¼a+b ln(SALESit)+dROAit+gDUMYEARt+eit(4) Dependent /Variable
Independent Variables
lnCASHCOMPit lnTOTALCOMPit
Model 1 Model 2 Model 3 Model 4
Constant 5.52170 5.69784 5.52162 5.82190
(44.11) (43.60) (25.97) (26.60)
lnSALESit 0.21012 0.17174 0.33374 0.29092
(12.25) (9.58) (11.46) (9.69)
TRSit 0.11645 0.11285
(11.91) (6.80)
ROAit 0.35609 0.42706
(3.80) (4.22)
R2
within 0.242 0.212 0.226 0.218
overall 0.410 0.387 0.344 0.314
between 0.367 0.339 0.308 0.285
Ftest (1) 108.27 91.50 99.35 94.84
p-value 0.0000 0.0000 0.0000 0.0000
Ftest (2) 14.70 14.15 10.16 10.18
p-value 0.0000 0.0000 0.0000 0.0000
Number of observations 3183 3183 3183 3183
Note: Variables are defined as in Table 2, except that the values ofROA andTRSare in decimals and not percentages. Year effects (in the form of yearly dummy variables) and a constant are included in all regressions.t-statistics are in parenthesis beneath the estimated coefficients.Ftest (1) is a test of the null hypothesis that all explanatory variables including the year effects (except the constant) are jointly not significantly different from zero.Ftest (2) is a test of the null hypothesis that the fixed effects are jointly not significantly different from zero.
(both cash and total) and performance is also positive and statistically strong. The estimated coefficients of TRS and ROA are significantly dif- ferent from zero at any conventional level. The coefficient estimate ofROA, however, is more than three times the magnitude of the coefficient estimate ofTRS. This outcome suggests that in the determination of executive com- pensation a greater weight is placed on accounting returns than market performance. This result is not uncommon to the literature, and is consistent with risk-sharing concerns, since stock returns are more volatile in the short- run than return on assets. Stock returns vary owing to factors outside the control of the CEO, and hence their use in the compensation contract in- creases the risk imposed on the executive.Lambert and Larker (1987)dem- onstrate that firms with less volatile stock returns place greater weight on stock returns when determining compensation.
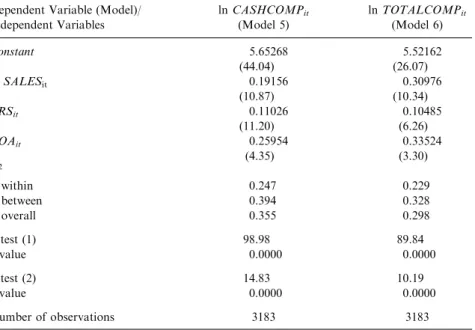
To avoid potential biases inherent in using either measure alone, I in- cluded both measures as explanatory variable. Models 5 and 6 represent such formulation:
lnðCASHCOMPitÞ ¼aþb lnðSALESitÞ þd1TRSitþd2ROAit
þgDUMYEARtþit ð5Þ
lnðTOTALCOMPitÞ ¼aþb lnðSALESitÞ þd1TRSitþd2ROAit
þgDUMYEARtþit ð6Þ
The estimation results of Models 5 and 6 are reported in Table 4. The estimated coefficients of TRS and ROA are, again, significantly different from zero at any conventional level, regardless of the fact that the per- formance measures enter the compensation equation together. As in the earlier results, the coefficient estimate ofROAis much larger in magnitude than the coefficient estimate ofTRS.
Overall, then, the estimation results in Tables 3 and 4 suggest that the symmetric version of the model performs relatively well. What is arguable, however, is whether the estimated coefficients are significant and relevant from the economic viewpoint. In particular, based on the estimates of Models 5 and 6, a one percentage point change inTRSresults in a change of
$6,985 and $16,177, respectively, while a similar change in ROAshifts the cash and total compensation of the median CEO by $16,583 and $52,407, respectively. Sloan (1993)provides evidence consistent with the prediction that firms whose stock prices respond more strongly to non-firm-specific factors place greater weight on accounting earnings in order to shield ex- ecutives from undue compensation risk.
The validity of these results relies critically on the maintained hypotheses of symmetry and no adjustment costs. In order to test the symmetry hy- pothesis, I revised estimation models to include a variable equal to pit; representingpositivemeasure of performance, if 1 and zero otherwise. Sim- ilarly, I included another variable to represent negative measure of per- formance when pito 0. Models (1a)–(4a) represent the changes in specification discussed earlier.
lnðCASHCOMPitÞ ¼aþblnðSALESitÞ þd1POSTRSitþd2NEGTRSit
þgDUMYEARtþit ð1aÞ
Table 4. Within-Group Estimates of the Symmetric Model.
ln(CASHCOMPit)¼a+bln(SALESit)+d1TRSit+d2ROAit+gDUMYEARt+eit(5) ln(TOTALCOMPit)¼a+bln(SALESit)+d1TRSit+d2ROAit+gDUMYEARt+eit(6) Dependent Variable (Model)/
Independent Variables
lnCASHCOMPit
(Model 5)
lnTOTALCOMPit
(Model 6)
Constant 5.65268 5.52162
(44.04) (26.07)
lnSALESit 0.19156 0.30976
(10.87) (10.34)
TRSit 0.11026 0.10485
(11.20) (6.26)
ROAit 0.25954 0.33524
(4.35) (3.30)
R2
within 0.247 0.229
between 0.394 0.328
overall 0.355 0.298
Ftest (1) 98.98 89.84
p-value 0.0000 0.0000
Ftest (2) 14.83 10.19
p-value 0.0000 0.0000
Number of observations 3183 3183
Note: Variables are defined as in Table 2, except that the values ofROA andTRSare in decimals and not percentages. Year effects (in the form of yearly dummy variables) and a constant are included in all regressions.t-statistics are in parentheses beneath the estimated coefficients.Ftest (1) is a test of the null hypothesis that all explanatory variables including the year effects (except the constant) are jointly not significantly different from zero.Ftest (2) is a test of the null hypothesis that the fixed effects are jointly not significantly different from zero.
lnðCASHCOMPitÞ ¼aþblnðSALESitÞ þd1POSROAitþd2NEGROAit
þgDUMYEARtþit ð2aÞ
lnðTOTALCOMPitÞ ¼aþblnðSALESitÞ þd1POSTRSitþd2NEGTRSit
þgDUMYEARtþit ð3aÞ
lnðTOTALCOMPitÞ ¼aþblnðSALESitÞ þd1POSROAitþd2NEGROAit
þgDUMYEARtþit ð4aÞ
Both measures of performance are included in Models 5 and 6 while testing the null hypothesis of symmetry. Models (5a) and (6a) are presented below:
lnðCASHCOMPitÞ ¼aþblnðSALESitÞ þd11POSTRSitþd12NEGTRSit þd21POSTRSitþd22NEGTRSit
þgDUMYEARtþit ð5aÞ
lnðTOTALCOMPitÞ ¼aþblnðSALESitÞ þd11POSTRSitþd12NEGTRSit
þd21POSTRSitþd22NEGTRSit
þgDUMYEARtþit ð6aÞ
The results of WG estimates are presented inTable 5. The findings indicate the estimation results of the asymmetric specifications are highly at variance with those presented inTables 3 and 4.
As in earlier results, theFtests reported inTable 5soundly reject the null hypotheses that all coefficients except the constant are zero and that the fixed effects are not significantly different from zero. Further, the threeR2are also not too different from those reported inTables 3 and 4, with the exception of theR2within, which are significantly higher in all the estimated models. This is particularly evident in Models (1a), (2a) and (5a). Since the WG estimator maximizes the R2 within, this finding alone is an indication of the greater explanatory power of the asymmetric specification. The findings with respect to size are reasonably close, and in some cases almost identical, to those obtained under the symmetry assumption. The results with respect to performance, on the other hand, indicate that there is strong evidence of asymmetric effects.
The sample was modified to exclude new CEOs, i.e., those hired in 1996.
The results were basically the same as those reported in Table 5. Further- more, employing dummy variables for regulated firms and firms’ capital- ization level did not have any impact on the results reported inTable 5.
Consistent with the findings of a higher R2within, the estimated coeffi- cients ofPOSTRS,NEGTRS, andPOSROAare significantly different from
Table 5. Within-Group Estimates of the Asymmetric Model.
ln(CASHCOMPit)¼a+bln(SALESit)+d1POSTRSit+d2NEGTRSit+gDUMYEARt+eit(1a) ln(CASHCOMPit)¼a+bln(SALESit)+d1POSROAit+d2NEGROAit+gDUMYEARt+eit(2a) ln(TOTALCOMPit)¼a+bln(SALESit)+d1POSTRSit+d2NEGTRSit+gDUMYEARt+eit(3a) ln(TOTALCOMPit)¼a+bln(SALESit)+d1POSROAit+d2NEGROAit+gDUMYEARt+eit(4a)
ln(CASHCOMPit)¼a+bln(SALESit)+d11POSTRSit+d12NEGTRSit+d21POSROAit+d22NEGROAit+gDUMYEARt+eit(5a) ln(TOTALCOMPit)¼a+bln(SALESit)+d11POSTRSit+d12NEGTRSit+d21POSROAit+d22NEGROAit+gDUMYEARt+eit(6a)
Dependent Variable/Independent Variables: lnCASHCOMPit lnTOTALCOMPit
Model 1a Model 2a Model 5a Model 3a Model 4a Model 6a
Constant 5.54783 5.59146 5.5482 5.53535 5.74301 5.62000
(45.21) (44.72) (45.72) (26.07) (26.42) (25.91)
lnSALESit 0.21810 0.16759 0.19822 0.33793 0.28785 0.31090
(12.96) (9.78) (11.87) (11.61) (9.67) (10.42)
POSTRSit 0.04510 — 0.03014 0.07293 — 0.06453
(3.39) (2.62) (3.53) (3.14)
NEGTRSit 0.52871 — 0.45943 0.32952 — 0.25706
(13.22) (11.71) (4.76) (3.67)
POSROAit — 3.03790 2.59985 — 2.4140 2.07580
(17.27) (15.03) (7.89) (6.72)
NEGROAit — 0.06829 0.19482 — 0.11264 0.02658
( 1.08) ( 3.14) (1.02) (0.24)
MAHMOUDM.NOURAYI
within 0.272 0.281 0.329 0.229 0.232 0.242
between 0.412 0.303 0.345 0.336 0.307 0.318
overall 0.377 0.294 0.341 0.304 0.283 0.295
Ftest (1) 112.72 118.02 120.95 89.77 91.00 78.77
p-value 0.0000 0.0000 0.0000 0.0000 0.0000 0.0000
Ftest (2) 15.23 15.90 16.86 10.20 10.44 10.42
p-value 0.0000 0.0000 0.0000 0.0000 0.0000 0.0000
Number of observations 3183 3183 3183 3183 3183 3183
Note: POSTRSis the same asTRS when TRS40 and zero otherwise andPOSROAis the same asROA when ROA40 and zero otherwise.
Likewise,NEGTRS is the same asTRS when TRSo0 and zero otherwise andNEGROAis the same asROA when ROAo0 and zero otherwise. All other variables are defined as inTable 2, except that the values of are in decimals and not percentages. Year effects (in the form of yearly dummy variables) and a constant are included in all regressions.t-statistics are in parenthesis beneath the estimated coefficients.F test (1) is a test of the null hypothesis that all explanatory variables including the year effects (except the constant) are jointly not significantly different from zero.Ftest (2) is a test of the null hypothesis that the fixed effects are jointly not significantly different from zero.
CompensationandFirmPerformance119
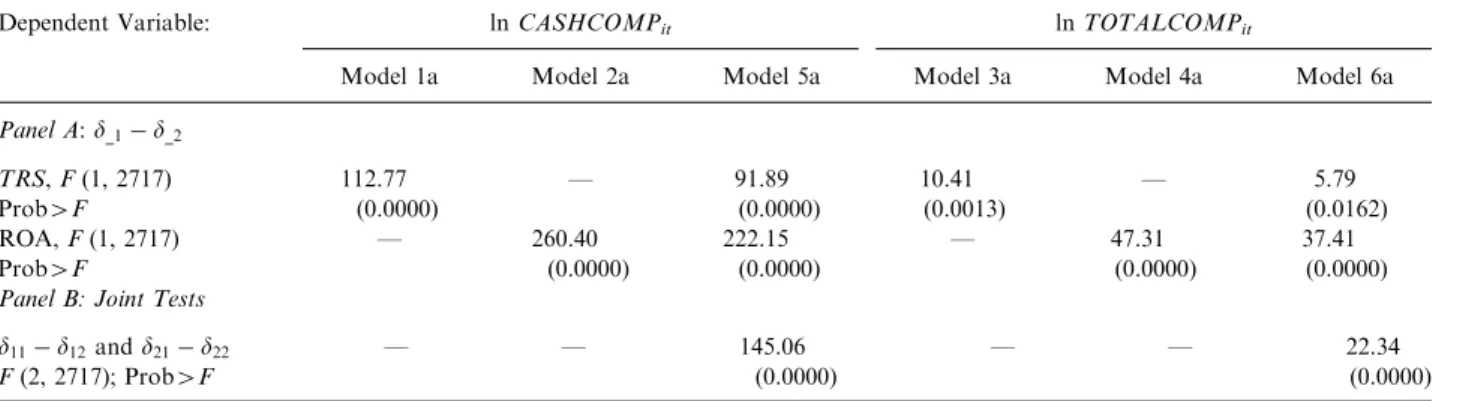
zero at any conventional level and in all six estimated models. This provides substantial evidence that the effect of positive performance realization is significantly different from that of negative performance. Further, the Wald test of parameters, reported in Table 6, indicate strong non-linearity con- dition and the asymmetric influence of positive and negative performance measures. That is, a negativeTRSis heavily penalized and a positiveTRSis only mildly rewarded. In contrast, a positiveROAis heavily rewarded and a negative ROA does not appear to have any significant influence on CEO compensation. A formal test of the hypothesis thatTRSandROAshare the same pattern of asymmetry is soundly rejected by the joint test of parameters as presented inTable 6. For Model (5a) (cash compensation model) the test statistic, with 2 and 2,717 degrees of freedom, yields anF value of 145.06, (po0.0000), while for Model (6a) (total compensation model) the value of theFstatistics, with 2 and 2,717 degrees of freedom, is 16.27 (po0.0000).
This asymmetric structure is evident in both cash and total compensation regressions. Additionally, my results indicate that both performance meas- ures have effects on executive compensation levels that are economically significant. In particular, based on the estimates of Models (5a) and (6a), for the median CEO the effect of a one percentage point change in positiveTRS realizations on cash and total compensation is $1,875 and $9,902, respec- tively, while the effect of a similar change in negativeTRS results in cash and total compensation declines of $28,755 and $39,464, respectively. Con- versely, a one percentage point change in positive ROArealizations trans- lates in a median change of cash and total compensation equal to $180,584 and $347,654, respectively, whereas a change in negative ROArealizations does not have any significant effects on either measure of compensation.
In short, by accounting for asymmetry, the economic significance of the relationship between executive compensation and performance is much greater than what is suggested by the analysis that ignores asymmetry.
While theory is largely silent on the size of the incentives that would be optimal from the standpoint of the shareholders, these results indicate that American CEOs in the late 1990s and early 2000s had much more to gain from improving accounting returns than from improving market returns.
Alternatively, this evidence suggests that risk preferences may not be in- variant to incentives. Executive compensation contracts may be constructed to encourage risk-taking behavior in accounting performance, as executive compensation is relatively shielded from negativeROArealizations, while at the same time compensation contracts may strengthen risk-averting be- havior in market performance, as executive compensation is not insulated from negativeTRSrealizations. This incentive structure may also motivate
Table 6. Estimates of Asymmetric Performance Effects Wald Test.
ln(CASHCOMPit)¼a+bln(SALESit)+d1POSTRSit+d2NEGTRSit+gDUMYEARt+eit(1a) ln(CASHCOMPit)¼a+bln(SALESit)+d1POSROAit+d2NEGROAit+gDUMYEARt+eit(2a) ln(TOTALCOMPit)¼a+bln(SALESit)+d1POSTRSit+d2NEGTRSit+gDUMYEARt+eit(3a) ln(TOTALCOMPit)¼a+bln(SALESit)+d1POSROAit+d2NEGROAit+gDUMYEARt+eit(4a)
ln(CASHCOMPit)¼a+bln(SALESit)+d11POSTRSit+d12NEGTRSit+d21POSROAit+d22NEGROAit+gDUMYEARt+eit(5a) ln(TOTALCOMPit)¼a+bln(SALESit)+d11POSTRSit+d12NEGTRSit+d21POSROAit+d22NEGROAit+gDUMYEARt+eit(6a)
Dependent Variable: lnCASHCOMPit lnTOTALCOMPit
Model 1a Model 2a Model 5a Model 3a Model 4a Model 6a
Panel A:d_1 d_2
TRS,F(1, 2717) 112.77 — 91.89 10.41 — 5.79
Prob4F (0.0000) (0.0000) (0.0013) (0.0162)
ROA,F(1, 2717) — 260.40 222.15 — 47.31 37.41
Prob4F (0.0000) (0.0000) (0.0000) (0.0000)
Panel B: Joint Tests
d11 d12andd21 d22 — — 145.06 — — 22.34
F(2, 2717); Prob4F (0.0000) (0.0000)
Note:Variables are defined as inTable 2.
CompensationandFirmPerformance121
unintended and unanticipated effects. For instance, it may result in too much risk-taking or it may shorten the time horizon used to make decisions.
Among other things, however, this asymmetric structure of incentives ap- pears to be consistent with and may help explain the increased number of mergers and acquisitions that occurred in the late 1990s.
A comparison between these estimates and those presented earlier clearly indicates that imposing the assumption of symmetry results in substantial specification bias. Interestingly, the bias appears to operate in opposite di- rections. The estimates inTables 3 and 4underestimate the impact of a pos- itiveROAand overestimate the impact of a negativeROA. Conversely, they overestimate the impact of a positiveTRSrealization and underestimate the impact of a negativeTRSrealization. It is thus quite evident that the structure of asymmetry present in TRS does not mirror the structure of asymmetry present inROA, as asymmetry is concave in ROAand convex inTRS.
In summary, evidence provided by estimates of the asymmetric version of the executive compensation model lends strong support in favor of the main hypotheses: (a) performance has non-linear asymmetric effects on executive compensation; and (b) alternate measures of performance display different patterns of asymmetry and non-linearity. Further, it suggests that modeling executive compensation as a symmetric performance process leads to a sta- tistically mis-specified model and fails to resolve the compensation anom- alies first noticed by Jensen and Murphy (1990).
6. SUMMARY AND CONCLUDING REMARKS
In this study, an empirical model to assess the importance of asymmetries in executive compensation contracts was presented. This issue is for the most part an unexplored area of agency theory. However, the empirical results of this study provide a great deal of evidence suggesting that ignoring them leads to serious misspecifications. It was also shown that these issues are important because they offer an answer as to why in the current literature the estimates of the effects of performance on executive compensation ap- pear to be too small to have any economic significance.
Consistent with previous studies, the response of executive compensation to accounting returns is much stronger than the response to shareholder returns. While theory offers little guidance to the size of the incentives that would be optimal from the standpoint of the shareholders, the strength of the relationship indicates that in the late 1990s and early 2000s American CEOs had much more to gain from improving accounting returns than from
improving market returns. Second, strong evidence of asymmetry and non- linearity in the relationship between executive compensation and firm per- formance is observed.Jensen and Murphy (1990) argue that the effects of performance on executive compensation are too low to be consistent with formal agency theory. The asymmetric specification of the executive com- pensation model offers a resolution about such concerns, as the results indicate that the performance measures have effects on executive compen- sation levels that are not only statistically significant but also economically meaningful. Thus, ignoring such asymmetries can lead to results that sub- stantially understate the economic significance of the relationship between executive compensation and performance. Third, the results indicate that the structure of asymmetry is not invariant to the measures of performance.
In fact, convexity appears to dominate the asymmetry of the relationship between executive compensation and market returns, while concavity is the main feature that characterizes the asymmetry of the relationship between executive compensation and accounting returns. Negative market returns are heavily penalized while positive market returns are only mildly re- warded. Conversely, positive accounting returns are heavily rewarded, while negative accounting returns are not penalized at all.
An apparently dualistic view of firm performance emerges from the results of this study. Performance is viewed as good, and rewarded as such, when positive realizations in accounting returns are obtained, whereas performance is deemed poor, and penalized as such, when negative realizations in stock market returns occur. Consequently, when performance is judged in terms of accounting returns, good performance is rewarded more than poor perform- ance is penalized. Conversely, when performance is judged in terms of market returns, poor performance is penalized more than good performance is re- warded. This evidence, in turn, seems to suggest that risk preferences may not be invariant to incentives. Executive compensation contracts may be con- structed to encourage a risk-taking behavior in accounting-based performance, as executive compensation is relatively shielded from negative accounting re- turns realizations, and, at the same time, to strengthen a risk-averting behavior in market-based performance, as executive compensation is not insulated from negative stock market realizations. This conjecture is consistent with agency theory, as executives are more likely to understand the drivers of accounting- based returns than to recognize the factors that can explain stock prices.
Inferences from this empirical study may be bounded by the temporal context in which it is embedded. The late 1990s have been a singular time in America’s corporate history. The panel nature of the data makes the findings more robust; however, the economic outlook of the late 1990s may
be fundamentally different from the one-facing firms now or in the future.
Consequently, future research will be needed to determine to the extent to which these results can be generalized in periods of different economic prospects. On the whole, however, the findings in this study help provide a better understanding of the nature of the relationship between firm per- formance and executive compensation, and indicate that the relationship between executive compensation and performance is far more complex and multifaceted than the vast majority of previous studies have described.
NOTES
1. For a review of the theoretical and empirical research on the subject, seeMu- rphy (1999)andRosen (1992).
2. Beginning with fiscal year 1993, companies have been required by the SEC to annually report individual salary, bonus, other annual compensation, restricted stock grants, long-term incentives payouts, stock option grants, and all other com- pensation for the top five paid executives.
3. Elasticity compares the percentage change of one variablexwith the percentage change of the other variable y(dln(y)/dln(x)). Semi-elasticity, on the other hand, compares the level change in one variablexwith the percentage change of the second variable (dln(y)/dx).
4. The sample has a mean market capitalization of $5.53 billions, and a median of
$1.25 billions. 48 firms have a market capitalization above $10 billion, 66 firms with capitalization of $4–$10 billion, 152 firms with capitalization of $1–$4 billion, and 189 firms have a market capitalization below $1 billion.
5. The sample consists of 149 S & P 500 firms, 118 Mid-Cap, and 133 Small-Cap firms. Fifty-five firms did not have S & P classification.
6. ExecuComp’s modified Black–Scholes formula– ExecCompvalues options us- ing an ‘‘expected life’’ equal to 70% of the actual term. In addition,ExecCompsets volatilities below the 5th percentile or above the 95th percentile to the 5th and 95th percentile volatilities, respectively; similarly, dividend yields above the 95th percen- tile are reduced to the 95th percentile.
7. Each model was also estimated using ordinary least-squares (OLS) and random effects (RE) estimators. These estimates, however, are not reported because (a) the Lagrangian multiplier test (Greene, 2003) rejects the OLS model, and (b) the Hausman test (Baltagi, 2001) rejects the random effects model at any conventional level.
ACKNOWLEDGMENT
I would like to acknowledge the administrative support by Cissy Easter and Kathe Segall.