NUTRITIONAL KNOWLEDGE AND BEHAVIORS OF UNDERGRADUATE STUDENTS
By
Victoria Inghram
A thesis submitted to the faculty of the University of Mississippi in partial fulfillment of the requirements of the Sally McDonnell Barksdale Honors College.
Oxford May 2019
Approved by
Advisor: Professor Melinda Valliant
Reader: Professor Teresa Carithers
© 2019
Victoria Elizabeth Inghram ALL RIGHTS RESERVED
DEDICATIONS
This study is wholeheartedly dedicated to my exceptionally supportive family, friends, and to the love of my life, Andrew Brown. Without all of your countless prayers,
phone calls, and love, I would not at all be the person that I am without all of you.
I cannot thank you enough for all that you mean to me.
Lastly, but most certainly not least, I would like to thank God for putting the right people in my life to help me along the way and for providing me with the wisdom and
strength to persevere through this incredible academic journey.
In memory and in honor of:
My beloved great grandfather, James F. Albsmeyer.
ACKNOWLEDGEMENTS
Firstly, I would like to sincerely thank my incredible thesis advisor, Dr. Melinda Valliant for all of her continuous support throughout my thesis. Her guidance, patience, motivation, and exceptional knowledge in nutrition and research have truly been an asset
to not only this study, but also to my education.
I would also like to thank my amazing professors in the Department of Nutrition and Hospitality Management for providing me with the knowledge and background to
conduct with this study.
Next, I would like to thank Ms. Emmy Parkes and Mr. Clinton Copp for graciously allowing me to take up their class time so that I could survey their students for this study.
I would also like to thank Dr. Kathy Knight and Dr. Teresa Carithers for taking the time to read and revise my thesis.
Lastly, I would like to the thank the Sally McDonnell Barksdale Honors College for giving me this incredible challenge and opportunity to excel in my academics.
Thank you for your support. I will never forget this experience.
Abstract
VICTORIA INGHRAM: Nutritional Knowledge and Behaviors of Undergraduate Students (Under the direction of Dr. Melinda Valliant)
Poor dietary behavior can lead to various chronic health conditions, such as heart disease and obesity. Because dietary intake takes time to impact health, observing diet knowledge in college students can be beneficial. This study sought to measure whether
greater nutritional knowledge would translate to a healthier dietary intake. Nutritional knowledge and behavior were measured and then compared in 257 students in two different undergraduate classes - an introductory nutrition course and a standard biology
course - which was the control group. Each class was given the same survey at the beginning and end of the fall semester. Results indicated that the knowledge of the
recommended daily fruit and vegetable intake, per the USDA, did not improve throughout the semester. There was no significant change in nutrition students that consumed vegetables daily, however the number of students that consumed fruit daily increased by 5%. Knowledge regarding saturated fats increased by 15%. The nutrition students decreased their saturated fat consumption by 1g, which placed their saturated fat
intake at 10.2 g per day. Nutrition education had a positive impact on nutritional knowledge and did translate to the students’ diets in some aspects of nutrition, but not all
of them. This indicates that nutritional knowledge is an effective way to improve dietary behavior, however knowledge is not always the only factor that will change behavior.
TABLE OF CONTENTS
LIST OF FIGURES...7
LIST OF APPENDICES...8
INTRODUCTION...9
REVIEW OF LITERATURE...10
METHODS...16
RESULTS...18
DISCUSSION...32
CONCLUSION...38
REFERENCES...41
APPENDICES...,...44
LIST OF FIGURES
Figure 1 Correct Answers for Fruit and Vegetable Recommended Servings Per
Day...19
Figure 2 Correct Answers For: “What fat do experts say is most important for people to cut down on?...20
Figure 3 Correct Answers For: “Saturated fats are mainly found in”………..21
Figure 4 Correct Answers For: “Harder (solid) fats contain more:”………22
Figure 5 Do you eat fruit every day? ...23
Figure 6 If yes, how many servings of fruit do you eat in one day?...24
Figure 7 If no, how many times do you eat fruit in one week?...25
Figure 8 Do you eat vegetables every day? ...26
Figure 9 If yes, how many servings of vegetables do you eat in a day?...27
Figure 10 If no, how many times do you eat vegetables in one week?...28
Figure 11 Grams of Saturated Fat Consumed Per Day...31
Figure 12 How many times do you eat fast food in one week?...32
LIST OF APPENDICES
APPENDIX A SURVEY...45
APPENDIX B DAILY SATURATED FAT INTAKE………..62
Introduction
Undergraduate students are known for having a poor dietary intake, which can lead to weight gain. This trend is commonly referred to as the “Freshman 15”. In general, excessive energy intake can lead to weight gain, and if not managed, it can turn into obesity. Obesity is prevalent in the United States and is a major risk factor for various health conditions that can become fatal.
Reasons for an individual’s poor dietary habits could be due to many factors.
Some of these factors can include, but are not limited to, the lack of nutritional
knowledge, negative attitudes towards nutrition, and self-efficacy. In regard to increasing nutritional knowledge, many scientific studies have shown that various outcomes may or may not result in an improved nutritional behavior. Because of the varying results, further research is necessary for this topic to be fully explored.
College is a very impressionable time for the students. Habits formed during these years can last throughout a person’s lifetime. If a student learns about nutrition in their college years and increases their knowledge on how to consume a healthier diet, then it could be assumed that their dietary intake might also improve. If their dietary habits improve throughout this impressionable life stage, then it is possible that these habits will last throughout their entire adulthood. Consumption of a healthful diet can act as a preventative action against acquiring many life-threatening health conditions.
Review of Literature
Knowledge of nutrition
Adequate and appropriate nutrition knowledge is critical in order to eat a healthy diet. Unfortunately, there are a myriad of different opinions on what comprises a healthy diet, which can be confusing to people. According to Trabucco et al. (2013) in their study on the nutritional knowledge and behaviors of college student athletes, students have found many opinions from several different sources. This can translate to all university students because there are a plethora of contradicting sources about every aspect of nutrition. This alone can make it very difficult for one to know what is considered to be
“healthy” and what is not. Trabucco et al. (2013) also found that having appropriate education on nutrition will oftentimes help improve the students’ nutritional status. This suggests that having adequate nutrition knowledge can translate into the consumption of a healthy diet. A specific example includes a study on the factors that affect the use of nutrition information, health claims, and labels on food. In this study, Petrovici et al.
(2012) found that obtaining a nutrition education benefited their subjects in regard to properly using health claims on a food or beverage item. Another example is from a study that compared the knowledge of fats among university students. In this study, Kowalska et al. (2013) found that 73% of students in America believe that fats are a “negative food component”. Additionally, a study done by Hong et al. (2015) discussed the challenges of maintaining a healthy diet. They investigated the difference in Body Mass Index (BMI) between nutrition majors and non-nutrition majors. It was assumed that the nutrition majors would have more knowledge of nutrition and a healthier BMI than the other non
-nutrition majors. The authors found that the nutrition majors tended to have a healthier BMI than those who did not major in nutrition. Those majoring in nutrition are likely to understand more about nutrition than those who study something else, as they have taken classes that specifically teach them about consuming healthy diets. It can be inferred that having a higher knowledge of nutrition can impact one’s BMI and overall health. To further back up the point that the individual’s nutritional knowledge is lacking, Van den berg et al. (2012) found that the vast majority of surveyed nursing students did not know that carbohydrates should be consumed the most in a day. These nursing students are training to become health professionals, who sometimes make general dietary
recommendations to patients. Van den berg et al. (2012) argued that it is very important for them to be able to give proper advice and to be a good example to their patients.
In another study, Dissen et al. (2011) found that having a positive attitude towards nutrition was associated with having a higher knowledge of nutrition. However, the results of this study showed that nutritional knowledge correlated with fruit and vegetable consumption only in men, not for the females.
Attitudes of students towards nutrition
How a person views and feels about nutrition can either positively or negatively impact whether or not they have a healthy diet. In fact, Gracia et al. (2007) found that the surveyed individuals who marked nutrition as important in their lives also had a higher chance of reading the nutrition label before purchasing a food item. Another study found that these individuals would be more likely to read and use the nutrition claims instead of using taste alone to decide what they eat (Petrovici et al. 2012). Reading and using tools such as nutrition labels and nutrition claims can help drastically improve one’s diet. El-
Ahmady and El-Wakeel (2016) found that knowledge alone is not enough to make a person eat healthy. This study found that university students in Egypt preferred more convenience foods so that they could easily eat on the go, instead of a proper meal. The lifestyle of an individual plays a large role in their food choices. University students live fast paced lives and do not typically plan the time to prepare a nutritious meal. Time is a major factor that can affect one’s attitude and in turn, one’s nutrition. To further support this statement, Van den berg et al. (2012) found that eating habits associated with the obesity epidemic typically involve high consumption of energy-dense foods that lack nutrients, low consumption of fruits, vegetables, and dairy, skipping breakfast, and very little physical activity. These behaviors are considered to be universal and Van den berg et al. (2012) later mentioned that counseling individuals was very effective in reducing their risk of many nutrition related diseases such as hyperlipidemia and cardiovascular diseases are some examples that they mentioned in the article. They also reported that having a higher knowledge of nutrition is not always the highest motivator for health professionals to eat a healthy diet. They decided this because the surveyed nursing students that scored above a 50% on the nutritional knowledge portion did not eat any healthier than the nursing students that did not score as high. Further research is needed in order to see if the same results would be repeated. Sometimes nutritional knowledge can be skewed by skepticism. Moorman (1996) and Szykman et al. (1997) both found that the individuals that are skeptical about the legitimacy of the food labels on food packaging were less likely to read the nutrition information. Some food producing companies over exaggerated their claims on their food labels, which caused many individuals to disbelieve even the nutrition facts. Looking at and understanding the
nutrition information is important to help consumers make the healthiest food purchases.
While this study did not measure whether or not individuals looked at the nutrition facts upon purchasing food items, like the studies done by Moorman (1996) and Szykman et al. (1997), it did compare the knowledge of certain concepts that are on these food labels to their typical dietary intake.
Nutritional behavior of undergraduate students
Many studies have reported that university students typically do not consume an adequate diet. In 2017, Tam et al. confirmed in their small-scale study that university students do not consume the recommended amounts of fruits and vegetables. They did not investigate the cause of this, so further research is necessary in order to find out if nutritional knowledge and fruit and vegetable intake correlate. The Center for Disease Control (CDC) reported that 30.1% of adults, ages 18-24 years old in a population of 20,264 individuals in the United States in 2015, claimed that they consumed vegetables less than one time daily (CDC, 2018). They also found that 40.2% of them consumed fruit less than once daily. According to the USDA, adults between the ages of 19-30 years old are recommended to consume 2 ½ - 3 cups of vegetables and two cups of fruit per day (USDA Vegetable, 2018).
Nutrition in relation to health problems
An individual’s nutritional status translates to their overall health. The Center for Disease Control found that in the years 2015-2016, both men and women in the United States of 20-39 years had an average BMI of 28.7. A BMI of 28.7 is classified as overweight (CDC, 2018). This fact is important to note because undergraduate students are typically in this age range. In 2007, a CDC essay written by Phillip B. Sparling,
explained how the CDC is more concerned about the prevalence of obesity than drugs and alcohol on college campuses. While the CDC highly recommends against
participation in drugs and alcohol, they have noticed that universities emphasize educating their students about drugs and alcohol more than they do about diet and exercise. As a result, the CDC recommended that universities educate their students on proper nutrition and exercise. The goal of the CDC is to “decrease the prevalence of obesity through healthy weight loss and maintenance of weight loss among the overweight and to prevent excess weight gain among the non-overweight” (Sparling, 2007).
Although the CDC recommended that universities provide more information to their students about nutrition, the American College Health Association found that only 52.4 percent of students in the United States claimed that they had received any
information from their college related to nutrition in their National College Health Assessment given in the fall of 2017 (NCHA, 2018). This is a major concern because nutrition is a key component to a healthy BMI. Being overweight can create many health problems for the human body.
While many of the results in these studies varied, the studies that addressed the typical diets of university students all concurred that university students do not typically consume an adequate diet. This includes fruit and vegetable intake, amongst many other aspects of nutrition (CDC, 2018; Tam et al. 2017). It is clear that the nutritional behavior of university students needs to be explored into further research.
In regard to nutritional knowledge translating to behavior, many of the studies had differing results. For example, Trabucco et al. (2013) found that nutrition education, and
therefore increasing nutritional knowledge, will oftentimes improve the nutritional statuses of college student athletes. Other studies similarly found that students majoring in nutrition were more likely to have a healthier BMI than non-nutrition students (Hong et al. 2015). It can be inferred that because of an increase in nutritional knowledge throughout the college years, a healthier BMI, one indicator used to measure a person’s overall health, was a result.
However, other arguments can be made, stating that there are other factors contributing to the improvement of nutritional behavior in these studies. For example, attitude was a major factor in the study conducted by Dissen et al (2011), as positive attitudes towards nutrition was associated with a higher knowledge of nutrition. This goes along with previously mentioned study, as the students majoring in nutrition chose to study nutrition. This alone can indicate that these students also had a more positive attitude towards the subject, causing them to want to gain more knowledge on the matter (Hong et al. 2015). Other factors pertaining to nutritional behavior could include a college student’s typical “on-the-go” lifestyle, as mentioned by El-Ahmady and El- Wakeel, (2016).
All in all, there is not enough evidence to conclude whether or not nutritional knowledge is a major component in changing dietary behavior. The purpose of this research paper is to attempt to find a correlation between nutritional knowledge and behavior. The focus will be on nutritional knowledge and how it translates to
undergraduate students’ fruit, vegetable, and saturated fat intake, as the consumption of these dietary components are commonly associated with predisposing many health conditions.
Methods
The sample in this study consisted of students who were taking one of two undergraduate courses at the University of Mississippi - Nutrition (NHM 311) or Inquiry Into Life Human Biology (BISC 102). This sample was chosen because the nutrition course educates the students on basic nutrition and the biology course consisting of all majors was used as the control group. The enrollment for the nutrition class was 83 students and for the biology course, 128. The purpose of choosing an introductory nutrition course was to see if taking this course would correlate with any dietary changes in the students taking it. This could either be done by increasing their knowledge of nutrition or causing them to have more positive attitudes towards the subject. This study seeks to find whether or not knowledge in nutrition or the attitude towards nutrition can dictate whether or not a person consumes a healthy diet. The purpose for surveying the students in the standard biology course is because a myriad of college majors are required to take this course, so there would be a wide variety in students. Also, it had a similar sample size to the surveyed nutrition course, so it would be easy to compare the two classes. The biology course served as the control group in this study.
During the fall 2018 semester, a total of 257 undergraduate students attending the University of Mississippi were surveyed to gauge their knowledge and attitudes of nutrition to find out if it translated to their dietary intakes. Two classes offered at the University of Mississippi were surveyed; an introductory to nutrition course and a standard biology course for all majors. The same survey was used throughout the entire process. The surveys were given twice to both classes; once at the beginning of the
semester and once at the end. This was done in order to see if the knowledge that was taught in the introductory nutrition course correlated with the students’ attitudes and dietary behaviors. The goal of distributing the surveys twice was to measure any changes in the attitude and/or behavior answers for the nutrition course. The purpose of this research is to attempt to find a cause behind low consumption of fruit and vegetables. The survey given in the study conducted in this paper asked the undergraduate students what they thought that the recommended fruit and vegetable intake was.
Research protocol and data analysis
Before the surveys were distributed to the classes, an announcement was made to the students defining the survey and explaining that participation was completely optional and anonymous. An informed consent form was placed before the survey itself according to standard IRB protocol. The surveys were then passed out to the students. Once
everyone that chose to take the survey had finished, the completed surveys were then collected by the primary investigator. This protocol was done for each class in the beginning of the semester and at the end.
The data analysis was done by scoring and comparing each of the surveys. The surveys were manually inserted into a Microsoft Excel sheet. There were four categories of data; Nutrition Before (NCB), Nutrition After (NCA), Biology Before (BCB), and Biology After (BCA). Once the data was put into the excel sheets, the individual data entries for each category were then averaged by question and scored. Once the data was scored for each category, the scores were compared and analyzed by using percentages, averages, and charts through Microsoft Excel formulas. Data was considered to be significant if percentages were greater than or equal to 5%.
Questionnaire
The survey used in this study was adapted with permission from Dr. Najat Yehia’s research, “Level of nutrition knowledge on undergraduate students and its association with fat consumption.” (Yahia et al. 2016). To fit the purpose of this study, some of the text in the original survey was reworded or removed by the primary investigator. See Appendix A for the survey used. (The survey given in the study conducted asked the undergraduate students what they thought that the recommended fruit and vegetable intake was. The survey also measures the dietary intake of the students.)
Results Knowledge
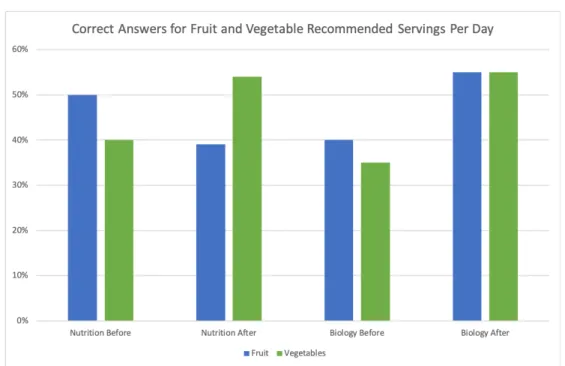
The USDA recommends one to two servings of fruit and three to four servings of vegetables each day (USDA Fruit, 2018). Figure 1 shows the percentage of the students from each course that got the daily serving amounts correct, per the USDA.
The nutrition students that recorded the correct serving amount for fruit decreased by 11%. In the NCB 50% of the students got the amount of servings correct, but towards the end of the semester, the NCA students had 39% of the students get the correct answer.
As for vegetables, the opposite occurred. The nutrition students that got the vegetable servings correct increased by 14% throughout the semester to achieve a final percentage of 54.
The biology students that recorded the correct amount of servings of fruit and vegetables increased. In regard to the servings of fruit, there was a 15% increase in the students that got the correct answer, which put the BCA class at 55%. For the vegetable
servings, the biology students increased by 20% to reach a total of 55% of the BCA students that recorded “three to four” servings of vegetables daily.
Figure 1. Analysis of students reporting the correct recommended amount of fruit and vegetable servings per day at the beginning and the end of the nutrition and biology courses. The higher the percentage, the higher the number of students that answered the question correctly. These percentages were calculated relative to the number of
participants in each class.
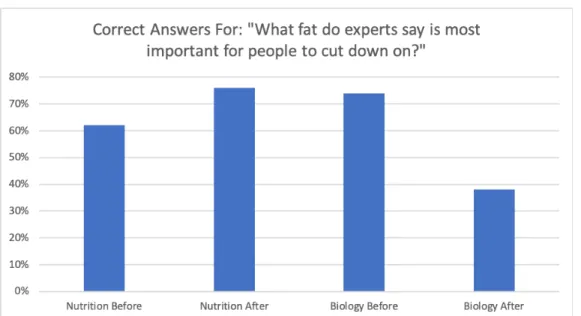
The participating students were asked the kind of fat that experts recommended reducing in their diet. Figure 2 displays the number of students that answered the question correctly with “saturated fat” for each class. The nutrition students that
answered with “saturated fat” increased by 14% by the end of the semester. At the end of the semester, the BCA students had 76% of the students get the answer correct. The biology students that answered this question correctly decreased drastically by 36%. The BCA students ended the semester with only 38% of the students answering “saturated fat” as the fat that is recommended by experts to cut down on.
Figure 2. Analysis of participants in the nutrition and biology course that reported
“saturated fat” as the fat that experts recommend reducing in their diet. Percentages were compared between the beginning and the end of the nutrition and biology courses,
relatively. The percentages were calculated based on the number of students that took the survey per each class.
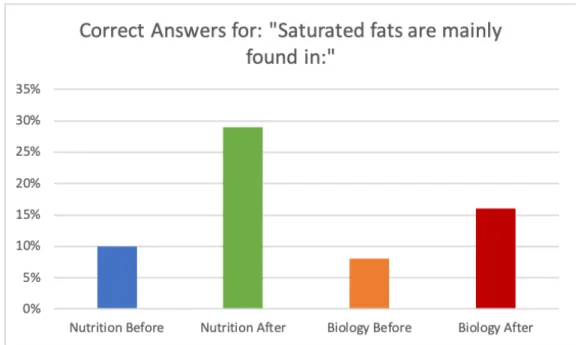
Each student was given a multiple-choice question asking what foods they thought that saturated fats were typically found in. Their answer options were vegetable oils, dairy products, both vegetable oils and dairy products, and “not sure”. Figure 3 displays the percentage of students answering with the correct answer, “dairy products”.
The nutrition students that chose “dairy products” as their answer increased by 19% between the NCB and the NCA. They increased from 10% up to 29% of the students getting the correct answer. The biology students that chose “dairy products” as their answer increase by 8% between the BCB and the BCA students. They began with 8% getting the correct answer in the BCB and ended the semester with 16% of the students getting the correct answer in the BCA.
Figure 3. Analysis of participants that chose “dairy products” as the main source for saturated fats. Percentages were compared between the results of the beginning and the end of the nutrition and biology courses. The percentages for each class were calculated and compared relatively, based on the number of students that participated in the survey.
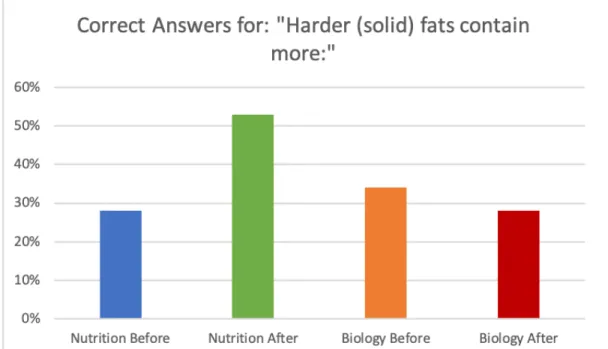
Students were asked which kinds of fats were solid in a multiple-choice question.
The options for answers were monosaturated, polyunsaturated, saturated, and “not sure”.
Figure 4 shows the percentage of students that answered the question correctly with
“saturated” fats.
The nutrition students that answered the question correctly increased by 25%, with a final percentage of 53% in the NCA. The biology students decreased the number of students who answered the question correctly by 6%. The final percentage of students that answered correctly in the BCA was 28%. The difference between the NCA and the BCA is 15%.
Figure 4. Analysis of participants that reported that harder (solid) fats contained more saturated fat. Percentages were compared between the beginning and the end of the nutrition and biology courses, relatively. The percentages were calculated based on the number of students that took the survey per each class.
Behavior
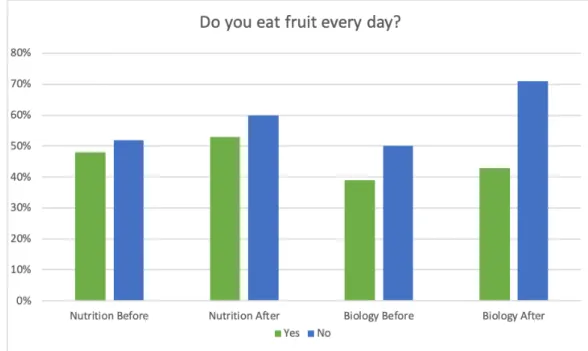
Figure 5 shows the percentage of students that answered “yes” or “no” to the question, “Do you eat fruit every day?” These numbers were converted into percentages and analyzed in this section. When the biology students were asked if they ate fruit every day, the BCB and BCA that said yes remained between 39-43% indicating that there was no significant change in daily fruit consumption in the biology course. However, in the nutrition course, the daily fruit consumption went up by 5%. In the NCB, 48% of the students reported eating fruit every day, which was originally more than the biology course. Then, the NCA had 53% of the students report that they ate fruit every day. For each of the sections, the number of students that said that they did not eat fruit every day was higher than the number of students that said that they did eat fruit every day.
Although the majority of the students reported not consuming fruit every day, the daily fruit intake of the nutrition students did increase by 5% throughout the college semester.
Figure 5. Analysis of students that reported eating fruit every day were compared by the responses in the nutrition and biology courses. Percentages were compared between the beginning and the end of the nutrition and biology courses, relatively. The percentages were calculated based on the number of students that took the survey per each class.
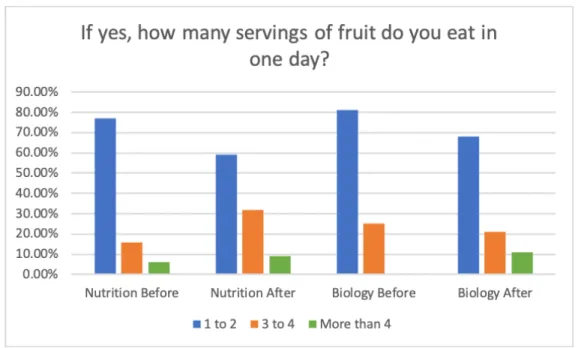
The students that reported consuming fruit once every day were later asked how many servings of fruit that they ate in one day, as referenced by Figure 6. Seventy-seven percent of the NCB students said that they ate one to two servings of fruit, which
decreased by 18% in the NCA. In turn, the students that ate three to four servings of fruit per day increased by 16%. There were no significant changes in the nutrition students consuming four or more servings of fruit per day.
The biology students that reported consuming one to two servings of fruit each day decreased between the BCB and the BCA by 13%. The biology students that ate three to four servings remained around 23%, while the students that reporting eating four
or more servings of vegetables increased from 0% to 11%. The USDA recommends that adults of the ages of 19-30 consume around one to two servings of fruit daily (USDA Fruit, 2018).
Figure 6. Analysis of the amount of fruit servings consumed in one day. Percentages were calculated based on the number of students that reported consuming fruit every day in the previous question shown in Figure 5. The percentages were compared between the responses at the beginning and the end of the nutrition and biology courses.
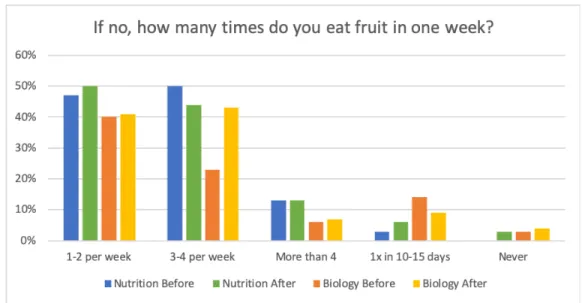
Students that said that they did not eat fruit every day were later asked how many times they consumed fruit in one week, as referred to in Figure 7. For the nutrition courses, the results remained relatively similar to one another, except for a 6% decrease in students that reported consuming fruit three to four times per week between the NCB and the NCA. As for the biology students, there were only two significant changes. There was an increase of 20% in the number of students that reported consuming fruit three to four times per week between the BCB and the BCA. Along with this, there was a 5% increase in the number of students that reported consuming fruit one time every ten to fifteen days between the BCB and the BCA courses. Although this chart alone is not enough to form a
conclusion, it can be inferred that the frequency of fruit consumption had little change among the nutrition students and the frequency of fruit consumption in the biology students seemed to increase.
Figure 7. Analysis of the amount of times that fruit was consumed in one week among the students that said that they did not eat fruit every day. Percentages were calculated based on the number of students that did not say yes to eating fruit daily, as referred to in Figure 5. The percentages of the participants reporting the amount of times that fruit were consumed in one week were compared between the beginning and the end of the nutrition and biology courses.
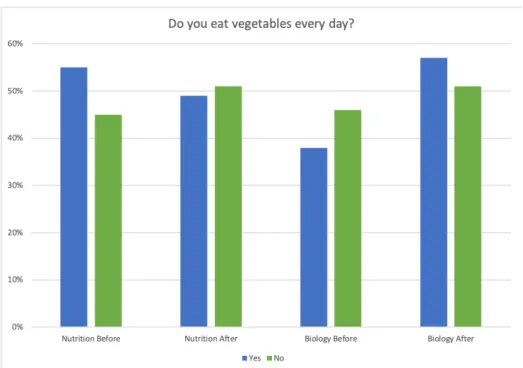
As shown in Figure 8, students were asked whether or not they consumed vegetables every day. The nutrition students that reported eating vegetables daily in the NCB decreased by 6% in the NCA. The students that reported eating vegetables every day in the biology class however, increased by 19% by the end of the semester. Both of these percent changes are significant. The proportions of the students that said yes or no in the NCB, NCA, and NCA were approximately 50-50.
Figure 8. Analysis of students that reported consuming vegetables every day. The percentages show a comparison between the survey responses in the beginning and the end of the biology and nutrition courses. Percentages were calculated based on the number of participants in each course.
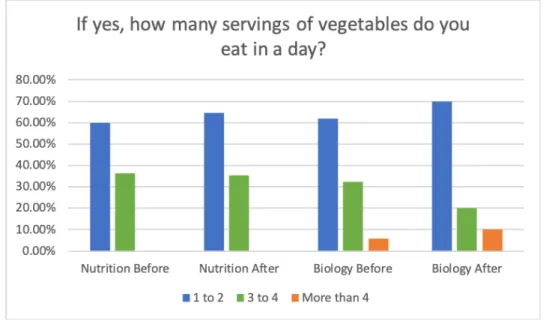
The individuals that reported consuming vegetables every day were later asked how many servings of vegetables that they ate daily, as shown in Figure 9. There were no significant differences in the nutrition course in regard to their daily vegetable intake, however, there were some significant differences between the BCB and BCB. 62% of the BCB students that reported eating vegetables every day said that they consumed one to two servings of vegetables per day. The BCA students had 70% say that they consumed one to two servings per day. This is an increase of 8%. Among the biology students that reported consuming three to four vegetable servings daily, there was a 12% decrease between the BCB and the BCA students. When looking at the proportions, the average of the nutrition students that reported consuming three to four servings of vegetables in one day was 36%, while the average of the biology students was 26%. This is a 10%
difference in the average of students reporting this. This shows that the nutrition students were 38% more likely to get three to four servings of vegetables per day, which meets the USDA vegetable intake guidelines for men and women between the ages of 19 and 30 years old (USDA Vegetable, 2018).
Figure 9. Analysis of the amount of vegetable servings consumed daily. Percentages were calculated based on the number of students that said that they ate vegetables every day, as referred to in Figure 8. The percentages of the reported amounts of vegetable servings per day were compared between the beginning and the end of the nutrition and biology courses.
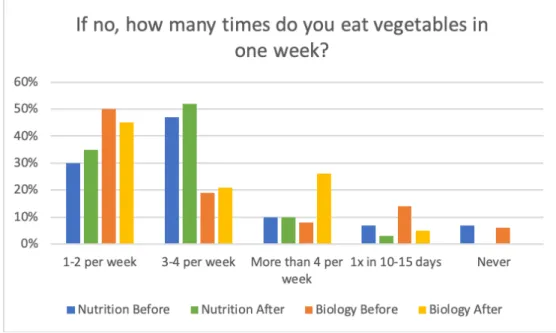
The students who responded “No” to the question, “Do you eat vegetables every day?” were later asked how many times they consumed vegetables per week, as
referenced by Figure 9. Proportionally, the responses of the NCA showed that the
nutrition class intake of vegetables three to four times per week had increased by 5%. The amount of nutrition students that consumed vegetables four times or more in one week remained at 10%. The nutrition students that reported never consuming vegetables before dropped to 0% in the NCA.
Additionally, the biology course also increased their vegetable intake per week according to the survey responses. The most significant finding for this section of the survey showed that the biology students that consumed vegetables more than four times in one week increased by 18%. Those who reported eating vegetables three to four times per week were only at a 2% difference. The students that reported consuming vegetables once in every ten to fifteen days dropped by 9%. The biology students that said that they never consumed vegetables also decreased to 0%.
Figure 10. Analysis of the amount of times that vegetables were consumed in one week among the students that said that they did not eat vegetables every day. Percentages were calculated based on the number of students that did not say yes to eating vegetables daily, as referred to in Figure 8. The percentages of the participants reporting the amount of times that vegetables were consumed in one week were compared between the beginning and the end of the nutrition and biology courses.
The students were given a chart in Section E of the survey as an intake screener.
For the purposes of this study, grams of saturated fat consumed in one month were measured and compared amongst students in the beginning and the end of the nutrition
document (see Appendix B for the charts). In the survey, students were asked their consumption frequency per each month for seventeen different foods that were high in saturated fats. In the charts shown in Appendix B, the students were categorized by each class (NCB, NCA, BCB, and BCA). The student responses for each food item were totaled and placed in the chart based that corresponded with the correct food frequency.
For example, in the NCB, ten students said that they consumed ground beef once per month.
Once the totals of students were gathered for each food frequency response in the chart, a factor was created. These factors were individualized by each food item’s grams of saturated fat per each serving size, as referenced by the USDA’s Food Composition Database on the standard setting. Some of the food items were listed in multiples, so if this occurred, the grams of saturated fat per serving for each food item in the list were averaged and used as the factor for that row’s calculations.
Next, the points were assigned to each food frequency category. The food
frequency points were distributed as follows: The total of students reporting consumption of a food for once a month or less received one point. Total consumption of two to three times a month received 2.5 points. The total consumption of one to two times a week received six points (average of one and a half times per week multiplied by four weeks).
Students reporting consumption of a food three to four times a week received fourteen points (average of three and a half times per week multiplied by four weeks). And lastly, the total of students that reported food consumption of five times a week or more
received twenty points (five times per week multiplied by four weeks). These points were distributed based on the amount of days in one month.
These points were multiplied by the total number of students per each respective food frequency category. Once all of the food frequency categories were completed, the product of the number of points received and the number of respondents per each food frequency category were then totaled for each of the seventeen food items. Once the total of students and points were calculated, the weighted totals for each food item were then multiplied by the factor of grams per serving in each food item. The weighted totals for each of the seventeen food items were summed and divided by the number of students in each class to finally find the number of the approximate grams of saturated fats that were consumed each month. This added weighted total for each class was then divided by 30.5 days (average number of days in a month) to show how many grams of saturated fat were consumed in one day. This process was repeated for each class.
The nutrition and biology course students’ daily saturated fat consumption were compared, as referred to in Figure 11. The results showed that the average amount of saturated fat consumed in one day in the NCB was 11.2g, while the average of the NCA decreased to 10.2g per day. For the biology students, the BCA consumed 10.8g of saturated fat per day. This increased up to 14.7g of saturated fats consumed in one day by the BCA students.
Figure 11. Analysis of the approximate grams of saturated fat consumed in one day based on the reported food frequency of the intake screener given in Section E of the provided survey. The results were compared between nutrition and biology courses at the beginning and the end of the semester.
Students in the nutrition course significantly decreased their fast food intake at the end of the semester, as referred to in Figure 12. 12% of the NCB students reported that they never consumed fast food in the beginning of the course. At the end of the course, 20% of the NCA students said that they never ate fast food. This is a 67% increase of students that reported never consuming fast food. 18% of the NCB students said that they consumed fast food once in every ten to fifteen days. 40% of the NCA students said that they ate fast food once in every ten to fifteen days, which is more than doubled.
In the biology course, 35% of the BCB students said that they ate fast food more than two times a week, which increased to 44% when the BCA students took the surveys.
4% of the BCB students reported that they never consumed fast food and 1% of the BCA students said the same. Comparing the two “after” courses shows that the nutrition
Figure 12. Analysis of the frequency of fast food consumption per week. Percentages were calculated based on the number of participants in each course and the range of occurrences of weekly fast food consumption. The percentages of the weekly fast food consumption were compared between the beginning and the end of the nutrition and biology courses.
Discussion:
The current study’s purpose was to identify relationships among the knowledge and behavior towards nutrition in undergraduate students taking an introductory nutrition course. The main purpose of this study was to determine if knowledge of nutrition can improve dietary habits. The study examined the relationships between the self-reported answers provided by the college students in the introductory nutrition course and the biology course on the given surveys by analyzing various questions.
Knowledge
In the knowledge section of the results, the students’ knowledge in nutrition was compared among the students taking the introductory nutrition course and the students taking the standard biology course. The results varied per each question asked on the survey.
One of the questions asked the students for the recommended servings of fruit and vegetables per day. The results indicated that more of the biology students knew the recommended serving amount for fruit than the nutrition students. It appeared that the biology students increased their knowledge about the recommended amount of fruits and vegetable servings per day. The nutrition students that answered the correct daily
recommended servings of fruit actually decreased by 11% between the NCB and the NCA. One reason for this decrease may be that the nutrition students could have learned this information in the beginning of the semester and forgot it at the end. Another reason could be that the nutrition students learned about the positive effects of fruits in the body, so they could have answered with a higher amount of servings per day than
recommended by the USDA. This showed that the nutrition students did not improve their knowledge on fruit and vegetable intake by taking a nutrition course.
Another question asked the students about the kinds of fats that experts
recommend cutting down on. The correct answer was saturated fats. The results showed that the nutrition students improved the number of students that answered correctly by 14%. The biology students decreased the number of students that answered correctly by 36%. One can infer from this information that the nutrition students gained more
knowledge about saturated fats than the biology students. Saturated fats are important to know about as excessive intake can contribute to many future health conditions.
When the students were asked about where saturated fats were typically found, the nutrition students that answered the question correctly increased dramatically between the before and after by 19%. The biology students that answered correctly also increased between the before and after, but by 8%. This information shows that even though a course may not be teaching the specific information, such as where saturated fats are found, individuals will be able to learn that specific information from their environment and through other sources. However, the nutrition students that answered correctly was more than double the amount than the biology students that answered correctly. The connection between this information could show that taking a nutrition course will make a person more likely to gain more knowledge on this subject.
The students were asked about which fat was mostly found in harder (solid) fats.
The correct answer was saturated fats. The nutrition students that answered correctly increased by 25%, with a final percentage of 53% in the NCA. The biology students that answered correctly decreased by 6% and only 28% of the BCA students got the answer right. These results show that the nutrition students gained more knowledge on the application side of the saturated fats. In other words, they learned how to apply their knowledge of saturated fats to their life by being able to identify which foods contain saturated fats.
Behavior
In the behavior section of the results, dietary intake was analyzed and compared.
Important findings concluded that the nutrition students improved their daily fruit intake
by 5% upon taking the introductory nutrition course. More students said that they did not consume fruit daily, however there was a reasonable improvement. The biology students’
daily fruit intake remained fairly similar throughout the semester. These results show that taking an introductory nutrition course may benefit the daily intake of fruit of
undergraduate students.
As for amount of servings of fruit per day, the number of students in both the biology and nutrition course that reported consuming one to two servings of fruit daily decreased. The recommended daily intake for fruit is around one to two servings for adults of the ages 19-30 years old, per the USDA (USDA Fruit, 2018). Specifically in the nutrition course, students that reported consuming three to four servings of fruit per day increased by 16% and the students that reported consuming one to two servings of fruit per day decreased by 18%. It is possible that the 16% in NCB changed from eating one to two servings each day to eating three to four servings each day. This could be because the students learned about the benefits of consuming fruits in their diet, which could have translated the idea for them to increase their fruit intake, although it is higher than the recommended daily amount.
Additionally, the students that did not consume fruit daily were asked how frequent they consumed fruit in one week. The significant findings in this set of data showed that there was a 6% increase in the nutrition students that reported consuming fruit three to four times per week in the NCA, however in the biology students, there was a 20% increase of students in the BCA that reported consuming fruit three to four times per week. This infers that taking an introductory nutrition course did not significantly affect for weekly fruit consumption. The 20% increase in the biology students could have
been because two different samples of biology students were compared, meaning that it is possible that results could be different if the same set of biology students were compared in the BCB and the BCB.
The daily vegetable intake for the nutrition students decreased by 6%, however the students that claimed to eat vegetables every day still managed to stay in the range of 49-55%. In the biology course, there was a substantial 19% increase in students that reported consuming vegetables every day. This could be because a different section of biology students’ answers was compared. This shows that taking an introductory nutrition course may not improve undergraduate students’ daily vegetable intake.
As for the amount of servings of vegetables per day, the nutrition students had no significant changes between the NCB and the NCA. However, the biology students that reported eating three to four servings of vegetables each day increased by 12% between the BCB and the BCA. The USDA recommends eating three to four servings of
vegetables every day (USDA Vegetable, 2018). This finding also shows that an
introductory nutrition course may not improve an undergraduate student’s daily vegetable intake.
Additionally, the students that said they did not consume vegetables every day were asked how many times they ate vegetable in a week. The significant findings from this question showed that the nutrition students that reported eating vegetables three to four times a week increased by 5% and the students that reported never eating vegetables dropped to zero percent. However, the biology course also increased their weekly
vegetable intake. The students that reported eating vegetables three to four times a week increased by 18% and the students that reported never eating vegetables also dropped to
zero percent by the end of the semester. The connections between this data are difficult to deduce, however it is possible that the nutrition students gradually increased their
vegetable consumption per week, instead of consuming vegetables every day. Because the biology course improved so drastically, it is also possible that an introductory nutrition course would not improve the weekly intake of vegetables in students. The biology course does not teach students about vegetable intake, so they may have
increased their vegetable intake due to their environment or circumstances. Additionally, this drastic increase of weekly vegetable consumption could also be because different sections of biology students were compared.
Another result showed the comparison of daily saturated fat intake between the nutrition and biology courses. It is important to note that the American Heart Association recommends saturated fat consumption of no more than 5 to 6 percent of total calories.
This can range from eleven to thirteen grams of saturated fat per day, based on a diet of 2,000 calories a day for the average person (American Heart Association, 2017). The nutrition students remained in this recommended range throughout the semester. The nutrition students decreased the saturated fat consumption by one gram, which placed them below the recommended grams of saturated fat limit per day. Based on this information, one could infer that taking an introductory nutrition course may decrease daily saturated fat intake. Additionally, the biology course increased their saturated fat intake by 3.9 grams, which brought them to 14.7g of saturated fats consumed daily at the end of the semester. With this information, one can infer that taking an introductory biology course does not help decrease consumption of saturated fats. For the biology
course, the results may have had such a dramatic increase of saturated fat consumption due to using a different sample of students for the BCB and the BCA.
Students were asked about their weekly fast-food intake. In the nutrition course, there was a 67% increase in students that never consumed fast food between the NCB and the NCA. The nutrition students that reported eating fast food once in every ten to fifteen days more than doubled at the end of the semester. This shows that students were decreasing their fast-food intake and eating it in moderation. In the biology course, the students that reported eating fast-food more than twice a week increased by 9%. Based on these results, it can be inferred that an introductory nutrition course may help decrease fast-food consumption among undergraduate students.
Conclusion
Although the nutrition course did not help improve the number of students that consumed vegetables every day or the amount of fruit and vegetable servings eaten per day, this study did find many positive connections between taking a nutrition course and the knowledge and behavior that follows it. The nutrition students did not display proficiency in the recommended daily servings of fruit and vegetables, which in result, translated to their diet. However, they did decrease their fast-food intake, and the number of students that reported eating fruit everyday increased as well, which proved that the students gained some knowledge from the introductory nutrition course. Additionally, the nutrition students greatly increased their knowledge on saturated fats. This translated to their diet by the end of the semester, as the nutrition students decreased their average daily saturated fat intake by one gram below the American Heart Association’s
recommended saturated fat limit. This is important because lowering saturated fat levels in the body can reduce risk of future health problems.
According to the results of this study, it can be inferred that nutritional knowledge is not always enough to result in a behavior change. There were scenarios where
nutritional knowledge and behavior did correlate, however there were also many
instances where the two variables did not correlate at all. The nutrition students’ overall nutritional knowledge increased for the most part, but many times in this study the behavior did not follow the knowledge.
Because nutrition translates to overall health, this study suggests that a basic nutrition course be required for all undergraduate students. This course should not include the stress of grades, but be solely there to teach the students more about nutrition and how they can apply it to their lives, which could potentially increase their overall health. With the results of this study in mind, there needs to be something else besides knowledge to motivate the undergraduate students to change their dietary habits.
More research is necessary in order to achieve a better understanding of the correlation between knowledge and behavior. A larger and consistent sample size may yield different results. Future research is needed for finding a potential correlation that causes nutritional behavior to positively change in undergraduate students.
Limitations:
The limitations of this study include using a long survey for a short amount of time. Some students may not have answered as accurately as they would have if the survey were of a smaller size, as they may have felt rushed or fatigued. Also, on the day the surveys were given to the NCA students, there were quite a few distractions, as their
next exam was to be given to them in the following class meeting. Another limitation in this study was the small sample size. More research will be needed from larger sample sizes in order to find further conclusions. Lastly, the control group used in this study came from two different biology sections from the same course and professor due to class time availability.
REFERENCES
“All about the Fruit Group.” Choose MyPlate, 4 Jan. 2018, www.choosemyplate.gov/fruit.
“All about the Vegetable Group.” Choose MyPlate, 4 Jan. 2018, www.choosemyplate.gov/vegetables.
Anthony R. Dissen, Peggy Policastro, Virginia Quick, Carol Byrd Bredbenner, (2011). ‐
"Interrelationships among nutrition knowledge, attitudes, behaviors and body satisfaction", Health Education, Vol. 111 Issue: 4, pp.283-
295, https://doi.org/10.1108/09654281111144256
CDC. (n.d.). Average body mass index (BMI) of U.S. women aged 20 years and over from 1999 to 2016, by age. In Statista - The Statistics Portal. Retrieved February 18, 2019, from https://www-statista-com.umiss.idm.oclc.org/statistics/955068/adult-female- bmi-average-us-by-age/.
El-Ahmady, Sherweit, and Lamia El-Wakeel. “The Effects of Nutrition Awareness and Knowledge on Health Habits and Performance Among Pharmacy Students in Egypt.”
Journal of Community Health, vol. 42, no. 2, 2016, pp. 213–220., doi:10.1007/s10900- 016-0245-z.
Gracia, A., Loureiro, M. and Nayga, R.M. Jr (2007), “Do consumers perceive benefits from the implementation of a EU mandatory nutritional labelling program?”, Food Policy, Vol. 32 No. 2, pp. 160-74.
Hong, M., Shepanski, T., & Gaylis, J. (2016). “Majoring in nutrition influences BMI of female college students.” Journal of Nutritional Science, 5, E8. doi:10.1017/jns.2015.24
Kowalska, Małgorzata, (2013). Comparison of knowledge in the field of nutritional fats among students. Italian Journal of Food Science, [S.l.], v. 27, n. 1, p. 21-28, mar. 2015.
ISSN 1120-1770. doi:https://doi.org/10.14674/1120-1770/ijfs.v71
Moorman, C. (1996). “A quasi experiment to assess the consumer and informational determinants of nutrition information processing activities: the case of Nutrition
Labelling and Education Act”, Journal of Public Policy & Marketing, Nos 15, Spring, pp.
28-44.
NCHA. (n.d.). Percentage of U.S. college students that had received information from their college or university about select health topics as of fall 2017. In Statista - The Statistics Portal. Retrieved February 18, 2019, from https://www-statista-
com.umiss.idm.oclc.org/statistics/826315/college-students-that-received-health- information/.
Petrovici, D., Fearne, A., Nayga R.M. Jr., Drolias, Dimitris. (2012). "Nutritional knowledge, nutritional labels, and health claims on food: A study of supermarket
shoppers in the South East of England", British Food Journal, Vol. 114 Issue: 6, pp.768- 783, https://doi-org.umiss.idm.oclc.org/10.1108/00070701211234318
Sparling, P. B. (2007, July). Obesity on campus. Preventing Chronic Disease, 4(3), 1-4.
Retrieved on November 14, 2018 from http://www.cdc.gov/pcd/issues/2007/
jul/06_0142.htm.
Szykman, R.L., Bloom, N.P. and Levy, S.A. (1997). “A proposed model of the use of package claims and nutrition labels”, Journal of Public Policy & Marketing, Vol. 16 No.
2, pp. 228-41.
Tam, C. F. et al. An Inverse Correlation between Fruit and Vegetable Consumption and BMI among College Female and Male Students. College Student Journal, [s. l.], v. 51, n.
3, p. 407–423, 2017.
Trabucco, Gabriele, et al. “Nutritional Knowledge and Behavior Among Students Practicing Sports: Comparison Between Two Countries.” Acta Facultatis Medicae Naissensis, vol. 30, no. 4, 2013, doi:10.2478/afmnai-2013-0012.
Van den berg, Violet & Okeyo, Ally & AP, Dannhauser & Nel, Riette. (2012). Body weight, eating practices and nutritional knowledge among university nursing students, Eastern Cape, South Africa: African Journal of Primary Health Care & Family Medicine.
4.http://dx.doi.org/10.4102/.10.4102/phcfm.v4i1.323.
Yahia, N., Brown, C. A., Rapley, M., & Chung, M. (2016). Level of nutrition knowledge and its association with fat consumption among college students. BMC Public Health, 16(1), 1047. doi:10.1186/s12889-016-3728-z
APPENDICES
APPENDIX A: SURVEY
Appendix A SURVEY
It is very important for the study that the survey be completed in all sections; however, if an item makes you uncomfortable, you may choose to skip it. You must answer each item with only one choice; it is important that you complete it by yourself and, if possible, don’t leave any item without an answer.
Your answers will remain anonymous and the data collected will be used only for research.
SECTION A. DEMOGRAPHIC, ANTHROPOMETRIC CHARACTERISTICS & FAMILY HEALTH HISTORY
- Age:
- Gender:
o Male o Female - Ethnic origin:
o Hispanic o White o Black o Asian
o Native American o Other:
- Major of study: (Circle one choice and write your major in the proper category) o Science:
o Non-Science:
- Year in school:
o First year (Freshman) o Second year (Sophomore) o Third year (Junior)
o Fourth year (Senior) o Fifth Year
- Employment:
o Full time: Yes No o Part-time: Yes No
- Do you live:
o On Campus o Off-Campus
o At-home with parents Anthropometric Measurements
- Weight:
- Height:
Family History
Check any health problems that your parents or biological siblings have had:
- Breast cancer - Colon cancer - Other cancer - Type II Diabetes - High cholesterol - High blood pressure - Obesity
- Overweight - Heart disease
- Other: ---
Are you on a special diet: yes no
These items are designed to record your food habits.
When more than one food are present altogether, answer the question “yes” if you consume even only one of these.
B. 1 Do you drink milk every day? □ yes
□ no B. 2 If you answered yes, how many glasses/cups of milk do you
consume every day?
□ 1-2
□ 3-4
□ more than 4 B. 3 If you answered no, how many times do you consume milk in
one week?
□ 1-2
□ 3-4
□ more than 4
□ 1 time in 10-15 days
B. 4 Do you eat pasta, rice, bread, or potatoes every day? □ yes
□ no B. 5 If you answered yes, approximately how many servings do you
eat every day?
□ 1-2
□ 3-4
□ more than 4 B. 6 If no, how many times do you eat pasta, rice, bread, or
potatoes in one week?
□ 1-2
□ 3-4
□ more than 4
□ 1 time in 10-15 days
□ never
B. 7 Do you eat fruit every day? □ yes
□ no B. 8 If yes, how many servings of fruit do you eat in one day?
(1 serving = 1 apple)
□ 1-2
□ 3-4
□ more than 4 B. 9 If no, how many times do you eat fruit in a week? □ 1-2
□ 3-4
□ more than 4
□ 1 time in 10-15 days
□ never
B. 10 Do you eat vegetables every day? □ yes
□ no B. 11 If yes, how many servings of vegetables do you eat in a day?
(1 serving = 1 cup)
□ 1-2
□ 3-4
□ more than 4 B. 12 If no, how many times vegetables in one week? □ 1-2
□ 3-4
□ more than 4
□ 1 time in 10-15 days
□ never B. 13 How many times do you eat meat in one week? □ 1-2
□ 3-4
□ 1 time every day
□ 2 times every day
□ 1 time in 10-15 days
□ never
B. 14 How many times do you eat fish in one week? □ 1-2
□ 3-4
□ more than 4
□ 1 time in 10-15 days
□ never B. 15 How many times do you eat eggs in one week? □ 1-2
□ 3-4
□ more than 4
□ 1 time in 10-15 days
□ never B. 16 How many times do you eat cheese in one week? □ 1-2
□ 3-4
□ more than 4
□ 1 time in 10-15 days
□ never B. 17 How many times do you eat ham, salami and sausages in
one week?
□ 1-2
□ 3-4
□ more than 4
□ 1 time in 10-15 days
□ never B. 18 How many times do you eat legumes in one week? □ 1-2
□ 3-4
□ more than 4
□ 1 time in 10-15 days
□ never B. 19 How many times do you eat desserts or candy in one week? □ 1-2
□ 3-4
□ 1 time every day
□ more than 1 time daily
□ 1 time in 10-15 days
□ never B. 20 How many times do you eat fried food in one week? □ 1-2
□ 3-4
□ 1 time every day
□ 2 times every day
□ 1 time in 10-15 days
□ never
B. 21 How many times do you eat in a fast-food in one week? □ 1-2
□ more than 2 times
□ 1 time in 10-15 days
□ never B. 22 How many times do you eat pizza in one week? □ 1-2
□ more than 2 times
□ 1 time in 10-15 days
□ never SECTION C. FOOD HABITS
C. 1 Do you eat breakfast? □ always
□ often
□ sometimes
□ never
C. 2 At breakfast you eat: □ biscuits/cakes/crackers/
breakfast cereals/bread
□ fruit
□ sausages and cheese
□ pizza/toast C. 3 Do you usually eat a cake or a dessert at meals? □ always
□ often
□ sometimes
□ never C. 4 Do you usually eat breakfast, lunch and dinner every day? □ always
□ often
□ sometimes
□ never C. 5 Your diet:
□ is different every day
□ is different only sometimes during the week
□ is different only during the weekend
□ is very monotonous
C. 6 The majority of your diet comes from which food group?
□ high protein content foods (meat, fish, eggs, cheese, legumes) □ high fat content foods (sausage, fried foods, desserts)
□ high carbohydrate content foods (bread, pasta, rice, potatoes, biscuits) □ different foods every day
C. 11 Your snacks are based mainly on:
□ fruit/fruit juice
□ biscuits/crackers/bread □ fried foods/granola bars/chips □ sweets/chocolate/ice cream/cakes
C. 13 How many glasses of water do you drink every day? □ 0
□ 1-2
□ 3-4
□ 5-8 SECTION D. PHYSICAL ACTIVITY AND LIFESTYLE
D. 1 Do you usually exercise? □ always during the entire year
□ only in some seasons
□ sometimes
□ never
D. 2 How many hours do you exercise a week? □ 1h-2h in a week
□ 3h-4h in a week
□ more than 4h in a week
□ 0 hours D. 4 How many hours do you spend on the computer or
watching TV?
□ 1h-2h a day
□ 3h-4h a day
□ 5h-6h a day
□ more than 6h a day
D. 6 Your lifestyle is : *** keep and give examples □ very sedentary (sitting or laying down for all of the day)
□ sedentary (limited physical activity, but mostly sitting at a desk all day)
□ moderately active (workout 3-4 times a week)
□ very active (workout like a training athelte)
SECTION E. INTAKE SCREENER
Think about your eating habits over the past year or so. About how often do you eat each of the following foods? Remember breakfast, lunch, dinner, snacks and eating out.
Check one box for each food.
Meats and Snacks 1/MONTH or less
2-3 times a MONTH
1-2 times a WEEK
3-4 times a WEEK
5+ times a WEEK Hamburgers, ground beef, meat
burritos, tacos
Beef or pork, such as steaks, roasts, ribs, or in sandwiches
Fried chicken Hot dogs, or Polish or Italian
Sausage
Cold cuts, lunch meats, ham (not low-fat)
Bacon or breakfast sausage Salad dressings (not low-fat) Margarine, butter or mayo on
bread or potatoes
Margarine, butter or any cooking oil Eggs
Pizza
Cheese, cheese spread (not low-fat) Whole milk
French fries, fried potatoes Corn chips, potato chips, popcorn,
crackers
Doughnuts, pastries, cake, cookies (not low-fat)
Ice cream (not sherbet or non-fat)
SECTION F. NUTRITION SURVEY
This is a survey, not a test. Your answers will help identify which dietary advice people find confusing. It is important that you complete it by yourself. Your answers will remain anonymous. If you do not know the answer, mark “not sure” rather than guess. Thank you for your time.
1. Do you think health experts recommend that people should be eating more, the same amount, or less of these foods? (Check one box per food)
More Same Less Not
Sure Vegetables
Sugar Meat
Starchy foods Fatty foods High fiber foods Fruit
Salty foods
2. How many servings of both fruit and vegetables a day do you think experts are advising people to eat? (One serving could be, for example, an apple or a handful of chopped carrots)
Fruit:
Vegetables:
3. Which fat do experts say is most important for people to cut down on?
a. Monounsaturated fat b. Polyunsaturated fat c. Saturated fat d. Not sure
4. What version of dairy foods do experts say people should eat?
a. Full fat b. Lower fat
c. Mixture of full fat and lower fat d. Neither, dairy foods should be cut out e. Not sure
Experts classify foods into groups. We are interested to see whether people are aware of what foods are in these groups.
1. Do you think these are high or low in added sugar? Check one box per food.
High Low Not
Sure Bananas
Unflavored yogurt
Peanut butter Tomato ketchup Canned fruit with natural
juice
2. Do you think these are high or low in fat? Check one box per food.
High Low Not
Sure Pasta (without sauce)
Low fat spread Baked Beans
Lunch meat Honey Scrambled egg
Nuts Bread Cottage cheese Polyunsaturated
margarine
3. Do you think experts put these in the starchy food group? Check one box per food.
Yes No Not
Sure Cheese
Pasta Butter
Nuts Rice Oatmeal
4. Do you think these are high or low in salt? Check one box per food.
High Low Not sure
Pasta Fish Red Meat Frozen vegetables
Cheese
5. Do you think these are high or low in protein? Check one box per food.
High Low Not
sure Chicken
Cheese Fruit Baked beans
Butter Cream
6. Do you think these are high or low in fiber? Check one box per food.
High Low Not
sure Cornflakes
Bananas Eggs Red meat
Broccoli Nuts Fish
Baked potatoes with skins Chicken
Baked beans
7. Do you think these fatty foods are high or low in saturated fat? Check one box per food.
High Low Not
sure Mackerel (fish)
Whole milk Olive oil Red meat Sunflower margarine
Chocolate
8. Some foods contain a lot of fat but no cholesterol.
a. Agree
c. Not sure
9. Do you think experts call these a healthy alternative to red meat? Check one box per food.
Yes No Not sure Lunchmeat
Baked beans Nuts Low fat cheese
Quiche
10. A glass of unsweetened fruit juice counts as a helping of fruit.
a. Agree b. Disagree c. Not sure
11. Saturated fats are mainly found in: (Check one) a. Vegetable oils
b. Dairy products c. Both (a) and (b) d. Not sure
12. Natural brown sugar is a healthy alternative to white sugar.
a. Agree b. Disagree c. Not sure
13. There is more protein in a glass of whole milk than in a glass of skimmed milk.
a. Agree b. Disagree c. Not sure
14. Polyunsaturated margarine contains less fat than butter.
a. Agree b. Disagree c. Not sure
15. Which of these breads contain the most protein? Check one.
a. White b. Brown c. Whole grain d. Not sure
16. Which do you think is higher in calories: butter or regular margarine? Check one.
a. Butter
b. Real margarine