DISTRESS RISK ASSET PRICING
Syou-Ching Lai, Hung-Chih Li, James A. Conover and Frederick Wu
ABSTRACT
We examine explicitly priced financial distress risk in post-1990 equity markets. We add a financial distress risk factor to Fama and French’s (1993) three-factor model, based on Griffin and Lemmon’s (2002) findings that financial distress is not fully captured by the book-to-market factor. We test three-factor and four-factor capital asset pricing models using both annual buy-and-hold analysis and monthly time series analysis across portfolios adjusted for common book-to-market, size, and financial distress factors. We find empirical support for an Ohlson (1980) O-score-based financial distress risk four-factor asset pricing model in the U.S. and Japanese markets.
Fama and French (1993) propose a three-factor – a market factor, a firm size factor, and a book-to-market equity (BE/ME) factor – capital asset pricing model to explain monthly stock returns for portfolios of stocks noted in Fama and French (1992). Later literature extends the three-factor model to incorporate additional pricing factors, such as Carhart (1997) adding momentum as a fourth factor. Several authors investigate financial distress as a systematic risk affecting asset returns
Research in Finance, Volume 26, 51–94
Copyrightr2010 by Emerald Group Publishing Limited All rights of reproduction in any form reserved
ISSN: 0196-3821/doi:10.1108/S0196-3821(2010)0000026006 51
(Campbell, Hilscher, & Szilagyi, 2008; Daniel & Titman, 1997; Dichev, 1998; Ferguson & Shockley, 2003; Griffin & Lemmon, 2002). We add country-specific O-score financial distress as an explicit fourth factor to the three-factor Fama and French model and test the model in two national equity markets. Our financial distress O-score four-factor model outper- forms the three-factor model and the Carhart four-factor model in pricing the U.S. and Japanese equity market returns.
In our view, a large strand of the Fama and French three-factor model literature seeks to explain cross sectional stock market factors in studies using natural groupings such as skilled or unskilled mutual fund managers (Carhart, 1997), risk of bankruptcy distress (Dichev, 1998), analyst coverage (Griffin & Lemmon, 2002), and return reversals around earnings announce- ments (Griffin and Lemmon). A second strand seeks to investigate the underlying factors explaining value and growth stock returns or to test the three-factor model in different samples such as international markets (Arshanapalli, Coggin, & Doukas, 1998a;Arshanapalli, Coggin, Doukas, &
David, 1998b; Campbell et al., 2008; Chen & Zhang, 1998; Daniel &
Titman, 1997; Fama & French, 1998; Griffin & Lemmon, 2002;
Lakonishok, Shleifer, & Vishny, 1994;Lau, Lee, & McInish, 2002). A third strand of research extends the capital asset pricing model beyondFama and French’s (1993) three-factor model (Carhart, 1997; Chen & Zhang, 1998, 2008; Vassalou & Xing, 2004; Von Kalckreuth, 2005). We incorporate financial distress risk into the three-factor model, following this third strand of research, after noting that authors have not explicitly incorporated financial distress risk as a systematic risk factor.
We develop a four-factor model that builds on Fama and French’s three- factor model to incorporate Griffin and Lemmon’s findings that Ohlson’s (1980) O-score measure captures financial distress risk beyond Fama and French’s three factors in the 1965–1996 time period for U.S. data. Our four- factor capital asset pricing model adds Ohlson’s financial distress O-score as an economy-wide factor to Fama and French’s three factors – a financial distress risk four-factor model with country-specific parameter estimates for the United States and Japan. We test the fit of the return generating process for our four-factor model against Fama and French’s (1993) three- factor model and Carhart’s (1997) momentum-based four-factor model in portfolios of value stocks and growth stocks in the U.S. and the Japanese equity markets. In our 1991–2006 U.S. and Japan Datastream samples, our financial-distress-risk-based four-factor model has stronger explanatory power than either the Fama and French three-factor model or theCarhart (1997)momentum-based four-factor model. In addition, the
country-specific four-factor models explain the returns of both value and growth stocks in Japan and the United States when partitioned into large and small stocks.
1. LITERATURE REVIEW
1.1. Fama and French Three-Factor Stock Return Model Theory and International Tests
Fama and French (1993, 1996a, 1996b, 2008)propose the following three- factor asset pricing model to explain asset returns in periodt:
ri;t¼ai;tþmi;tMTBtþsi;tSMBtþhi;tHMLtþi;t (1) whereri,t¼asset or portfolio i’s return minus the risk-free rateðri;trf;tÞ;
ai;t ¼intercept; MT Bt ¼market excess return ðrm;trf;tÞ; SMBt ¼the difference between the returns on portfolios of small and big stocks (Small Minus Big); HMLt¼the difference between the returns on portfolios of high and low book value to market value stocks (High Minus Low);i;t ¼an error term; and mi;si;hi¼asset or portfolio i’s regression coefficients for MT Bt,SMBt, andHMLt.
As pointed out byFama and French (2004), one important implication of the asset pricing test is that the intercept,ai, in the time series regression is zero, following the logic of Jensen’s alpha for portfolio returns. They indicate that, using this criterion, the Fama and French model captures much of the variation in average returns for portfolios formed on size, BE/ME and other price ratios that cause problems for the capital asset pricing model (CAPM), in U.S. stock markets.Fama and French (1998)find empirical support for their model compared to an international CAPM.
Arshanapalli et al. (1998a, 1998b), Chen and Zhang (1998), Halliwell, Heaney, and Sawicki (1999) and Gaunt (2004) use intercept analysis and adjustedR-square analysis to examine the fit of the Fama and French three- factor model in many international stock markets finding strong empirical support for the three-factor model over domestic single-factor CAPM models.
1.2. Momentum Four-Factor Model Theory and Tests
Jegadeesh and Titman (1993) find that abnormal returns derived from momentum strategies are not fully priced by the three-factor Fama and
French model. However, part of the abnormal returns generated in the first year after portfolio formation dissipates during the following two years.
Carhart (1997)builds onJegadeesh and Titman (1993)to study persistence in mutual fund performance during 1962–1993.
Carhart adds a one year momentum factor – calculated as the difference between portfolio returns for the highest 30% and lowest 30% momentum stocks – to the Fama and French three-factor model and forms a momentum-based four-factor model to explain mutual fund returns.
ri;t ¼ai;tþmi;tMT Btþsi;tSMBtþhi;tHMLtþpi;tPR1YRt1þi;t (2) where PR1YRt1 is the difference between the returns on portfolios of highest 30% and lowest 30% momentum stocks for the prior year and pi;t ¼asset or portfolioi’s regression coefficients forPR1YRt1 and the rest of the variables are the same as the three-factor model in Eq. (1).
Carhart sorts firms into deciles based on high to low portfolio returns to create a return-based factor. Carhart compares the performance of the CAPM to both the Fama and French three-factor model and the momentum four-factor model. Carhart (1997) finds that incorporating momentum as a fourth factor is important for explaining equity mutual funds average returns and risk-adjusted returns: ‘‘In tests not reported, I find that the four-factor model substantially improves on the average pricing errors of the CAPM and the three-factor model,’’ (Carhart, 1997, p. 62). Carhart finds that his momentum four-factor model provides additional explanatory power for up to one year after portfolio formation.
1.3. Financial Distress Theory and Tests
Dichev (1998, p. 1146) notes that several authors (Chan, Chen, & Hsieh, 1985;Fama & French, 1992) suggest that the size and book to market effects might be proxying for a firm distress risk factor.1 Consequently, Dichev explicitly studies bankruptcy risk in NYSE, AMEX, and NASDAQ stocks from 1981 to 1995, comparingAltman’s (1968)Z-score andOhlson’s (1980) O-score measures. Dichev (1998, p. 2317) finds ‘‘bankruptcy risk is not rewarded by higher returns. Thus a distress factor is unlikely to account for the size and book-to-market effects.’’ Dichev finds that firms with high bankruptcy risk earn substantially lower than average returns since 1980 with either measure and that Ohlson’s model displays a stronger negative association between bankruptcy risk and subsequent returns.
Griffin and Lemmon (2002)test portfolio pricing of financial distress with a three-factor Fama and French model using the same samples and time period asFama and French (1998). Griffin and Lemmon examine the U.S.
stock market based on five quintiles of financial distress risk usingOhlson’s (1980) measure of distress risk, termed O-score. Using buy-and-hold returns, Griffin and Lemmon find that value portfolios outperform growth portfolios and that high O-scores are positively related to stock returns.
The difference in stock returns for firms with the highest risk of distress is twice as large for high BE/ME securities relative to low BE/ME securities compared to other groups (Griffin and Lemmon, 2002, p. 2334).
In summary,Griffin and Lemmon (2002)find that the Fama and French three-factor model explains the returns more completely if the financial distress of the firms is further classified.2 Griffin and Lemmon (2002, p. 2317) find that ‘‘Among firms with the highest distress risk as proxied by Ohlson’s (1980) O-score, the difference in returns between high and low book-to-market securities is more than twice as large as that in other firms.
This large return differential cannot be explained by the three-factor model or by differences in economic fundamentals.’’ These findings suggest that the market does not fully impound available financial distress information into market prices.3
Campbell et al. (2008) examine financial distress risk in the U.S. stock market as a predictor of asset prices. They construct an empirical monthly index for each company with accounting and market-pricing variables.
Alphas for three-factor Fama and French and four-factor Carhart regressions indicate that distressed stocks have very low returns, particularly after correcting for risk using the Fama and French three-factor model.
They investigate many explanations for apparent underperformance of distressed stocks or ‘‘the distress anomaly’’ (p. 2923).
2. RESEARCH METHODOLOGY
We investigate usingGriffin and Lemmon’s (2002)financial distress results by proposing a fourth empirical systematic risk factor in the Fama and French (1993) model in place of the prior-one-year momentum factor suggested by Carhart (1997) who incorporated the Jegadeesh and Titman (1993)momentum findings into theFama and French (1993)empirical asset pricing model.Griffin and Lemmon (2002)suggest that the financial distress risk of a firm has a significant impact on the rate of return so we add a fourth aggregate factor, the financial distress risk factor, OLMH, to the
Fama and French three-factor model to test the structure of factors influencing small and large value and growth stock returns in Japan and the United States. Our model is
ri;t ¼ai;tþmi;tMT Btþsi;tSMBtþhi;tHMLtþoi;tOLMHtþi;t (3) where all variables are the same as the Fama and French variables presented in Eq. (1) plus an additional variable. We add a financial distress risk premium,OLMHt which equals the value-weighted average rate of return difference between the portfolio containing the lowest 20% O-score firms and the portfolio containing the highest 20% O-score firms. The coefficient oi;tis the coefficient for asset iin periodt.
2.1. Data and Period of Study
To get independent results from Griffin and Lemmon (2002), we include only recent (1991–2006) data for the two largest developed country stock markets: the United States and Japan. Our data overlaps Griffin and Lemmon’s 1965–1995 U.S. Compustat and Center for Research in Securities Prices (CRSP) data and includes a separate nation.
Financial distress risk pricing in another developed nation with similar laws, accounting data and reliance on capitalism but with different patterns of trade and industry should reveal the robustness of the financial distress risk factor asset pricing model. Both countries have similar attitudes in using stock markets and debt markets as sources of capital and also toward using capitalism as a mechanism for allocating resources in their economies. Both countries have substantial differences as well. Their national cultures, social structures, political structures and corporate cultures should be reflected in the factors underlying stock market returns.
In particular, corporate management philosophies, workers’ attitudes toward their companies and national tax structures differ enough that size, book-to-market, market risk and financial distress factors should be different between the United States and Japan. Our two nation tests of competing three-factor and four-factor models should have enough similarities and differences in the common risk factors to reveal differences in asset pricing for these two markets.
2.1.1. Stock Returns
Our daily returns sample is drawn from non-financial public Datastream firms in the United States and Japan for both currently trading and defunct
securities.4 We follow Fama and French (1996a, 1996b) and Liew and Vassalou (2000) and exclude financial stocks, insurance stocks, holding companies for securities such as unit trusts and depository receipts, preferred shares, cross listings, warrants, and duplicates. We use July 1991 to June 2006 for the United States Russell 1000 Datastream firms and May 1995 to April 2005 for the Japan Datastream firms. Japanese firms are those listed on the Tokyo or Osaka Stock Exchanges or the Over-the-Counter Securities Exchange for Japan listed in Thomson Financial Datastream (JASDAQ). Closing quotations and the value of each stock are from the Thomson Financial Datastream database. Daily and monthly returns are calculated from the closing quotation adjusted for cash dividends and bonus shares. Additional details are inTable 1.
2.1.2. Accounting Variables
On the basis ofGriffin and Lemmon’s (2002)tests, we use theOhlson (1980) O-score as a proxy for the risk of financial distress. Because O-score is calculated using accounting variables from annual financial statements, we allow up to a six-month lag for firms to publish the statements, following the approach taken inFama and French (1992)and subsequent literature.
We gather Thomson Financial accounting statement data from July 1991 to June 2006 for the United States and from May 1995 to April 2005 for Japan, respectively. We eliminate firms with a negative BE/ME when we use BE/ME as a factor to classify stocks.
2.2. Financial Distress Factor
We classify stocks into value stocks and growth stocks assuming that BE/ME is an adequate proxy, following Chan and Chen (1991), Chan, Hamao, and Lakonishok (1991),Chan, Jegadeesh, and Lakonishok (1995), Lakonishok et al. (1994) and Chan and Lakonishok (2004) who suggest that the explanatory ability of BE/ME for the rate of return is very robust.
Following Griffin and Lemmon (2002), we sort stocks into three BE/ME groups: the lowest 30% (growth stocks), the middle 40% (blended), and the highest 30% (value stocks). If the ratio of the book value of equity to the market value of equity is low, the firm’s future is favorable relative to its historical cost and so is defined as a ‘‘growth stock.’’5On the contrary, if the ratio is high, it is a ‘‘value stock.’’
Table 1. Portfolio Classifications and Variable Definitions.
Portfolio Classifications
Annually, all firms are grouped into 15 portfolios in the United States and 15 portfolios in Japan. The top row represents three groupings of individual firm book-to-market-equity (BE/ME) ratios. Group L is the lowest 30% and represents the growth firms. Group M is the middle 40% and represents blended firms (mixture of growth and value). Group H is the highest 30% and represents value firms. The columns partition the probability of financial distress factor, O-score, into five quintile groupings. O-score group LO (low O-score) is the portfolio grouping that contains firms with the lowest 20% of O-score values.
O-score group LO represents the firms with the lowest financial distress risk. O-score groups 2, 3, and 4 are portfolios that contain the firms with the second lowest, third lowest, and fourth lowest O-score values.
O-score group HO (high O-score) is the portfolio grouping that contains firms with the highest quintile O-score values for that year, or the group with the highest financial distress risk. To read the table, the O-score quintiles are broken down into the HML grouping that is appropriate. For example, the cell labeled LLO is a portfolio that has firms with the lowest 30% of BE/ME ratios and lowest O-score quintile for that year. Likewise, the cell labeled L2 represents a portfolio containing the firms with the lowest 30%
of BE/ME ratios for the year and the second lowest O-score quintile. The cell labeled M4 represents a portfolio containing the firms with the middle 40% BE/ME ratio and the fourth lowest O-score quintile grouping. Finally, the cell labeled HHO represents a portfolio containing the firms with the highest BE/ME ratio and the highest O-scale quintile.
O-Score BE/ME HML Portfolios
L M H
O-score portfolios LO LLO MLO HLO
2 L2 M2 H2
3 L3 M3 H3
4 L4 M4 H4
HO LHO MHO HHO
Notes:To create size groupings, we sort the firms within each of the fifteen 15 U.S. portfolios and within the fifteen 15 Japanese portfolios by size. We create 30 portfolios for each country by grouping the firms that are greater than the median size (large firms) within a portfolio.
The remaining firms are the small firms in each portfolio, respectively.
We measure each variable as follows:
1. Rate of return. Stock rights and dividends are adjusted on ex-rights days and ex-dividend days to create daily multipliers and daily returns, but we do not reinvest cash dividends. We calculate the monthly and annual rates of return with each respective accumulated multiplier from the daily rates of return.
2. Risk-free rate. For the U.S. risk-free rate, we use the treasury bill rate. For the Japanese risk- free rate, we use the commercial paper rate.
3. Market portfolio return. We follow Fama and French’s (1992, 1993) methodology of excluding financial and security companies in market portfolio return calculations. We use either the rate of return for firms included in the United States Russell 1000 index (United States sample) or the rate of return for all firms traded in Japan (Japan sample).
4. Book-to-market equity (BE/ME). Book equity of common stock equals total shareholder’s equity of the firm minus the amount of preferred stock. Market value of the common stock equals the closing quotation multiplied by the number of outstanding common shares.
BE/ME is calculated by dividing the book equity by the market value.
5. Size. Size, or the market value of the stock, is calculated by multiplying the closing quotation of the stock on the last transaction day of the year by the number of outstanding shares.
2.2.1. Financial Distress in the United States
Ohlson (1980)uses a logit model to construct a financial alarm model that we use as our proxy for the likelihood of financial distress. To develop the model, Ohlson chooses 105 bankrupt company stocks and 2,058 non- bankrupt stocks from both NYSE/AMEX and OTC firms. All sample firms are in the manufacturing industry and are selected from 1970 to 1976.
He applies nine financial variables to estimate a logit model to predict the probability of financial distress.
Ohlson’s logistic regression model is shown as follows (Ohlson, 1980, pp. 118, 121):
Oscoret¼
1:320:407SIZEtþ6:03TLT At1:43WCT At
þ0:0757CLCAt2:37NIT At1:83FUT Lt þ0:285INTW Ot1:72OENEGt0:521CHI Nt
8>
<
>: (4)
where SIZEt ¼ln (total assets/GNP price-level index); TLT At ¼total liabilities/total assets; WCT At¼working capital/total assets; CLCAt¼ current liabilities/current assets; NIT At ¼net income/total assets;
FUT Lt¼funds provided by operations/total liabilities; INTW Ot¼1, if net income is negative for the last two years, zero if otherwise;
OENEGt¼1, if total liabilities exceeds total assets, zero if otherwise;
andCHI Nt¼ ðNItNIt1Þ=ðjNItj þ jNIt1jÞ, where NItis net income for the most recent period.
For the U.S. stock markets, we calculate annual O-score values using Ohlson’s original parameter estimates.6A higher probability of bankruptcy represents a lower quality firm, implying that the probability of bankruptcy for stocks with high financial distress risk (high O-score) is higher.
For stocks with low financial distress risk (low O-score), the probability of bankruptcy is low.
2.2.2. Financial Distress in Japan
To obtain the economy-wide estimates for the probability of financial distress risk in Japan, we estimate Japanese parameters for the logistic model with the same explanatory variables and approach taken byOhlson (1980), but with our 1995 to 2005 Japanese accounting data. We use annual data for all financially distressed Japanese firms and for all normal Japanese firms listed in the Datastream database to estimate the Japanese equivalent logistic regression parameters.
Our estimates for the Ohlson logistic model’s parameters for Japan are:
OscoreðJapanÞt ¼
0:0220:053SIZEt2:653TLT At1:707WCT At 2:738CLCAtþ4:369NIT Atþ2:102FUT Lt
þ0:065INTW Ot0:211OENEGtþ0:712CHI Nt 8>
<
>:
(5) where the accounting variables have the same definitions as those in Eq. (4).
Our O-score (Japan) financial distress model’s estimated parameters are different from the U.S. O-score model parameters, demonstrating the differences in the U.S. economy and Japanese economy. However, the Japanese model’s parameter estimates are similar in size to U.S. parameters, demonstrating the similarities in pricing financial distress with accounting variables in the two economies. When we constrain the Japanese O-score logistic model estimates to be the same as the U.S. O-score estimates (results not presented), we reject the null hypothesis of similarity at the 0.001 level.
We use the O-score (Japan) model’s estimates to calculate an annual Japanese O-score for each Japanese firm in our sample for each year. The yearly Japanese O-score financial distress probability uses each Japanese firm’s accounting data, similar to the procedure used for the U.S. firms.
For all the Japanese tests conducted in the rest of the chapter, we use the firm-specific Japanese O-scores calculated using our estimated O-score (Japan) parameters.7
2.3. O-Score and HML Portfolio Groupings
We investigate the fit of three competing stock market return generating processes for both the U.S. sample and the Japanese sample using a similar firm portfolios approach used inFama and French (1993, 1998)andGriffin and Lemmon (2002). We form 15 portfolios of firms (in each country) that are similar in (a) their magnitude of financial distress and (b) BE/ME.
First, we sort all non-financial firms by their previous year’s O-scores into five quintile groups from the smallest to the largest in each of our samples.8 The five quintile O-score groupings are labeled LO (low O-score), 2, 3, 4, and HO (high O-score). The high O-score (HO) group has the high probability for a firm to suffer financial distress compared to any of the other groups and the low O-score (LO) group indicates the low probability for a firm to suffer financial distress relative to the other groups.
Second, we further partition each of the five O-score quintile’s sample according to their previous year’s BE/ME ratio. We assign the firms into one of three HML portfolios: the highest 30% of values are assigned to a portfolio termed H (value), the middle 40% of values to a portfolio labeled M (blended), and the lowest 30% of values to a portfolio labeled L (growth).
Combining our annual O-score groupings with our annual HML (BE/ME) groupings, we classify all firms into one of fifteen portfolios as listed in Table 1for each of the two countries for each year.
For our initial buy-and-hold analysis, we buy and hold each of the 15 portfolios for a year and calculate the annual return on investment for each equally weighted portfolio. We resort and reclassify portfolios annually.
We compare the rates of return between high and low HML groups for each O-score group and between high and low O-score groups for each HML group.
Because of the unknown characteristics of the middle HML group (usually termed blended stocks, denoted by M in our tables), we do not overemphasize this group but report all test results for completeness of the analysis.
2.4. Regression Model Analysis of Fama and French-Type Three- and Four-Factor Models
In each country, we employ ordinary least squares (OLS) monthly time- series regressions to test the explanatory power of the three asset pricing models. First, we use the parameter estimates for the Fama and French model (Eq. 1) variables – MTB, SMB, and HML – to estimate the goodness of fit. Second, we useCarhart’s (1997)momentum four-factor model (Eq. 2) that adds momentum, in the form of a factor labeled PR1YR, to the three- factor model. We compare its explanatory power relative to the Fama and French three-factor model. Third, we use our financial distress four-factor model (Eq. 3) that adds O-score, in the form of a factor labeled OLMH, to the three-factor model. We compare its explanatory power beyond the Fama and French three-factor model to explain monthly stock returns.
3. EMPIRICAL RESULTS AND ANALYSIS
3.1. O-Score, Book-to-Market Equity, and Returns
To separately examine the relationship between BE/ME and O-scores, we classify portfolios into three groups based on BE/ME, in each of the five
O-score quintiles as described earlier and summarized in Table 1. Tables 2 and 3 present summary statistics for the stocks in each portfolio in the United States and Japan, respectively.9 Within the quintiles of O-score in the United States and in Japan, the probabilities of bankruptcy for the portfolios with low, medium and high BE/ME exhibit a similar pattern from low to high as expected. For the highest quintile of O-score in the United States, however, low BE/ME firms have the highest probability of bankruptcy at 0.51, whereas high BE/ME firms have the lowest probabilities of bankruptcy at 0.49, which are statistically identical. Similarly, for the highest quintile of O-score in Japan, low BE/ME firms have the highest probability of bankruptcy at 0.68 and high BE/ME firms have lowest probabilities of bankruptcy at 0.62, but again the difference is not statistically significant.
The finding of low BE/ME ratios in firms in the highest O-score group in both the United States and Japan is puzzling.Table 2shows that when U.S.
firms in the highest O-score quintile are partitioned into low, middle, and high BE/ME values, the market value of the lowest BE/ME grouping is much larger than the market value of the firms in the highest BE/ME grouping ($31.5 million market value compared to $6.5 million market value, respectively).
However, the puzzle of low BE/ME firms in the highest quintile is explained when further analyzed. For all O-score quintiles,Table 2reveals a finding of a pattern of much higher market values for all low BE/ME firms relative to high BE/ME firms. In addition, within the low, middle, and high BE/ME groupings, the average market value of firms increases with the level of financial distress indicated by its O-score quintile. Table 3reveals very similar patterns for Japan.
Among all low BE/ME stocks in the United States, the second to highest O-score firms have smaller 12-month prior returns and the smallest 36-month prior returns. For both the United States and Japan, high BE/ME firms have monotonically decreasing prior 12-month average returns across increasing O-score quintile, but the prior 36-month average returns share this pattern only for the lowest four O-score quintiles.
Comparing the lowest O-score quintile to the highest O-score quintile for each country reveals higher 12-month and 36-month returns for LO firms than for HO firms for all three BE/ME categories.
Table 2 reveals that return on assets is negative for the highest O-score quintile across BE/ME categories in the United States, resulting in a decline in retained earnings growth for that quintile. This is consistent with high financial distress as proxied by the O-score quintile. Table 3 reveals
Table 2. Summary Statistics of Firm Characteristics for United States Portfolios: Sorted by BE/ME and the Probability of Financial Distress.
O-Score Portfolios
Book-to-Market-Equity Portfolios: L (Growth); M (Blended); H (Value) O-score average (probability) BE/ME average (ratio) Number of firms per year
L M H L M H L M H
LO 0.16 0.16 0.16 0.1531 0.3637 0.8033 49 51 50
2 0.20 0.21 0.21 0.1677 0.3610 0.8881 49 51 50
3 0.23 0.23 0.25 0.1715 0.3606 0.8827 49 51 50
4 0.27 0.28 0.31 0.1736 0.3567 1.1193 50 51 50
HO 0.51 0.47 0.49 0.1487 0.3562 0.8543 52 51 50
Prior 12-month average return (%)
Prior 36-month average return (%)
Retained earnings growth (%)
L M H L M H L M H
LO 66.00 37.00 30.00 159.00 198.00 177.00 0.3649 0.0271 0.2367 2 31.00 22.00 21.00 130.00 106.00 118.00 0.3541 1.6463 0.4335 3 24.00 21.00 13.00 73.00 89.00 83.00 0.2614 0.1626 0.1203
4 15.00 15.00 9.00 59.00 71.00 69.00 0.1879 0.0756 0.0446
HO 30.00 17.00 5.00 112.00 103.00 94.00 0.08841.21420.9035 Market value
average ($ millions)
Market leverage average (ratio)
Return on assets average (%)
L M H L M H L M H
LO 6,092.54 3,380.51 2,106.22 1.6295 1.5323 1.8075 11.18 7.13 5.09 2 7,601.46 3,391.64 2,352.19 1.4383 1.2232 1.5408 11.85 7.91 5.50 3 13,887.48 5,778.58 3,758.85 1.9428 1.3033 1.7447 11.65 7.60 4.57 4 40,472.71 12,480.44 6,595.52 2.0414 1.6772 1.9849 10.34 5.50 2.53 HO 31,507.00 18,665.96 6,517.33 8.1212 1.9450 2.0328 6.40 1.60 5.14 Notes: Firms included in the Russell 1000 index from July 1991 to June 2006 are ranked independently based on their values of financial distress (O-score) calculated usingOhlson’s (1980)model and book-to-market-equity (BE/ME) as described inTable 1. Prior 12-month stock returns are percentages of equal-weighted buy-and-hold returns from July to June in the year prior to ranking. The 36-month prior stock returns are equal-weighted buy-and-hold returns from July three years ago to June in the year of ranking. Growth in retained earnings is the percentage change in retained earnings on the balance sheet over the year before ranking.
Market capitalization is the market value of firm. Leverage is the ratio of total book assets less book equity to-market equity. Return on assets is the ratio of income before extraordinary items to total book assets.
Table 3. Summary Statistics of Firm Characteristics for Japan Portfolios: Sorted by BE/ME and the Probability of Financial Distress.
O-Score Portfolios
Book-to-Market-Equity Portfolios: L (Growth); M (Blended); H (Value) O-score average
(probability)
BE/ME average (ratio) Number of firms per year
L M H L M H L M H
LO 0.26 0.28 0.29 0.237 0.848 3.532 218 292 221
2 0.37 0.36 0.37 0.233 0.878 3.153 223 298 223
3 0.45 0.41 0.43 0.169 0.877 8.298 223 298 223
4 0.53 0.47 0.50 0.144 0.908 28.044 223 298 223
HO 0.68 0.59 0.62 0.064 0.904 35.665 224 298 223
Prior 12-month return average (%)
Prior 36-month average (%)
Retained earnings growth (%)
L M H L M H L M H
LO 24.0 11.4 12.0 31.2 25.2 23.6 0.51 0.15 0.10
2 18.5 07.7 7.8 8.0 13.7 19.0 0.20 0.00 0.84
3 15.0 14.6 6.9 6.9 21.3 31.8 0.11 0.07 0.09
4 16.0 9.8 5.8 11.2 22.5 30.6 0.12 0.39 0.67
HO 5.2 5.9 2.8 12.5 14.4 15.4 0.48 0.28 0.36
Market value average ($ millions)
Market leverage average ratio
Return on assets average %
L M H L M H L M H
LO 13,687.00 225.00 21.00 0.17 0.75 1.68 1.4 1.7 00.0
2 32,820.00 224.00 32.00 0.43 0.84 2.19 2.5 2.4 0.5
3 46,021.00 149.00 31.00 0.57 1.42 10.71 2.6 2.3 0.3
4 65,963.00 111.00 32.00 1.78 2.34 37.46 0.2 1.3 0.6
HO 65,471.00 132.00 30.00 1.34 4.83 30.50 6.6 0.2 2.7
Notes:Firms in Japan from May 1995 to April 2005 are ranked independently based on their values of financial distress (O-score) calculated using our Japanese parameter estimates for Ohlson’s (1980)model and book-to-market-equity (BE/ME) as discussed in Table 1. Prior 12-month stock returns are percentages of equal-weighted buy-and-hold returns from May to April in the year prior to ranking. The 36-month prior stock returns are equal-weighted buy- and-hold returns from May three years ago to April in the year of ranking. Growth in retained earnings is the percentage change in retained earnings on the balance sheet over the year prior to ranking. Market capitalization is the market value of firm. Leverage is the ratio of total book assets less book equity to market equity. Return on assets is the ratio of income before extraordinary items to total book assets.
a different pattern in Japan, showing that all high BE/ME firms have low return on assets, with three quintiles showing negative return on assets.
Interestingly, the average percentage growth in retained earnings patterns does not match the average percentage return on assets patterns across O-score quintiles and BE/ME portfolio types for Japan, indicating potential differences in accounting practices in the two countries.
Within the low BE/ME quintile in the United States, retained earnings growth in the year before ranking is the smallest for the highest O-score firms. For the United States, the prior 12-month return and the return on assets are consistent indicators of firm financial performance across O-score quintiles in high BE/ME firms. The higher a firm’s financial distress quintiles, the lower are the return on assets, growth in retained earnings, and prior 12-month return. Interestingly, the prior 36-month stock market return average displays a similar pattern. Taken together, these findings indicate that the negative shocks to book equity may explain the low BE/ME ratios of these firms in the United States.
To further examine whether O-score and BE/ME are both related to distress risk, we report summary market leverage statistics inTables 2 and 3.
Market leverage, measured as the ratio of the book value of liabilities to the market value of equity, is positively related to both O-score and BE/ME for Japan but is positively related to O-score only for the United States.
Both O-score and BE/ME are negatively related to return on assets, and positively related to leverage, which is consistent with the view that both O-score and BE/ME are related to distress risk.
When we compute the Spearman rank correlations between O-score and BE/ME, we find a value of 0.054 and 0.0046 in the United States and in the Japanese stock markets, respectively. These results suggest that O-score contains information related to distress risk that the BE/ME ratio does not capture. If the BE/ME ratio and O-score both capture unique information related to the financial distress risk factor, both O-score and BE/ME should be considered in pricing stock returns.
3.2. Summary Statistics for Sales and Investment Ratios for Portfolios Tables 4 and 5 show the percentage of growth in sales of the low BE/ME portfolios is larger than that of high BE/ME portfolios in the United States and Japan, respectively. The sales-to-book assets ratio of the low BE/ME portfolios is higher than that of the high BE/ME portfolio. The median market value of equity to sales ratio of the low BE/ME portfolios is higher
than that of high BE/ME portfolios in the United States and Japan, which is consistent withGriffin and Lemmon’s (2002)evidence that investors favor the firms with high market equity to sales ratios than those with lower market equity to sales levels. The capital expenditure-to-asset ratio in the portfolio with low BE/ME (growth firms) is lower than portfolio with higher BE/ME (either blended or value firms).
We conclude that these data show low BE/ME portfolios perform well relative to high BE/ME portfolios. Griffin and Lemmon (2002) point out that investors may overreact to the information about the future growth potential of firms with low BE/ME. Their findings suggest that investors are anticipating improving sales growth and profitability of those future sales for firms with low BE/ME relative to firms with high BE/ME.
Table 4. Sales and Investments Ratio Medians For United States Portfolios: Sorted by BE/ME and the Probability of Financial Distress.
O-Score Portfolios
Book-to-Market-Equity Portfolios: L (Growth); M (Blended); H (Value) Median growth in sales (percentage) Median sales/book assets (ratio)
L M H L M H
LO 39.40 24.89 22.97 1.2800 1.1718 1.2069
2 25.00 17.78 13.40 1.3543 1.3208 1.1480
3 16.86 11.70 12.14 1.2016 1.1983 1.0460
4 12.00 9.90 6.94 1.1037 1.0890 0.7960
HO 61.19 92.16 29.34 0.8030 0.8183 0.7830
Median capital expenditure/book assets (ratio)
Median market value/sales (ratio)
L M H L M H
LO 0.0358 1.6020 0.7497 6.5890 1.6020 0.7497
2 0.0399 1.4245 0.8290 4.2200 1.4245 0.8290
3 0.0312 1.5315 0.8449 3.9680 1.5315 0.8449
4 0.0276 1.8406 1.0950 4.0880 1.8406 1.0950
HO 0.0289 5.3841 1.1530 7.0014 5.3841 1.1530
Notes: Firms included in the Russell 1000 index from July 1991 to June 2006 are ranked independently based on their values of financial distress (O-score) calculated usingOhlson’s (1980)model and book-to-market-equity (BE/ME) as described in Table 1. We report the median of growth in sales, sales to book asset, market value of equity to sales, and capital expenditures to book assets.
3.3. Buy-and-Hold Returns for the Portfolios Sorted on BE/ME and O-Score
To investigate whether return differences captured by partitioning firms into the three BE/ME portfolios and the five O-score quintiles are significant, Tables 6 and 7 display the annual buy-and-hold returns and the return differences for all firms in the United States and Japan, respectively.
Furthermore, we report the return differences captured by high versus low BE/ME portfolios and high versus low O-score deciles for small and large firms, respectively10. We partition stocks in the United States and Japan into 15 portfolios. These portfolios are the three sizes of BE/ME (lowest 30%, middle 40%, and highest 30%) within each of the five O-score quintiles calculated for the respective countries. Furthermore, we partition each of the 15 portfolios of all firms into two sub-portfolios based on their market
Table 5. Sales and Investments Ratio Medians For Japan Portfolios:
Sorted by BE/ME and the Probability of Financial Distress.
O-Score Portfolios
Book-to-Market-Equity Portfolios: L (Growth); M (Blended); H (Value) Median growth in sales (percentage) Median sales/book assets (ratio)
L M H L M H
LO 25.0 4.2 1.0 0.830 0.907 0.900
2 52.6 4.8 1.2 0.868 1.053 1.057
3 5.9 8.9 0.1 0.850 1.125 1.102
4 3.6 7.7 1.1 0.759 1.135 1.138
HO 9.4 2.1 4.3 0.584 1.160 1.903
Median capital expenditure/book assets (ratio)
Median market value/sales (ratio)
L M H L M H
LO 0.001 0.005 0.007 1.069 0.837 0.316
2 0.002 0.002 0.001 2.198 0.710 0.266
3 0.002 0.004 0.003 4.976 0.621 0.225
4 0.011 0.004 0.002 5.857 0.480 0.177
HO 0.020 0.007 0.003 8.379 0.379 0.145
Notes:Japanese firms from 1995 to 2006 are ranked independently based on their values of the probability of financial distress (O-score) calculated usingOhlson’s (1980)model and book-to- market-equity (BE/ME). We report the median of growth in sales, sales to book assets, market value of equity to sales and capital expenditures to book assets.
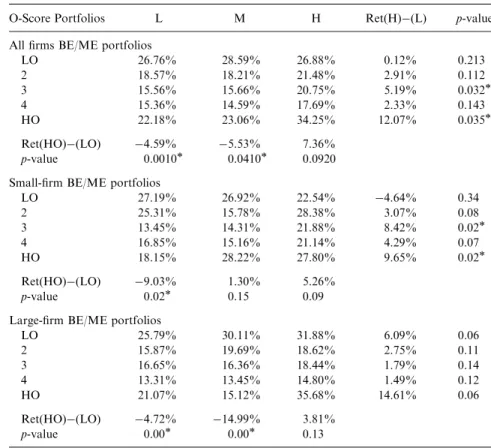
Table 6. Average Annual Buy-and-Hold Returns for Size Portfolios in the United States: Sorted by BE/ME and the Probability of
Financial Distress.
O-Score Portfolios L M H Ret(H)(L) p-value
All firms BE/ME portfolios
LO 26.76% 28.59% 26.88% 0.12% 0.213
2 18.57% 18.21% 21.48% 2.91% 0.112
3 15.56% 15.66% 20.75% 5.19% 0.032
4 15.36% 14.59% 17.69% 2.33% 0.143
HO 22.18% 23.06% 34.25% 12.07% 0.035
Ret(HO)(LO) 4.59% 5.53% 7.36%
p-value 0.0010
0.0410
0.0920 Small-firm BE/ME portfolios
LO 27.19% 26.92% 22.54% 4.64% 0.34
2 25.31% 15.78% 28.38% 3.07% 0.08
3 13.45% 14.31% 21.88% 8.42% 0.02
4 16.85% 15.16% 21.14% 4.29% 0.07
HO 18.15% 28.22% 27.80% 9.65% 0.02
Ret(HO)(LO) 9.03% 1.30% 5.26%
p-value 0.02 0.15 0.09
Large-firm BE/ME portfolios
LO 25.79% 30.11% 31.88% 6.09% 0.06
2 15.87% 19.69% 18.62% 2.75% 0.11
3 16.65% 16.36% 18.44% 1.79% 0.14
4 13.31% 13.45% 14.80% 1.49% 0.12
HO 21.07% 15.12% 35.68% 14.61% 0.06
Ret(HO)(LO) 4.72% 14.99% 3.81%
p-value 0.00
0.00
0.13
Notes:Percentage value-weighted annual buy-and-hold returns for firms in the United States from July 1991 to June 2006 are displayed for portfolios formed by ranking with probabilities of financial distress (O-score) calculated usingOhlson’s (1980)model and book-to-market-equity (BE/ME). Stocks are ranked into three groups by size (all stocks, small stocks, and large stocks). Size-adjusted groupings are a simple average of the large and small time series. The tests for statistical differences between groups are based on the time series of monthly returns from July 1991 to June 2006. The high minus low BE/ME portfolio differences are calculated within the same distress groups by forming a portfolio that is long in the high BE/ME portfolio and short in the low BE/ME portfolio. Differences in financial distress portfolio returns are calculated from high distress portfolios minus low distress portfolios within each BE/ME grouping.
Statistical significance at the 0.05 level separately.
Table 7. Average Annual Buy-and-Hold Returns for Size Portfolios in Japan: Sorted by BE/ME and the Probability of Financial Distress.
O-Score Portfolios L M H Ret(H)(L) p-value
All firms BE/ME portfolios
LO 0.72% 6.62% 12.42% 13.14% 0.084 2 2.19% 0.91% 14.68% 16.87% 0.072 3 1.44% 1.13% 26.49% 27.93% 0.067
4 0.78% 6.07% 14.60% 13.81% 0.044
HO 12.28% 3.82% 12.32% 24.60% 0.004
Ret(HO)(LO) 11.57% 2.80% 0.10%
p-value 0.067 0.311 0.494
Small firms
LO 1.41% 3.34% 15.84% 14.43% 0.090
2 6.90% 1.58% 19.51% 26.40% 0.043
3 5.81% 3.51% 45.27% 39.47% 0.103
4 8.92% 9.16% 15.03% 6.11% 0.231
HO 9.41% 3.54% 12.54% 21.95% 0.098
Ret(HO)(LO) 10.82% 0.19% 3.30%
p-value 0.069 0.488 0.285
Large firms
LO 2.84% 9.89% 9.00% 11.85% 0.259
2 2.51% 3.39% 9.85% 7.33% 0.249
3 8.69% 1.25% 7.71% 16.40% 0.031 4 7.35% 2.98% 14.17% 21.52% 0.020 HO 15.16% 4.09% 12.10% 27.25% 0.003
Ret(HO)(LO) 12.31% 5.79% 3.09%
p-value 0.157 0.269 0.395
Notes:Percentage value-weighted annual buy-and-hold returns for firms in Japan from May 1995 to April 2005 are displayed for portfolios formed by ranking with probabilities of financial distress (O-score) calculated usingOhlson’s (1980)model and book-to-market-equity (BE/ME).
Stocks are ranked into three groups by size (all stocks, small stocks, and large stocks). The size- adjusted groupings are from a simple average of the large and small time series. The tests for statistical differences between groups are based on the time series of monthly returns from May 1995 to April 2005. The high minus low BE/ME portfolio differences are calculated within the same distress groups by forming a portfolio that is long in the high BE/ME portfolio and short in the low BE/ME portfolio. Similarly, differences in financial distress portfolio returns are calculated using returns from high-distress portfolios minus low-distress portfolios within each BE/ME grouping.
Statistical significance at the 0.05 level separately.
capitalization (small and large) given the importance of the size factor in the Fama and French three-factor model and in our results inTables 2 and 3.
We find that a book-to-market effect exists for buy-and-hold portfolios across O-score quintiles in the U.S. and Japanese stock markets. Table 6 shows differences at the 5% significance level in annual buy-and- hold returns for high BE/ME portfolios versus low BE/ME portfolios and within two of the five O-score quintiles for all the U.S. firms.Table 7shows differences within two of the five O-score quintiles for all Japanese firms.
Table 6 displays the average annual size-adjusted percentage returns differentials for all firms between the U.S. portfolios with high BE/ME ratios versus firms with low BE/ME ratios. The returns of the high BE/ME minus the low BE/ME portfolios are significantly different for O-score quintile portfolio 3, at 5.19%, and the O-score quintile HO at 12.07%, but not for the other three quintiles.
The all-firms portfolio tests are further partitioned into the small and larger firms within each of the 15 portfolios. For the United States, the returns differences are clearly due to the small firms, which have an 8.42%
difference for O-score quintile 3 and a 9.65% difference for O-score quintile HO. All other small-firm U.S. O-score quintile differences between high BE/ME portfolios and low BE/ME portfolios are not statistically signifi- cantly different from zero. No large-firm O-score quintile differences are statistically significantly different from zero for the U.S. firms.
Table 7 displays that the returns differential due to the book-to-market effect is significant in the all-Japanese firms’ portfolios in O-score quintile 4 at 13.81% and in O-score quintile HO at 24.60%. When partitioned into small and large Japanese firms, we find that the small-firm O-score quintile 2 high BE/ME versus low BE/ME return difference is statistically significantly at 26.4% and that the large-firm O-score quintiles have high BE/ME return differences of 16.4%, 21.52% and 27.25% in O-score quintiles 3, 4, and HO, respectively.
An O-score effect, or financial distress effect, is noticeable in the United States buy and hold evidence but not in the Japanese evidence. Table 6 shows the returns of the high O-score quintile portfolio, HO, minus the returns of the low O-score quintile portfolio, LO, for the all-firms portfolio grouping shows a statistically significant difference of4.59% and5.53%
in the low BE/ME portfolios (growth) and the middle BE/ME portfolios (blended firms), but no statistical difference in the high BE/ME (value) portfolios, for the United States. For U.S. small firms, the high financial distress O-score quintile, HO, earns 9.03% less for the low BE/ME portfolio but the high-minus-low O-score differences are not significant for the
blended or the value portfolios. For U.S. large firms, the high financial distress O-score quintile, HO, earns 4.72% less for the low BE/ME portfolios (growth) and 14.99% less for the middle (blended) portfolio but is not significant for the value portfolio. For Japan, Table 7 shows that although we observe the same patterns of lower returns for high financial distress portfolios, HO, compared to low financial distress portfolios, LO, especially for low BE/ME portfolios, the differences are not statistically significant at the 5% level.
Our findings for the U.S. market are consistent with Dichev’s (1998) evidence that the firms with low distress risk can earn higher average stock returns than firms with higher financial distress risk. However, the high stock returns occur for the portfolio with high BE/ME (value stocks) in the highest O-score quintile (high financial distress, HO) for large firms, consistent with the firms having higher financial distress risk. Similarly, for Japan, higher stock returns are observed for the Japanese portfolios with high BE/ME ratios (value stocks) compared to portfolios with low BE/ME ratios (growth stocks) across O-score quintiles for all firms, small firms, and large firms.
3.4.Fama-and-French (1993)Three-Factor Model – Monthly Data Tests Although the buy-and-hold return data for average portfolio returns is interesting, an important question investigated in the literature that explores Fama and French’s (1993) asset pricing model is whether individual stock returns depend on common factors. We wish to test the goodness of fit of the three alternative asset pricing models in Eqs. (1)–(3). For each country, we would like to test the fit of the three models inside each of the 30 portfolios formed based on a firm’s financial distress O-score, relative BE/ME, and relative size.
As discussed previously, each U.S. firm is classified into one of fifteen portfolios: five relative O-score quintiles, ranging from low financial distress to high financial distress, and three relative BE/ME classifications, ranging from low BE/ME (growth) to middle BE/ME (blended) to high BE/ME (value). These 15 portfolios are examined in Tables 2 and 4. Next, we partition each of the 15 all-firms portfolios into small firms (smallest half ) and large firms (largest half) for a total of 30 portfolios. These are the same 30 sub-portfolios used inTable 6and discussed in the previous section.
Similarly for Japanese firms, we partition them into 15 similar portfolios:
five relative O-score quintiles and three relative BE/ME classifications, using the same methods discussed earlier. These 15 portfolios are examined in
Tables 3 and 5. We then partition each of the 15 Japanese all-firms portfolios into small firms and large firms for a total of 30 portfolios. These are the same 30 sub-portfolios used inTable 7, discussed earlier.
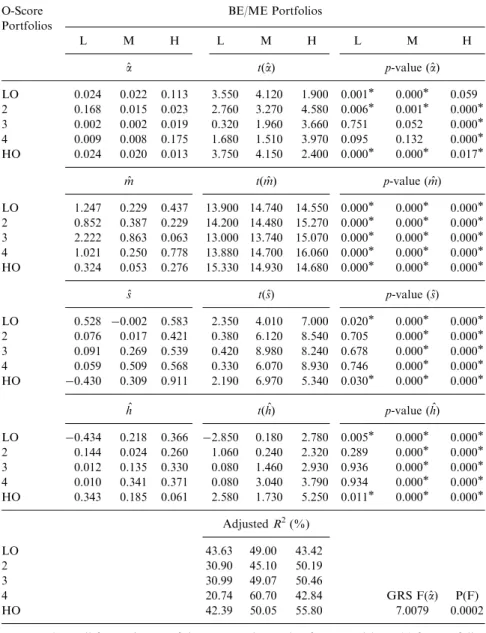
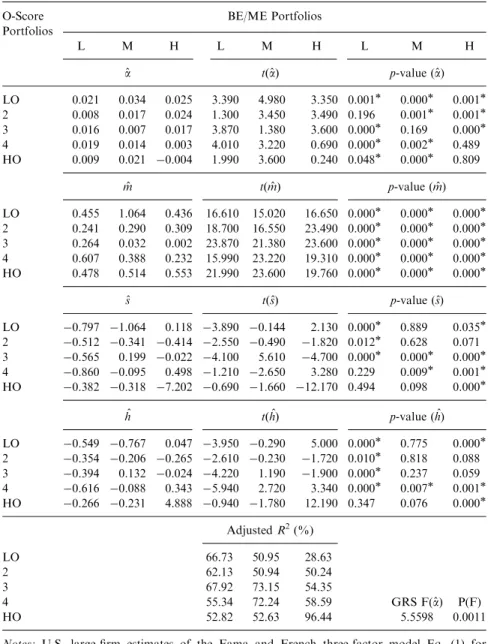
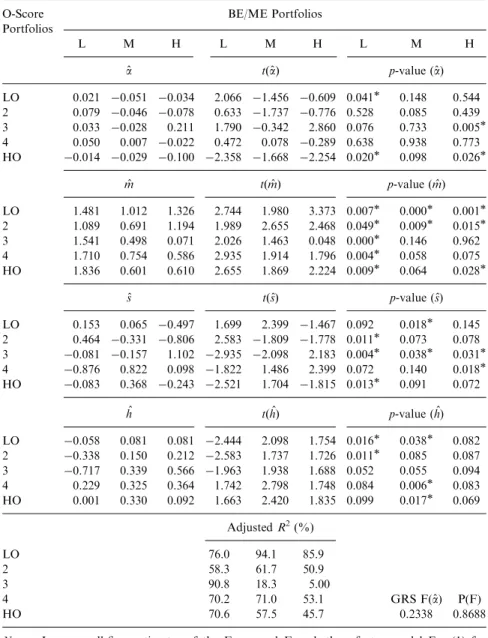
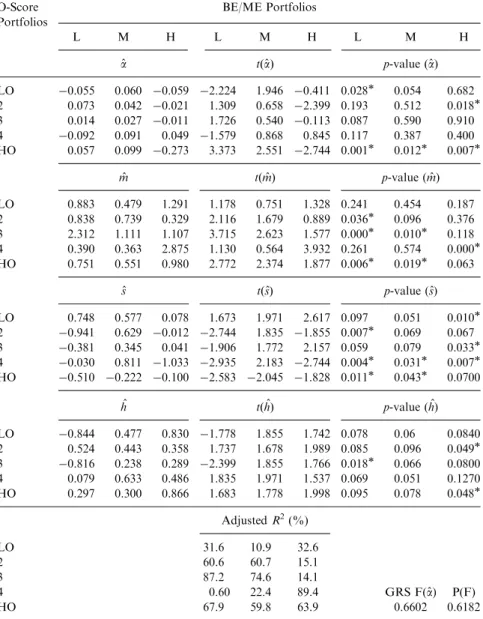
First, we investigate how the three-factor model of Fama and French (1993)performs in its ability to explain the 30 portfolio returns in the United States and the 30 portfolio returns in Japan. InTable 8through Table 11, we exhibit estimated regression coefficients and regression statistics for the portfolios in each BE/ME, O-score, and size group in the United States and Japan.11
For the United States,Tables 8 and 9 show that the coefficients of the market factor, MTB, are positive for all 15 small-firm portfolios and all 15 large-firm portfolios. The coefficients of the small-minus-big factor, SMB, for twelve of the small-firm portfolios and nine of the large-firm portfolios are significantly different from zero at a 5% significance level.
The coefficients of the book-to-market factor, HML, for 12 of the small-firm portfolios and eight of the large-firm portfolios are significantly different from zero. One of the small-firm portfolios and four of the large- firm portfolios have significantly negative HML coefficients. Furthermore, we find most coefficients of the book-to-market factor, HML, increase monotonically as firms move from low to high book-to-market ratio, with the exception of high O-score small firms, which is reversed.
InTables 8 and 9, the adjustedR-square in the United States is higher than 40% for most of the portfolios and greater than 50% for 14 of the large-firm portfolios. For 10 of the 15 small-firm portfolios and 11 of the 15 large- firm portfolios, the intercepts are significantly different from zero, indicating that the Fama and French three-factor model does not price stock returns completely in the United States. The Gibbons, Ross, and Shanken (GRS) (1989) test of the alpha are both significant, indicating rejection of the null hypothesis that all of the alpha coefficients are equal to zero for U.S. small firms (Table 8) and U.S. large firms (Table 9), allowing some room for improvement.
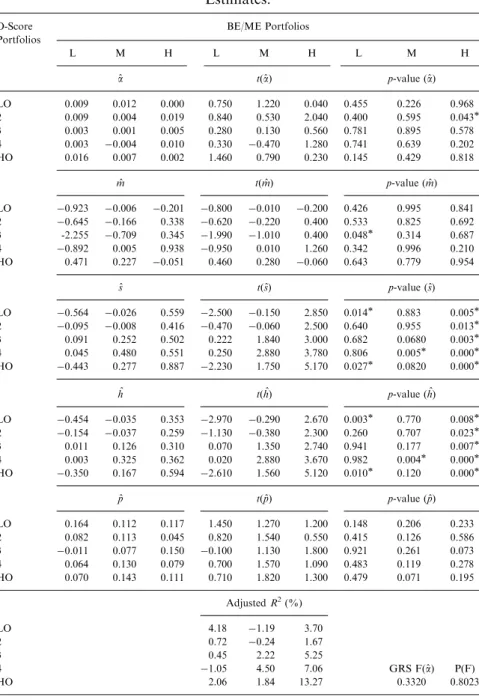
Tables 10 and 11show that 16 of the 30 coefficients of the market-to-book factor (MTB), 15 of the 30 coefficients of the size factor (SMB), and 8 of the 30 coefficients of the BE/ME factor (HML) are significantly different from zero for small and large firms in the Japanese stock market.
In addition, for Japanese firms, 11 of the 15 small-firm portfolio intercepts and 10 of the 15 large-firm portfolio intercepts arenotsignificantly different from zero indicating a very good fit for the Fama and French three-factor model. Likewise, the GRS test is not significant for both groups of portfolios (failing to reject the Fama and French model’s fit). In addition,