IONA College IONA College
Operations Operations Management Management
MBA-540 MBA-540
Jerry Fjermestad
Operations Operations Management Management
Operations and Operations and
Productivity Productivity
Chapter 1
Chapter 1
Outline Outline
Global company profile: Whirlpool
What is Operations Management?
The heritage of Operations Management
Why study OM?
What Operations Managers do
How this book is organized
Organizing to produce goods and services
Where are the OM jobs?
Exciting new trends in Operations
Management
Outline - Continued Outline - Continued
Operations in the service sector
Differences between goods and services
Growth of services
Service pay
The Productivity challenge
Productivity measurement
Productivity variables
Productivity and the Service Sector
The challenge of social responsibility
Learning Objectives Learning Objectives
When you complete this chapter, you should be able to :
Identify or Define:
Production and productivity
Operations Management (OM)
What operations managers do
Services
Learning Objectives - Learning Objectives -
continued continued
When you complete this chapter, you should be able to :
Describe or Explain:
A brief history of operations management
Career opportunities in operations management
The future of the discipline
Measuring productivity
Whirlpool Whirlpool
Change in attitude - employees “live quality”
Training - “use your heads as well as your hands”
Flexible work rules
Gain-sharing
Global procurement
Role of information/information technology
Adoption of a Worldwide strategy
What Is Operations What Is Operations
Management?
Management?
Operations management is the set of activities that creates
goods and services by
transforming inputs into outputs
Production is the creation of
goods and services
The Heritage of The Heritage of
Operations Operations Management Management
Division of labor (Adam Smith 1776 and Charles Babbage 1852) Standardized parts (Whitney 1800)
Scientific Management (Taylor 1881)
Coordinated assembly line (Ford, Sorenson/Avery 1913) Gantt charts (Gantt 1916)
Motion study (Frank and Lillian Gilbreth 1922 Quality control (Shewhart 1924;
Deming 1950)
Computer (Atanasoff 1938)
CPM/PERT (DuPont 1957)
The Heritage of The Heritage of
Operations Management Operations Management
- continued - continued
Material requirements planning (Orlicky 1960) Computer aided design (CAD 1970)
Flexible manufacturing system (FMS 1975) Baldrige Quality Awards (1980)
Computer integrated manufacturing (1990) Globalization(
1992) Internet
(1995)
Eli Whitney Eli Whitney
Born 1765; died 1825
In 1798, received
government contract to make 10,000
muskets
Showed that machine tools could make
standardized parts to exact specifications
Musket parts could be
© 1995 Corel Corp.
Frederick W. Taylor Frederick W. Taylor
Born 1856; died 1915
Known as ‘father of
scientific management’
In 1881, as chief engineer for Midvale Steel, studied how tasks were done
Began first time & motion studies
Created efficiency
principles
© 1995 Corel Corp.Taylor: Management Taylor: Management
Should Take More Should Take More
Responsibility for Responsibility for
Matching employees to right job
Providing the proper training
Providing proper work methods and tools
Establishing legitimate incentives
for work to be accomplished
Frank & Lillian Gilbreth Frank & Lillian Gilbreth
Frank (1868-1924);
Lillian (1878-1972)
Husband-and-wife engineering team
Further developed work measurement methods
Applied efficiency
methods to their home
& 12 children!
(Book & Movie:
“Cheaper by the
Dozen,” book: “Bells
on Their Toes”
© 1995 Corel Corp. Born 1863; died 1947
In 1903, created Ford Motor Company
In 1913, first used
moving assembly line to make Model T
Unfinished product moved by conveyor past work station
Paid workers very well for 1911 ($5/day!)
Henry Ford Henry Ford
‘Make ‘
them all alike!’
© 1995 Corel Corp.
W. Edwards Deming W. Edwards Deming
Born 1900; died 1993
Engineer & physicist
Credited with teaching Japan quality control methods in post-WW2
Used statistics to analyze process
His methods involve
workers in decisions
Contributions From Contributions From
Human factors
Industrial engineering
Management science
Biological science
Physical sciences
Information science
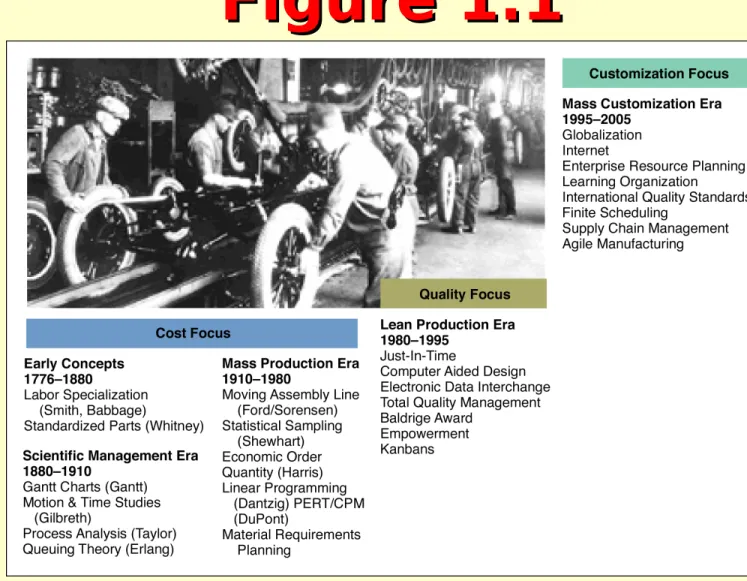
Figure 1.1
Figure 1.1
Significant Events in Significant Events in
OM OM
Division of labor (Smith, 1776)
Standardized parts (Whitney, 1800)
Scientific management (Taylor, 1881)
Coordinated assembly line (Ford 1913)
Gantt charts (Gantt, 1916)
Motion study (the Gilbreths, 1922)
Quality control (Shewhart, 1924)
Significant Events - Significant Events -
Continued Continued
CPM/PERT (Dupont, 1957)
MRP (Orlicky, 1960)
CAD
Flexible manufacturing systems (FMS)
Manufacturing automation protocol (MAP)
Computer integrated manufacturing
(CIM)
Why Study OM?
Why Study OM?
OM is one of three major functions (marketing, finance, and
operations) of any organization
We want (and need) to know how goods and services are produced
We want to know what operations managers do
OM is such a costly part of an
organization
Options for Increasing Options for Increasing
Contribution Contribution
Marketing
Option Finance &
Accounting Option
OM Option
Current Sales Revenue :
+50%
Finance
Costs: -50% Production Costs: -20%
Sales $100,000 $150,000 $100,000 $100,000 Cost of
Goods Sold -80,000 -120,000 -80,000 -64,000 Gross
Margin 20,000 30,000 20,000 36,000
Finance
Costs -6,000 -6,000 -3,000 -6,000
14,000 24,000 17,000 30,000 Taxes @
25% -3,500 -6,000 -4,250 -7,500
Contribution 10,500 18,000 12,750 22,500
What Operations What Operations
Managers Do Managers Do
Plan
Organize
Staff
Lead
Control
Ten Critical Decisions Ten Critical Decisions
Service, product design………
Quality management…………..
Process, capacity design…….
Location ……….…………..
Layout design ……….
Human resources, job design.
Supply-chain management…..
Inventory management ……….
Scheduling ………..
Maintenance ………...
Ch. 5
Ch. 6, 6S Ch. 7, 7S Ch. 8
Ch. 9
Ch. 10, 10S Ch. 11
Ch. 12, 12S, 14
Ch. 13, 15,
16
The Critical Decisions The Critical Decisions
Quality management
Who is responsible for quality?
How do we define quality?
Service and product design
What product or service should we offer?
How should we design these
products and services?
The Critical Decisions - The Critical Decisions -
Continued Continued
Process and capacity design
What processes will these products require and in what order?
What equipment and technology is necessary for these processes?
Location
Where should we put the facility
On what criteria should we base this
location decision?
The Critical Decisions - The Critical Decisions -
Continued Continued
Layout design
How should we arrange the facility?
How large a facility is required?
Human resources and job design
How do we provide a reasonable work environment?
How much can we expect our
employees to produce?
The Critical Decisions - The Critical Decisions -
Continued Continued
Supply chain management
Should we make or buy this item?
Who are our good suppliers and how many should we have?
Inventory, material requirements planning, JIT “just-in-time”
inventory,
How much inventory of each item should we have?
When do we re-order?
The Critical Decisions - The Critical Decisions -
Continued Continued
Intermediate, short term, and project scheduling
Is subcontracting production a good idea?
Are we better off keeping people on the payroll during slowdowns?
Maintenance
Who is responsible for maintenance?
Organizational Organizational
Functions Functions
Marketing
Gets
customers
Operations
creates product or service
Finance/Accounting
Obtains funds
Tracks money
Functions - Bank Functions - Bank
Operations Finance/
Accounting Marketing
Check Clearing Teller
Scheduling
Transactions
Processing Security
Commercial Bank
© 1984-1994 T/Maker Co.
Functions - Airline Functions - Airline
Operations Finance/
Accounting Marketing
Ground Support Flight
Operations
Facility
Maintenance Catering
Airline
© 1984-1994 T/Maker Co.
Functions - Functions - Manufacturer Manufacturer
Operations Finance/
Accounting Marketing
Production Control
Manufacturing Quality
Control Purchasing
Manufacturing
Organizational Charts Organizational Charts
Commercial Bank
Operation s
Teller
Scheduling Check
Clearing
Transactions processing Facilities
design/layou t
Vault
operations
Finance
Investme nts
Security Real
Estate Account ing
Auditin g
Marketing Loans
Commercial Industrial Financial Personal Mortgage
Trust
Department
PowerPoint Presentation to accompany Operations Management, 6E (Heizer &
© 2001 by Prentice Hall, Inc., Upper Saddle River, N.J. 07458
1-35
Organizational Charts Organizational Charts
Airline Operations
Ground support equipment
Maintenance Ground
Operations Facility
maintenance Catering Flight
Operations Crew
scheduling Flying
Communications Dispatching
Finance &
Accounting
Accounting Payables
Receivables General
Ledger Finance
Cash control International exchange
Marketing
Traffic
administratio n
Reservations Schedules Tariffs
(pricing) Sales
Advertising
PowerPoint Presentation to accompany Operations Management, 6E (Heizer &
Render)
© 2001 by Prentice Hall, Inc., Upper Saddle River, N.J. 07458
1-36
Organizational Charts Organizational Charts
Manufacturin
Operations g
Facilities:
Construction:maintenance
Production & inventory control Scheduling: materials control
Supply-chain management Manufacturing
Tooling, fabrication,assembly
Design
Product development and design Detailed product specifications
Industrial engineering
Efficient use of machines, space, and personnel
Process analysis
Development and installation of production tools and equipment
Finance &
Accounting
Disbursements/
credits
Receivables Payables General ledger
Funds
Management Money
market
International exchange
Capital
requirements Stock issue
Marketi ng
Sales promoti ons
Advertis ing
Sales
Market
research
Where Are the OM Where Are the OM
Jobs?
Jobs?
Technology/methods
Facilities/space utilization
Strategic issues
Response time
People/team development
Customer service
Quality
Cost reduction
Inventory reduction
Productivity improvement
New Challenges in OM New Challenges in OM
Local or national focus
Batch shipments
Low bid purchasing
Lengthy product development
Standard products
Job specialization
Global focus
Just-in-time
Supply chain partnering
Rapid product development, alliances
Mass
customization
Empowered
employees, teams
From From To To
Changing Challenges Changing Challenges
for the Operations for the Operations
Manager Manager
Past Causes Future
Local or national focus
Low-cost, reliable
worldwide communication and transportation
networks
Global Focus
Batch (large) shipments
Cost of capital puts pressure on reducing investment in inventory
Just-in-time shipments
Low-bid
purchasing Quality emphasis requires that suppliers be engaged in product improvement
Supply-chain partners
Changing Challenges Changing Challenges
for the Operations for the Operations
Manager Manager
Past Causes Future
Lengthy product
development
Shorter life cycles, rapid international
communications, computer- aided design, and
international collaboration
Rapid product development
Standardized
products Affl uence and worldwide
markets; increasingly flexible production processes
Mass customization
Job specialization Changing sociocultural milieu. Increasingly a
knowledge and information society.
Empowered
employees, teams,
and lean production
Characteristics of Characteristics of
Goods Goods
Tangible product
Consistent
product definition
Production
usually separate from
consumption
Can be
inventoried
Low customer
interaction
© 1995 Corel Corp.Characteristics of Characteristics of
Service Service
Intangible product
Produced & consumed at same time
Often unique
High customer interaction
Inconsistent product definition
Often knowledge-based
Frequently dispersed
© 1995 Corel Corp.
Goods Versus Services Goods Versus Services
Can be resold
Can be
inventoried
Some aspects of quality
measurable
Selling is distinct from production
Reselling unusual
Difficult to inventory
Quality difficult to measure
Selling is part of service
Goods Goods Service
Service
Goods Versus Services Goods Versus Services
- Continued - Continued
Product is
transportable
Site of facility
important for cost
Often easy to automate
Revenue generated
primarily from tangible product
Provider, not product is
transportable
Site of facility important for
customer contact
Often difficult to automate
Revenue generated
primarily from
intangible service.
Goods Goods Service
Service
Goods Contain Services Goods Contain Services
& Services Contain
& Services Contain Goods
Goods
0 25 50 75 100 25
75 50 100
Automobile Computer
Installed Carpeting Fast-food Meal
Restaurant Meal Auto Repair
Hospital Care
Advertising Agency
Investment Management Consulting Service
Counseling
Percent of Product that is a Good Percent of Product that is a Service
1850 75 1900 25 50 75 2000 40 50 60 70 1970 75 80 85 90 95 2000 Percent
United States Canada
France Italy Britain Japan
W Germany 1970
1991 Services
Industry
Farming
250 200 150 100 50 0
80
%70 60 50 40 30 20 10 0
U.S. Employment, %
Share Services as a Percent of GDP
U.S. Exports of Services In Billions of Dollars
Year 2000 data is estimated
Development of the Development of the
Service Economy
Service Economy
The Economic System The Economic System
Transforms Inputs to Transforms Inputs to
Outputs Outputs
The economic
system transforms inputs to outputs at about an annual
1.7% increase in
productivity (capital 38% of 1.7%), labor (10% of 1.7%),
management (52%
of 1.7%) Land,
Labor, Capital, Managem ent
Goods and
Services
Feedback loop
Inpu ts
Process Outputs
Whirlpool Whirlpool
Parts per man hour
95 100 105 110 115
1989 1990 1991
Cost per unit of a spin pinion
$1.50
$1.75
$2.00
$2.25
1989 1990 1991
Average worker's annual cash compensation
24000 25000 26000 27000
1989 1990 1991
Productivity improved Costs were pared
Wages increased
Measure of process improvement
Represents output relative to input
Productivity increases improve standard of living
From 1889 to 1973, U.S.
productivity increased at a 2.5%
annual rate
Productivity Productivity
Productivity Productivity Productivity
Productivity Units Units Units Units produced produced produced produced Input used Input used Input used Input used
= = =
=
Productivity Variables Productivity Variables
Productivity =
Output
Labor + material + energy + capital
+ miscellaneous
Measurement Problems Measurement Problems
Quality may change while the quantity of inputs and outputs remains constant
External elements may cause an increase or decrease in
productivity
Precise units of measure may
be lacking
Productivity Variables Productivity Variables
Labor - contributes about 10%
of the annual increase
Capital - contributes about 32% of the annual increase
Management - contributes
about 52% of the annual
increase
Key Variables for Key Variables for
Improved Labor Improved Labor
Productivity Productivity
Basic education appropriate for the labor force
Diet of the labor force
Social overhead that makes labor available
Maintaining and enhancing skills
in the midst of rapidly changing
technology and knowledge
Jobs in the U.S Jobs in the U.S
26%
18%
16%
14%
6%
6% 5% 5%
3% 1%
Education, Health, etc.
Manufacturing Retail Trade
State & Local Gov't Finance, Insurance Wholesale Trade
Transport, Public Util.
Construction
Federal Government
Mining
Productivity Growth Productivity Growth
1971- 1992 1971- 1992
0 0.5 1 1.5 2 2.5 3 3.5 4 4.5 5
United States West Germany Japan
Whole Manufacturin
% p e r y e a r
Labo Labo
r r
Growth Rate of Labor Growth Rate of Labor
Productivity Productivity
0 2 4 6
0 2 4 6 8 10 12
Growth Rate of Gross Capital Per Worker (%)
U.S.
U.K.
W Germany France Japan 1964-84 1979-84
G ro w th R a te o f L a b o r P ro d u c ti v it y (% )
Comparison of Comparison of
Productivity Productivity
United States, Japan, United States, Japan,
Germany Germany
France
*Japan
*Italy Britain
*Germany
†Canada U.S.
Labor Productivity Growth (percent)
0 2 4 6 8
1960 - 1973 1973 - 1995
*