The automotive industry is and will remain one of the world's key industries. I would like to thank Giancarlo Genta, professor at the Polytechnic of Turin and responsible for the automotive engineering course, for his commitment to the internationalization of the courses at this faculty.
Historical Outlines in the Automotive Industry
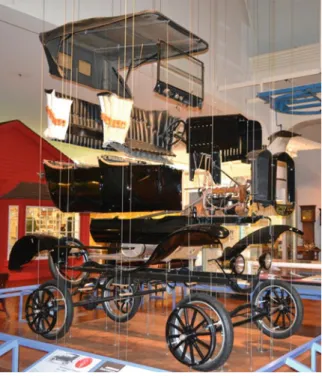
It was in the first decade of the last century that the first touring cars were built; This same privilege would become the weak point of Ford's strategy going forward.
Strategic Planning of Production Activities
In the following we will discuss criteria applied for setting up and managing production processes that are much more deeply related to the development of companies' competitiveness and their environmental and energy-related sustainability. The development cycle of a new productds with the start of production and commercial launch in the market.
Process Integration and ‘‘Make or Buy’’ Decision-Making
Items (m) for the Decision to ‘‘Make’’
GIVE PRODUCTION TO EXTERNAL SUPPLIERS Making a choice or buying determines the level of verticalization of the company's production process.
Items (b) for the Decision to ‘‘Buy’’
Items (c) for the Decision for ‘‘Co-Makership’’
The "degree of verticalization" of a company's manufacturing activities is represented by this ratio: total cost of internal production processes/total cost of non-factory sales products. North American and Japanese plants generally have a small degree of verticalization, despite the example of those in Europe.
Manufacturing Systems Set-Up and Location Criteria
Equipment Level and the Defining
For each product family, the necessary production levels (maximum quantity for a year and a day) and the level of flexibility for the production mix models are defined, based on information derived from the product range plan and sales forecasts. In relation to the production capacities required and to the best economic solutions for the processes, a "manufacturing engineering plan" is derived, from which equipment and specific tooling choices are made.
Overview of Technologies for Materials Applied
Requirements for material characteristics and construction have a major influence on the economic convenience of the process and the quality of the end product. The degree of technical characteristics of the tool and the use of equipment affect the economic convenience of the process and the quality of the final product.
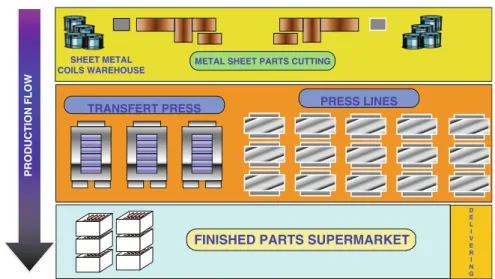
Sketches for Manufacturing Systems Adopted
Both basic investments (presses) and specific ones (moulds) are very high; therefore, it is very important to ensure the overall efficiency of the best production systems. For components for the safety of vehicle movement, it is mandatory to ensure the traceability of the supplied batches, which ensures the responsibility of the manufacturers.
Systems’ Strategic Prerogatives
In a certain "system" there is a relationship that allows the introduction of new products simply by changing special tools and changing software for automating processes. In this situation, the "system" can be realized step by step, according to the regulatory plan, with the possibility of adjusting the investment amount according to the actual level of production required during production.
Standardization Logic and Project Set-Up
For the techno-economic part of the project, a specific value/cost analysis activity is performed for each item of the PMS. In the follow-up design for the implementation phase of the project, it is also necessary to ensure consistency with points 2, 3, 4 and 5 above.
Industrialization Process Description
According to best practices in the automotive industry, it is possible to develop a new car model already equipped with available engines and transmissions to achieve a ``time-to-market'' of less than twenty-four or a maximum of twenty-eight months, depending on the product's technical complexity. In the case of a new solution for the engine or space frame, the above ''time-to-market'' may turn out to be a few months longer, due to the necessity of a very careful testing phase to ensure the reliability of the new product and obtaining technical approvals (as a result of stricter restrictions).
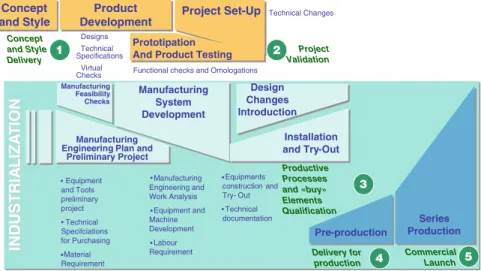
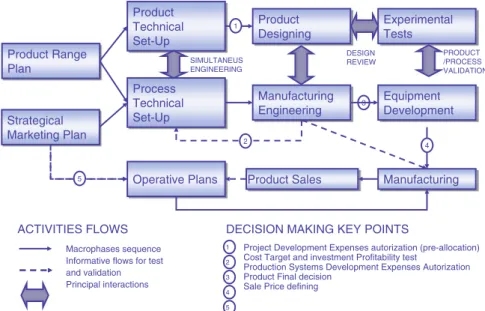
Product/Process Information Technology System
Figure 2.7 represents the "best practices" flow of the time sequence that occurs from project setup and industrialization to the definition and codification of product structure and production capability. The difference between the actual consumption of raw materials and the standard requirement is due to losses caused by process errors and production scrap.
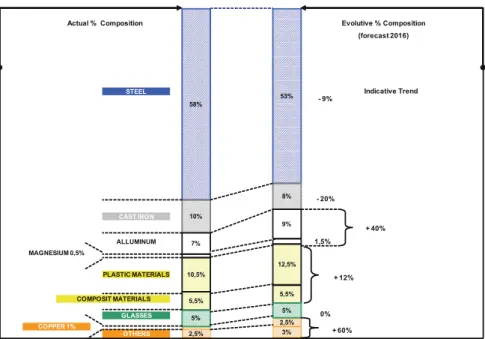
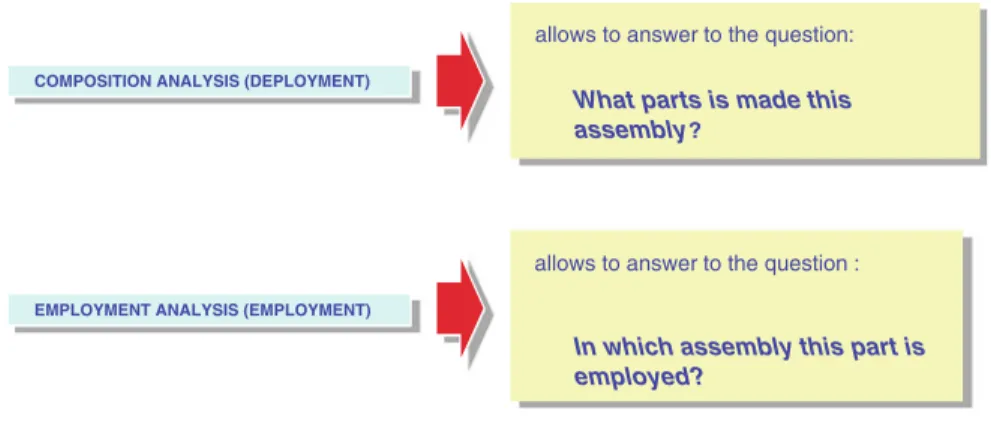
Product Composition Analysis
The above compositional analysis is important, first of all, to verify the completeness of the designs and their aggregation as a whole, also to check the correlation between the PBS and the analytical product macrostructure.
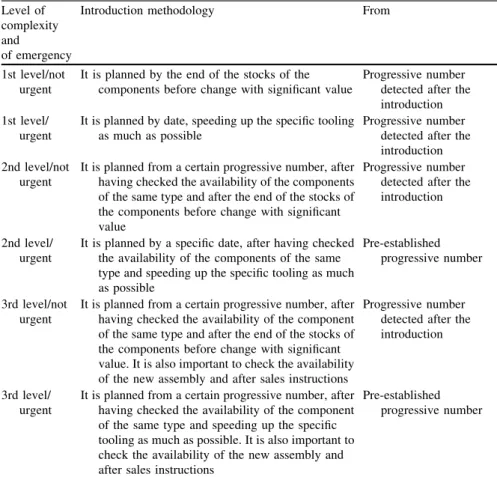
Management of Technical Changes
It is planned at the end of the stocks of the components before change with significant value. It is also important to check the availability of the new assembly and the after-sales manual.
Manufacturing Engineering Planning and Executive Project
Manufacturing Engineering Plan Study
The manufacturing engineering plan then leads to the preliminary project and the provision of standard solutions (technical specifications book) necessary to purchase equipment, machine tools and tooling. This information is fundamental for the planning of economic initiatives, extensive technical data and the specifications book for the purchase of equipment and tools.
Executive Project
For quick and efficient implementation of the above manufacturing engineering plan, it is necessary to prepare a database containing basic data and standard solutions. Based on the above, project documentation of specific tools and equipment is defined and installed, and the manufacturing process is developed.
Production Capacity Setting
WCT determines the productive flow rate represented by "hourly virtual production": HVP = 60•k/WCT, where k is the number of items produced for each work cycle. SUUT) is the unavailability of standard time for production due to a single periodic operation setting (i);.
Working Time Analysis Methodologies
It is necessary that the analyst has a thorough understanding of the functions and roles of the observed employees. To this end, it is also important to analyze interactions between different departments operating in the same organizational process.
Man–Machine Interaction and Standard Working
SPCn is standard production capacity in relation to product series n, referring to the considered working time. We define ``Standard Time'' STn as labor hours strictly necessary to manufacture a specific product series n, based on assigned operating cycles.
Equipment Utilization Analysis
PUT (in hours) = WCT•QP/60•k = productive up-time, referring to working time used for production, where QP is the amount of elements produced;. OEE = PUT/EWT = overall equipment efficiency. or global equipment effectiveness), where EWT is the working time used to produce amount of QP;.
Introduction of Integrated Production Systems
For complex "systems", with a high level of automation, it is important that this information technology collects and transmits net data to a dedicated information technology center, distinguishing events caused by technical failures from those that result from normal auxiliary operations, rather than caused by machine users. The concept of an "integrated production unit" results from the attribution of management responsibility to a single manager, who has the cooperation of a "cross-functional team" composed of experts and the support of information technologies.
Operative Productivity and Flexibility
Equipment and Machine Loading
It is important to note that the above criteria for production capacity planning allow the execution of all programs, ensuring the most appropriate distribution of workload among the different productive units/factories, taking into account the available resources. In this way, the daily and weekly work shifts are planned for the execution of the production plan.
Defining Installed Productive Capacity
It should be taken into account that, for each technological process, productive flow speed is characterized by a maximum sustainable threshold level. Once the Takt time is set, it is more effective to maintain it in as stable a state as possible to consolidate production system standards and achieve the best level of performance.
Activity Level and Labour Efficiency
Labour Efficiency Analysis
Let's define HDL as the total amount of direct labor man-hours collected by the information technology system in the productive units. The plant information technology system is normally set up to extend this data automatically for each of the productive units and in time to enable corrective actions.
Manpower Planning
Indirect Labour Requirement
In addition to direct labor, production management requires other workers to be considered in manpower requirements; these workers are associated with ancillary activities that are not specifically included in standard operating procedures (indirect work). DAV is the developed volume of activity, in the considered time period and in the same production unit, measured in standard working hours and quantified according to the assessment of production progress.
Operative Plan and Staff Balancing: Requirements
If D % shows a temporary surplus in personnel – according to the medium-term operational plan – it is possible to proportionally reduce the monthly working hours, managing compensations throughout the year. 3.8, we also want to remind the reader that the setting of labor demand should be calibrated according to the production capacities of the "technical system", looking for the most suitable rotation of work shifts during a week.
Working Time Length and Flexibility
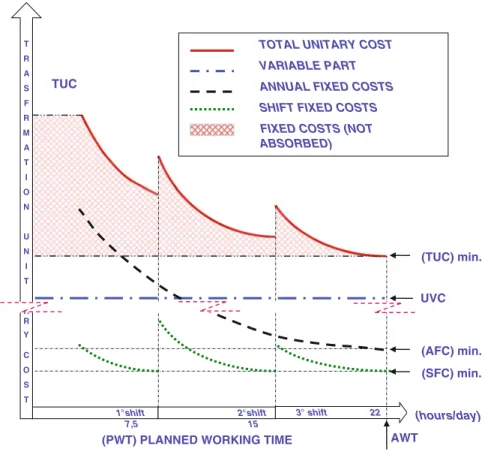
In order to quickly respond to quantitative fluctuations (total volume of products) in customer demand, a certain flexibility of working hours is required, adjusting and refining weekly activity levels while taking into account the monthly operational plan. It is possible to have a minimum of 14 hours to a maximum of 18 hours of full equipment operation per day (corresponding to seven or nine working hours per shift).
Labour Productivity and Improvement Plans
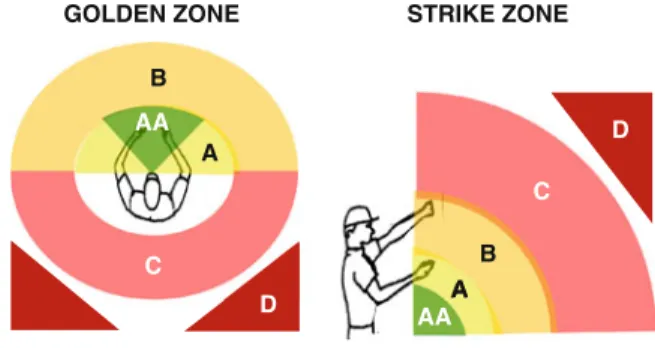
AA All items can be delivered to the assembly point within line of sight and without changing the height of the item's supply points. The third factor is the inclusion of indirect labor incidence in because this labor factor does not contribute directly to the value of the final product.
Input Data for Operative Control
By analyzing the nature (positive or negative), the composition and the causes of these variations, both in the predictable phase (the budget) and the final balancing phase, it is possible to understand the economic efficiency of the production process management. In this way, the costs of machinery/equipment are distributed correctly, which clearly shows the negative financial impact of underutilization of production capacity.
Assignment of Tasks and Workload Balance
Considerations on Work Organization for Assembly
An assembly system with a synchronous one-piece flow allows for the allocation of components very close to the workstations, avoiding double handling. In the case study above, when the ''island system'' gives an advantage of 11 % on the required labor Working time (WT), we have the payback point for the large investment required compared to the ''line system''.
Motivation and Rewarding of Employees
This fact is not only due to the opposition of the trade unions, but also to organizational changes that have taken place in the factories. Considering all of the above, it is important to consider that economic groups' reward policies are very useful for the company when they are based on indicators that quantify performance clearly and realistically.
Plant Manufacturing System
This database also includes work tools given on credit to external suppliers, but which are still the property of the company itself. The corresponding amortization plan is generally for the medium term, being linked to the industrial life cycle of single products.
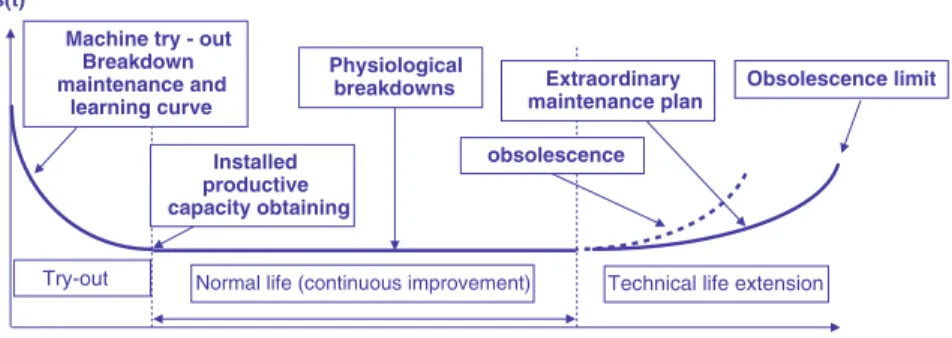
Reliability and Maintainability of Equipment
The statistical data Fn is important for the failure probability and depends on the total reliability of the system. Rt is the reliability of the system Rk is the reliability of the module k K is the number of modules in parallel.
Maintenance Management
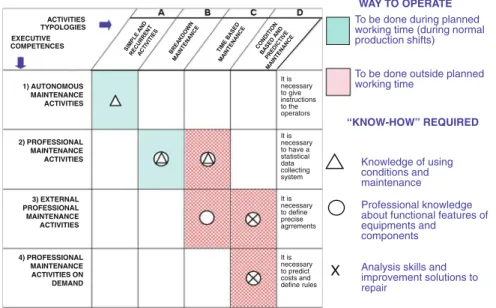
Autonomous Maintenance Activities
With specific reference to point 3 above, it is important to note that since the use of direct labor for indirect labor activities such as maintenance is costing, it is extremely important to determine which professional maintenance activities are convenient to transfer to autonomous maintenance as well from an economic point of view, by balancing costs sustained with benefit achieved. To develop an effective autonomous maintenance system, it is necessary to specifically train production operators, establishing solid involvement and cooperation between maintenance personnel and production workers, sharing the same targets (overall equipment efficiency OEE, operating cost reduction, rejection reduction... ).
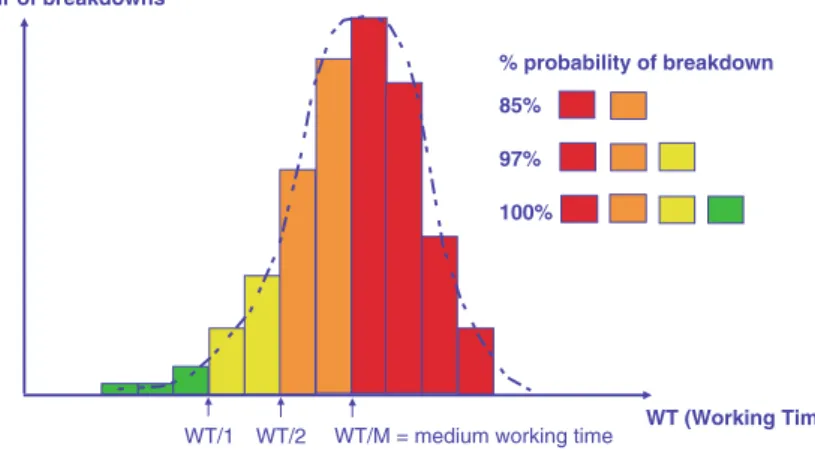
Professional Maintenance Activites
WT/1 intervention period, which prevents 97% of likely failures; in the example shown, this leads to a doubling of the specific maintenance costs compared to the post-failure maintenance strategy. WT/2 intervention period, which prevents 85% of likely failures; in the example shown, this leads to a 25% increase in specific maintenance costs compared to the failure maintenance strategy.
Correlation Between Cost and Maintenance Effectiveness
Breakdown Maintenance Activity Volume
Bi is the total number of breakdowns that occur during the considered working period in the department of failure typology I;.
Preventive Professional Maintenance
Individual Activity Achievable
General and Complementary Equipment for Production
General Services Equipment and Energy
In particular, it is necessary to apply modern systems for heat generated by the recovery of transformation processes and for the recycling of rejected liquid and solid materials. In addition, it should be emphasized that conditioning necessary for the proper functioning of some technological processes and occasionally for the needs of the working environment is a relevant part of energy consumption in automotive plants.
Co-generation Equipment and Electric Energy
In connection with the above-mentioned processes, it is appropriate to adopt energy-saving technological solutions. From the moment when energy sources are by definition "critical", it is appropriate to control the efficiency of the equipment and plan the necessary corrective measures.
Auxiliary Equipment and Exhaust
In the future, the use of photovoltaic panels will be more common, so that solar energy will be used to condition work environments. Operators and those in charge are responsible for ensuring that these rules are followed and that the maintenance and control of this equipment is carried out in accordance with legal requirements.
Tools and Consumables Management
General Criteria
As a consequence, the management of this equipment requires serious attention, both from a cost and legal liability point of view. In the same production system, the cost of consumables is assigned to each product in relation to the work cycle time per unit (WCT/K), or taking into account other parameters (for example, the weight of the products developed in the case of processes metallic).
Tools and Tooling Subject to Quick Usury
Particularly important for cold extrusion processes are: geometric uniformity, heat treatment and regular lubrication of slugs, which enter the stamping process. In the 1990s, many Western enterprises began to study the Toyota Production System as an ideal benchmark.
Historical Evolution of Logistics and Actual Strategies
Actual period: Logistics as an ‘‘Integrated Process’’
However, although much evolution has taken place, the main objective is still to provide materials in the right quantity, in the required quality, at the right point of use, at the right time and at the minimum cost. The reader who is not yet familiar with the criteria of production planning and inventory management is suggested to look at the last section, on basic concepts, at the end of this book.
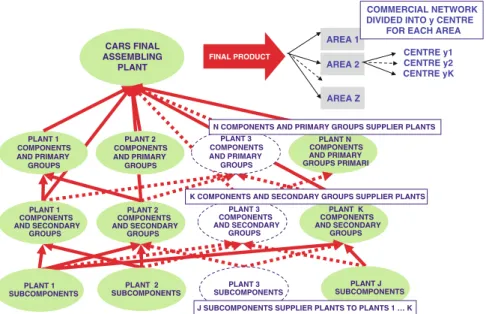
Logistic Flow in the Supply Chain
Final producer plant, or co-producer plants, is at the top of the SC (level 0). This goes in the opposite direction of the physical flow, starting from customer demand for suppliers through various stages of Master Production Scheduling (MPS), Material Requirement Planning (MRP) and Production Scheduling (scheduling), up to the shipment of goods ( shipment).
Material Handling and Inventory Management
The supply flow must correspond to the operational speed of the production process, which is the hourly virtual productivity HVP, referring to each part assembled (k) and to the relative utilization coefficient (u), according to the BOM. Criteria used for inventory management correspond to the logistics mentioned in the "basic concepts" section at the end of this book (deterministic and stochastic/probability methods).
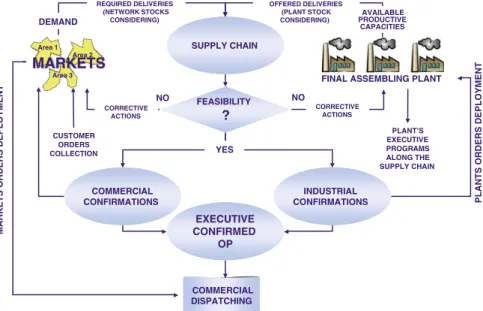
Production and Delivery Planning
This scheme can be very useful for setting up material handling systems in the workshop. In relation to vehicle final assembly plants, in the next section we will describe the information technology systems used to manage production flows.
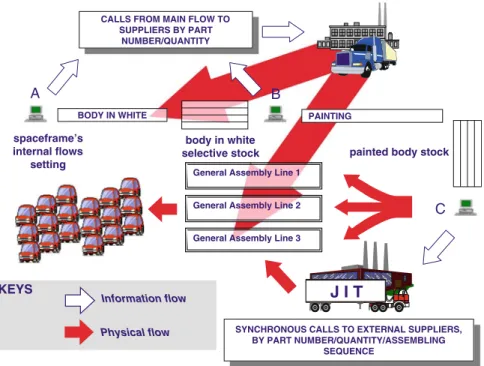
Logistics Information Technology Systems
By proceeding in this way, it is possible to speed up the processing of the OP, according to the monthly rotation system. Let us now consider some aspects related to the information technology systems applied in the production process, with reference to the assembly of the body, and the final assembly of the paint and the vehicle.
Key Performance Indicators of Logistics
- Finished Product Inventory Indicators
- Process Lead Time and Flow Index
- Risk Indicators of Inventory Obsolescence
- Order Execution Lead Time
- Service Level
The Process Lead Time (PLT) corresponds to the process time between the moment when material is directly introduced into the production process (most important is the withdrawal of raw materials or semi-finished products from the warehouse) until the moment when the process is terminated. . Time it takes to enter the order into the production plan, manufacture the product and deliver it to the end customer.
Just in Time Approach
Continuous single-piece flow: The process must be set up so that a single piece moves from one stage of the process to another without interruption of the sequence and without waiting times en route. Pull: production should be carried out in such a way that the products requested by customers are pulled from the end of the assembly process to the input raw materials and semi-finished products by moving the information process into the process.
Role of the Purchasing Department
Technical Purchases Department (authorized to spend), in charge of purchase orders, according to the necessary technical and economic information, in relation to the target of industrial initiatives of competence;. User department (production or technical system manager), in charge of authorizing bill payment after delivery of goods or services provided, corresponding to orders made by the Purchasing department and to the supply plan.
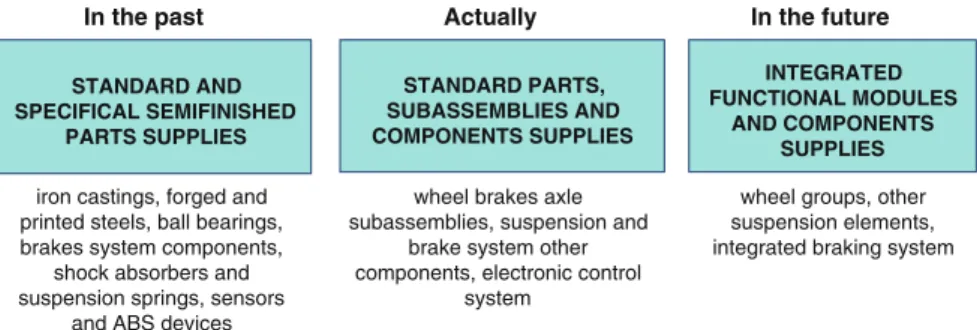
Evolution of Purchasing Policies
Tier 1 suppliers are even more involved as co-producers, separating new model launches from the risks and opportunities of the "car manufacturers". Activate supplies from industrial areas worldwide, based on the logic of the lowest industrial cost Following the development of vehicle manufacturing capacities in strategic markets worldwide.
Purchasing, Marketing and Global Sourcing Policies
Another important topic of purchasing strategy is the globalization of international markets, which is the policy of "global sourcing". These assessments regarding macroeconomic, social and environmental aspects refer not only to the existing situation, but also to the medium-long-term trend.
Management of Suppliers Network
Regarding this second aspect, we must emphasize that the evaluation deals with the "key points" of the industrialization process (see Sect. The basic element for the evaluation of the Buyer/Supplier relationship is the achievement of the new product's targets (cost, quality) , and development lag times).
Order Procedure and Cooperation Agreements
Order issue initiates the information flow for inventory management and accounting that is passed on to the buyer. Modern information technology systems make it possible to automatically match the acknowledgment of receipt (delivery document) with the Supplier's invoice, to be considered anticipation or due date of the same order, in the case of ''closed orders''.
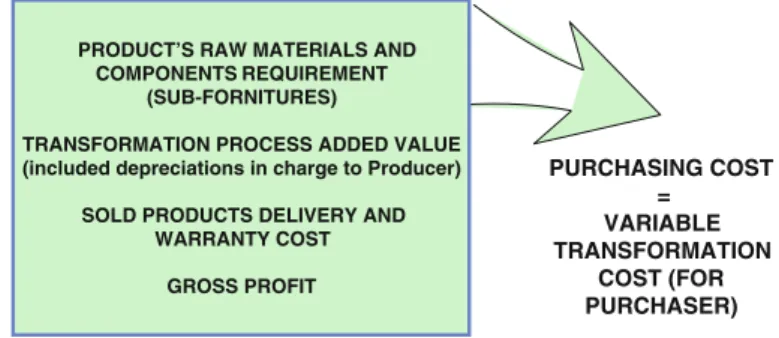
Supplying Cost and Purchasing Effectiveness Indicators
The gross profit is to cover the general expenses of the company charged to the supplier, including R&D (except what is charged to the buyer, on a specific initiative), as well as taxes and remuneration of working capital. In addition to the above-mentioned indicators, it is important to evaluate the achievement of quality objectives and new product "time to market", which depends on the cooperation of the supplier.
The ‘‘Learning Curve’’ Concept
Using a logarithmic scale for the unit cost of a product against the progressively produced quantity, the diagram presented in Figure 8.1 shows descending linear straight lines in which k represents the slope, as in the following chart. This trend is not only related to standard production costs, but also to quality parameters (the frequency of production rejects, the rate of defects during the life of the product, the reliability of the duration).
Production Ramp up and Maximum Rate Achievement
Quality Management in Industrial Processes
Quality and Reliability Assurance Techniques
Total Quality Management and Continuous