Introduction
Dopamine as a neuromodulator
Specific functions of DA signaling mediated by separate subgroups will be discussed in Chapter 1.3. Systemic alteration of DA tone in the brain is demonstrated to modulate the level of behavioral arousal.
Tools for measuring dopamine release in vivo
Recently, attempts have been made to use optical methods for detecting DA release in vivo. Another recently developed technique to detect DA release in vivo is iTango, a light- and ligand-gated gene expression system (Lee et al., 2017).
Anatomical and functional heterogeneity of dopamine system
Similarly, VTADA terminals in the mPFC and basolateral amygdala were also excited by aversive events (Kim et al., 2016), suggesting that positive and negative valences may be encoded separately by different VTADA neurons defined by projection targets. Small portions of these neurons also project to the inferior colliculus and auditory brain stem, suggesting their potential role in auditory processing (Nevue et al., 2016).
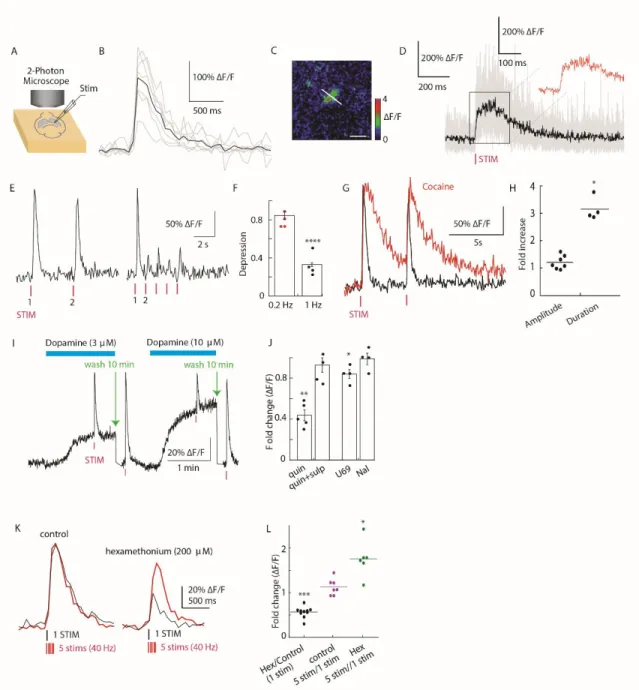
In the absence of hexamethonium, the amplitude of the fluorescence remained consistent regardless of the stimulation protocol (Fig. 2, K and L) (Mamaligas et al., 2016). For example, chemical lesion of SNcDA neurons projecting to dorsal striatum (DS) promotes wakefulness, and optogenetic stimulation of SNcDA terminals in DS increases NREM sleep ( Qiu et al., 2016 ).
Ultrafast neuronal imaging of dopamine dynamics with designed
Summary
We were also able to use dLight1 to chronically measure learning-induced dynamic changes within dopamine transients in the nucleus accumbens with sub-second resolution. CONCLUSION: To overcome the major barriers of current methods and enable high-resolution imaging of dopamine dynamics in the mammalian brain, we developed and .
Introduction
CNiFERs) (Muller et al., 2014) and reporter gene-based iTango (Lee et al., 2017) can reveal DA release with high molecular specificity. However, these systems are limited by poor temporal resolution (seconds to hours), preventing direct detection of DA release events occurring on sub-second timescales (Ford et al., 2009 and 2010).
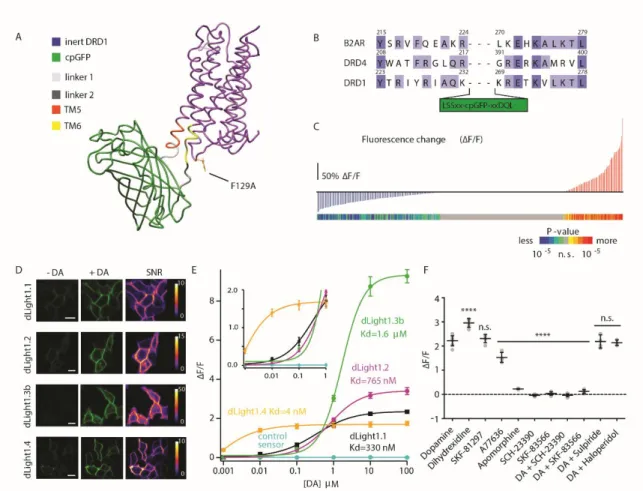
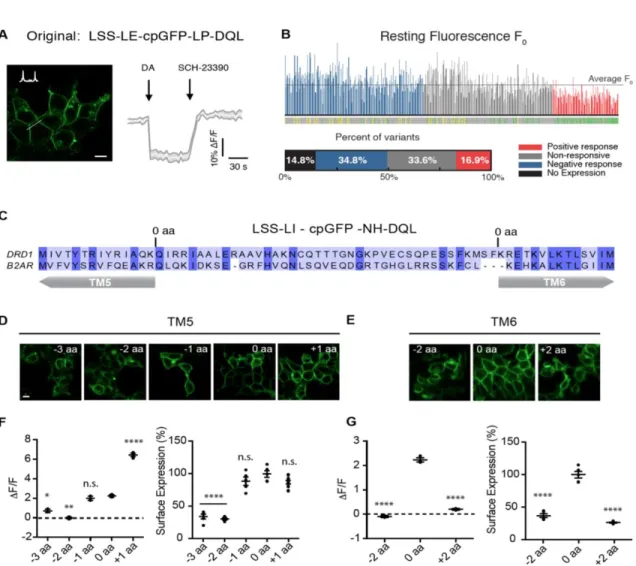
Sensor engineering
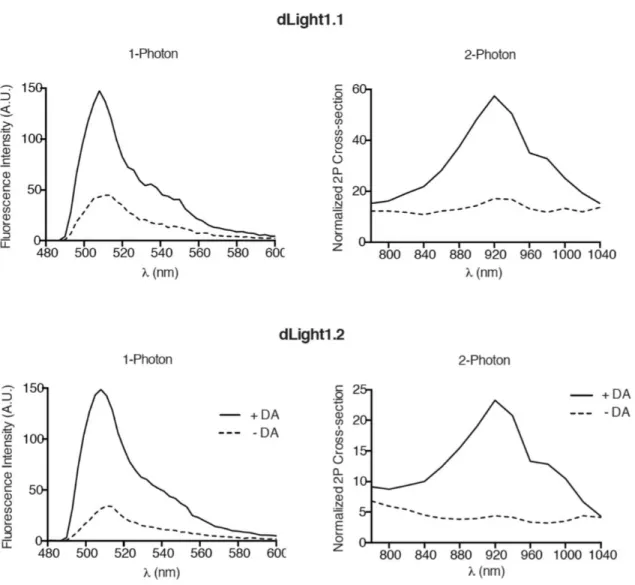
Because dLight1.1 and dLight1.2 elicited large responses at low DA concentration (e.g., 100 nM) without approaching saturation of the response ( Figure 1E , inset) and had submicromolar affinity, we further characterized these two sensors.
Sensor characterization
Transiently transfected dLight1.1 and dLight1.2 did not elicit a significant cAMP response in HEK cells, similar to the negative control (EGFP), whereas the wild-type DRD1 receptor significantly did (fig. S6A). Total internal reflection fluorescence (TIRF) imaging confirmed that dLight1 remained diffusely distributed in the plasma membrane, without any detectable internalization, during the entire cycle of the ligand-dependent fluorescence change (fig. S6, D to F).
Versatile application to other neuromodulators
Two-photon imaging of DA release in dorsal striatum ex vivo and in
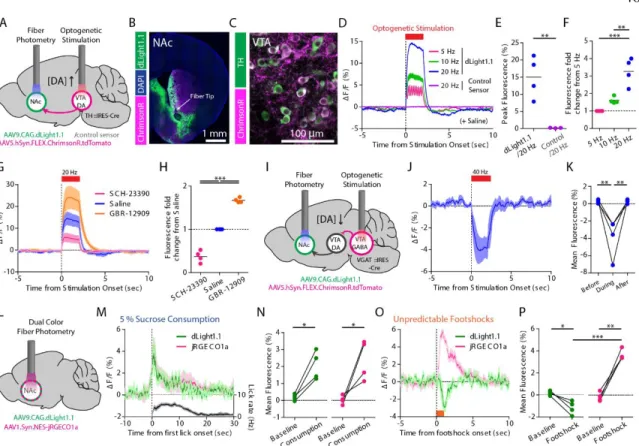
Next, we examined the action of known modulators of DA release using dLight1 ( Fig. 2, J to L ). We measured DA transients by two-photon imaging during rest and self-initiated movement (Fig. S9).
Deep-brain recording of DA dynamics simultaneously with optogenetics
When mice voluntarily consumed a reward (50 ml 5% sucrose), we observed a concordant increase in DA concentration and local population activity (Fig. 3, M and N, and Fig. S13E), similar to a class of individual NAc- units of arousal after reward (Taha and Fields, 2005). In contrast, foot shocks suppressed DA release while enhancing local neuronal activity, indicating dissociation between DA dynamics and local circuit activity (Fig. 3, O and P, and Fig. S13F).
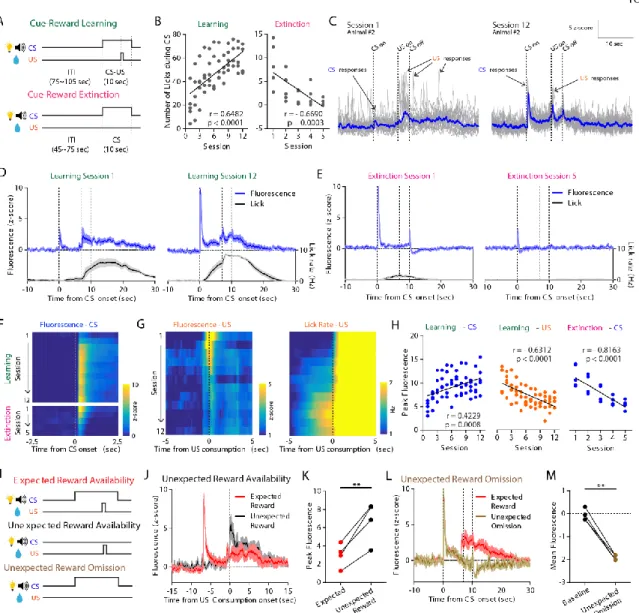
Chronic imaging of DA dynamics throughout cue-reward learning
After the animals had fully learned the CS-US association, mice underwent “unexpected reward availability” sessions (in which the US was occasionally made available without the CS) between normal paired trials (Fig. 4I). In the “unexpected reward omission” session, in which the US was occasionally omitted after the predictive CS, fluorescence fell below the pre-CS baseline after the time when the US would normally have become available after CS presentation ( Fig. 4 , L and M ).
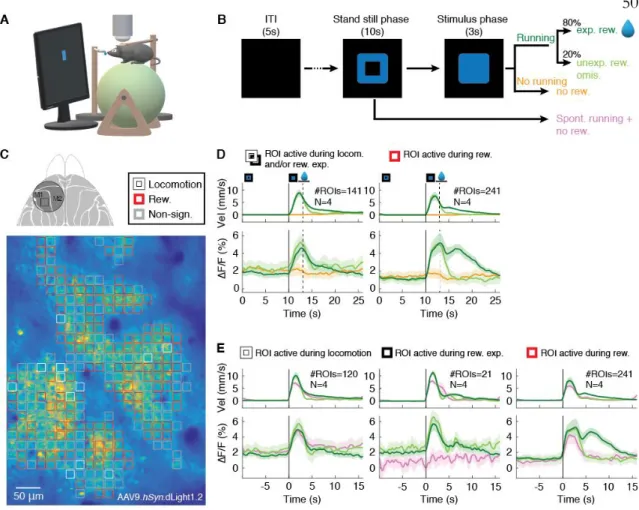
Cellular-level imaging of functionally heterogeneous DA transients in
A small subset of responsive ROIs (5%) showed significant increases in DA transients during reward anticipation but not spontaneous running ( Fig. 5E , middle), whereas the other 32% of ROIs correlated with locomotion ( Fig. 5E , left). The 63% of reward-only ROIs (Fig. 5D, right) also showed increased DA transients during the early stimulus presentation phase that consisted of both movement- and reward-expectation-related responses (Fig. 5E, right).
Conclusion
Simultaneous calcium imaging can further determine how spatiotemporal differences in DA levels relate to ongoing neural activity and affect associative learning or goal-directed behavior. Other dLight variants may be suitable for measuring synaptic release (dLight1.3) or tonic DA transients (dLight1.4).
Main figures
M and N) Increase in dLight1.1 (green) and jRGECO1a (magenta) fluorescence during consumption of 5% sucrose with lick rate (black, n = 5 mice) and quantification of mean fluorescence. O and P) Decrease in fluorescence in dLight1.1 (green) and increase in jRGECO1a (magenta) during unpredictable footshock (0.6 mA for 1 s, n = 5 mice) and quantification of mean fluorescence.
Supplementary figures
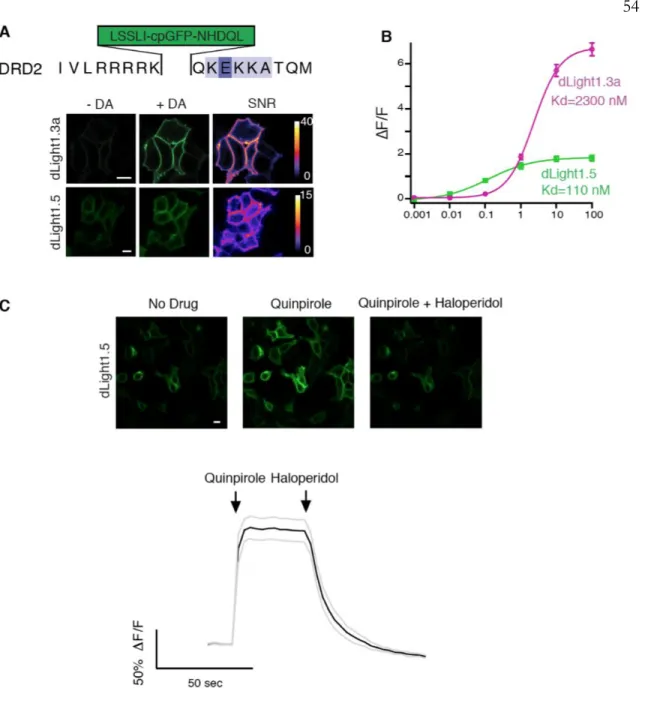
Characterization of dLight1.3a and dLight1.5. A) Upper amino acid sequence of the DRD2 insertion site for the cpGFP module. Bottom, representative images of dLight1.3a and dLight1.5 expressed on HEK293 cells before and after addition of DA (10 μM) and corresponding SNR heatmaps. Average fluorescence projection from a representative image field showing dLight1.1 green expression (top) and td-Tomato red expression (bottom).
Footshock caused a transient depression of the dLight1.1 fluorescence, which is consistent with the dual color fiber photometry results shown in Figure 3O (the mean fluorescence decrease was quantified;
Materials and methods
The threaded structures were then hybridized together using the rosetta_cm protocol for membrane protein (Bender et al., 2016). Uncaging experiments on neuronal dendrites were performed in the presence of 100 μM caged dopamine (carboxynitroveratryl-DA, CNV-DA (Robinson et al., 2017)) in the HBSS. Two-photon imaging was performed as previously described (Sheffield et al., 2017), using the same collecting optics, but without the electric lens.
Time series movies were motion corrected on the static red channel using algorithms described previously (Dombeck et al., 2010) and x and y offsets relative to the red were used to correct the green channel.
Additional information
Availability of data and materials: All DNA and viruses have been deposited in NCBI (accession numbers MH244549-MH244561), ADDGENE, and the University of Pennsylvania Vector Core. All DNA plasmids and viruses are available from UC Davis or designated repository under a material transfer agreement. All other data necessary to assess the conclusion of the paper are present in the paper or supplementary material.
That DRNDA neurons were activated by exposure to a variety of salient cues extends their previous description as a socio-centric pathway ( Matthews et al., 2016 ). Outside the midbrain, A13 zona incerta DA neurons express c-fos after REM sleep recovery ( Leger et al., 2010 ). We based our photometry design on previous literature ( Lerner et al., 2015 ; Calipari et al., 2016 ) with some modifications.
The concentration of these dopamine antagonists was selected based on previous literature (Burgess et al., 2010; Eban-Rothschild et al., 2016).
Dorsal raphe dopamine neurons modulate arousal and promote
Summary
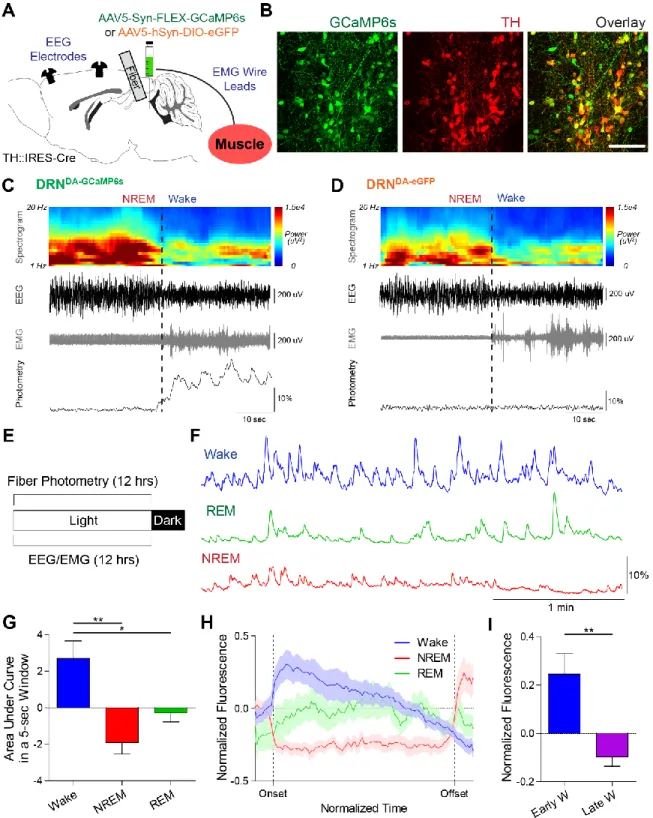
Here we demonstrate that the dorsal raphe nucleus DA neurons are critical modulators of behavioral arousal and sleep-wake patterns. We also observed broader fluctuations of DRNDA activity across sleep-wake cycles with the highest activity during wakefulness. Both endogenous DRNDA activity and optogenetically driven DRNDA activity were associated with awakening from sleep, with DA signal strength predictive of wake duration.
Therefore, the DRNDA population is a key contributor to wakefulness-promoting pathways and is capable of modulating sleep-wake states in response to the external environment, whereby the perception of salient stimuli induces wakefulness and arousal.
Introduction
Conversely, reduced DA signaling from the substantia nigra pars compacta (SNc) is associated with insomnia, a major symptom of Parkinson's disease (Gjerstad et al., 2007). Given the functional (Morales and Margolis, 2017), genetic (Poulin et al., 2014) and anatomical (Lammel et al. Margolis et al., 2008) heterogeneity of midbrain DA neurons, different DA subsets may have different effects on sleep. wake regulation. Chemical damage to these cells resulted in profound hypersomnia (approximately 20% increase in sleep), while prolonged wakefulness resulted in increased c-fos expression (Lu et al., 2006; but see Leger et al., 2010).
In contrast to VTADA-driven reward circuits, optogenetic activation of DRNDA neurons fails to enhance operant responding (McDevitt et al., 2014), but instead mediates a negative affective state and.
Results
To examine the association of DRNDA activity with sleep-wake states, we calculated the area. Interestingly, we observed that the duration of wake episodes varied as a function of the change in DRNDA activity during wake onset. This suggests that DRNDA activity at the onset of arousal is positively correlated with the duration of the subsequent arousal episode.
There was no detectable difference in DRNDA activity increase between NREM and REM-to-wake transitions (Figures S6D and S6E).
Discussion
This is in sharp contrast to wake-promoting VTADA neurons, whose activity supports robust place preference and operant responding ( Tsai et al., 2009 ; Witten et al., 2011 ). That DRNDA neurons can simultaneously send arousal and anti-nociceptive signals (Li et al., 2016) can be understood by considering DRNDA connection with the bed nucleus of the stria terminalis (BNST; Figure S4Q), which is a critical regulator of pain. Here we show that DRNDA neurons are awake-active (Figures 2 and 3), whereas VTADA neurons exhibited increased burst firing or Ca2+ signals during REM sleep over wakefulness (Dahan et al., 2007; Eban-Rothschild et al. al., 2016).
While the role of VTADA firing during REM sleep remains elusive, optogenetic activation of VTADA neurons can promote behavioral and electrocortical arousal ( Eban-Rothschild et al., 2016 ; Taylor et al., 2016 ).
Main figures
Simultaneous fiber photometry and EEG/EMG recordings reveal a correlation between DRNDA neuronal activity and sleep-wake states. in addition to fiber photometry, EEG screw electrodes and EMG leads were implanted to classify sleep-wake states. Representative example of an NREM-to-wake transition from a DRNDA-GCaMP6s mouse with EEG spectrogram, EEG, EMG and photometry traces. Note: DRNDA fluorescence was increased at the onset of wakefulness, when EEG desynchronized from delta (0.5–4 Hz) and EMG amplitude increased.
Regardless of sleep deprivation, the latency to wake after stimulation was significantly shorter in DRNDA-ChR2 mice compared to controls (unpaired t-test, *p < 0.05, **p < 0.01).
Supplementary figures
The same phasic stimulation paradigm did not induce any state changes in a DRNDA-eGFP mouse. Hz pulses for 2 min, pulse width 10 ms) were delivered every 20–25 min to DRNDA-ChR2 and DRNDA-eGFP mice. The probability of REM-to-wake transition upon presentation of auditory tones was not different between DRNDA-Arch and DRNDA-eGFP mice (n = 6 DRNDA-Arch mice, n = 4 DRNDA-eGFP mice; unpaired t-test, p > 0.1).
Right, there was no statistically significant difference in theta amplitudes (5–10 Hz) between groups during tone presentation (n = 6 DRNDA-Arch mice, n = 4 DRNDA-eGFP mice; . Unpaired t-test, p > 0.6).
Supplementary movie captions
Materials and methods
To perform the test, mice were connected to and habituated to the photometry patch cord. TTL pulses were sent to the fiber photometry digital input channel for time stamping when air puffs were applied. TTL pulses were sent to the fiber photometry digital input channel for accurate time stamping.
A subject was connected to a patch cord and transferred to the open field box (50 cm x 25 cm x 25 cm), which was divided into left and right compartments.
Additional information
Dorsal raphe dopamine neurons signal motivational salience
Summary
DRN DA dynamics during classical conditioning
DRN DA neurons encode unsigned prediction error
DRN DA neurons are modulated by internal motivational state
Future directions
Figures