Ultimately, the design process can be seen as the culmination of the entire chemical engineering field. Based on the behavior of the objective function when these points are changed, the engineer will choose the optimum. To do this, the engineer must maximize the conversion of the reactants as well as the selectivity to the desired product.
For most processes, the engineer must consider the properties of the reactor, recycle, and separation sections.
Introduction to Process Simulation
Although most unit operations translate directly to the program, blend points and split points do not. However, three feeding conditions are an exception because the temperature and pressure of the feed stream are not independent in these cases. These allow the simulator to complete mass and energy balances on the process, and.
Depending on what the user wants to examine, he or she can choose to display the vapor and liquid components.
Base Case and Project Description
11-tower section, the light key is the lightest component in the bottom stream and the heavy key is the heaviest component in the overhead stream. In addition, an extra tower scheme can be added to purify the benzene stream and increase the process revenue. Finally, the changes made during the optimization process on the styrene plant are detailed in the executive summary attached in Appendix A, but the most important changes are summarized here.
After completing the optimization process, the plant had a total net present value of $31 million and a discounted cash flow return (DCFROR) of 16%.
Continuing Work
Other small improvements have been made to slightly improve the plant's NPV or to ensure that the plant can operate safely.
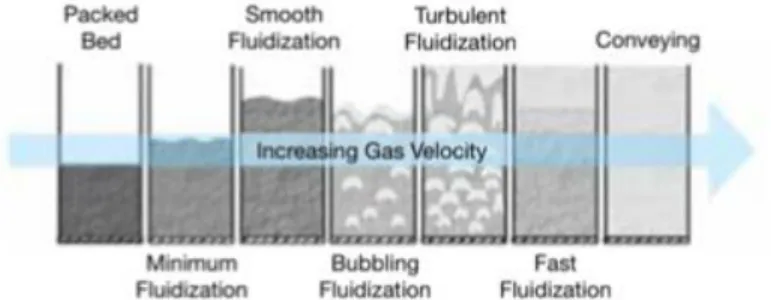
Introduction to the Fluidized Bed Reactor
Regardless of their challenges, however, fluid bed reactors have several key advantages over other reactor types due to their use of fluidization. First, the heat transfer rate for a fluidized bed reactor is significantly higher than for other reactor types, such as packed beds, and can be as much as 5 to 10 times. It also allows the fluidized bed to more efficiently transfer heat produced in an exothermic reactor to a utility stream;.
In addition, the fluidized catalyst enables easy maintenance; therefore, catalyst can be added or removed from the reactor without causing downtime [2].
Given Values and Assumptions for a Fluidized Bed Reactor
In addition, the minimum fluidization velocity must be adjusted to the superficial gas velocity for a fluidized bed reactor using a multiplier between 3 and 10. Several values were also given at the beginning of the project regarding the fluidized bed configuration. Instead, it is more likely that the catalyst was chosen for a fluidized bed reactor because the lighter particles fluidize more easily.
Based on this definition, the installed cost of the reactor is entirely dependent on the number of heat transfer tubes used.
Algorithm for Fluidized Bed Reactor Calculations in Excel
17 Because this was simulated in Excel, complex and more realistic thermodynamic packages could not be used; therefore, the ideal gas law was assumed to apply to all flows in the process. To continue the calculations examining the exhaust stream composition and pressure drop, the change in moles of each component per hour could first be tabulated using the 4 reaction rate laws given earlier in the project brief (shown in appendix D1). . Since the steam present in the reactor was a diluent, the number of moles of water in the reactor was constant.
This determined the pressure increase for each reactor interval due to an increase in the number of moles in the reactor. However, the actual dimensions of the reactor were initially unknown and had to be calculated. Based on these assumptions, the length and cross-sectional area of the reactor varied with each interval.
This first required determining the minimum fluidization velocity in the reactor, which can simply be calculated using Archimedes and Reynolds numbers (shown in equations 1 and 2). To find this, the ideal gas law was first sought to determine the density at each interval of each component in the reacting stream. As stated before, this multiplier must be between 3 and 10; therefore for these calculations the value 6.5 is arbitrarily chosen as it is right in the middle of the available range.
Ultimately, these calculations resulted in 11 different possibilities for reactor length and cross-sectional area due to the 11 different calculated surface velocities. These values complete the variables of the Ergun equation that were not given in the project description.
The Selection of the Fluidized Bed Reactor Configuration
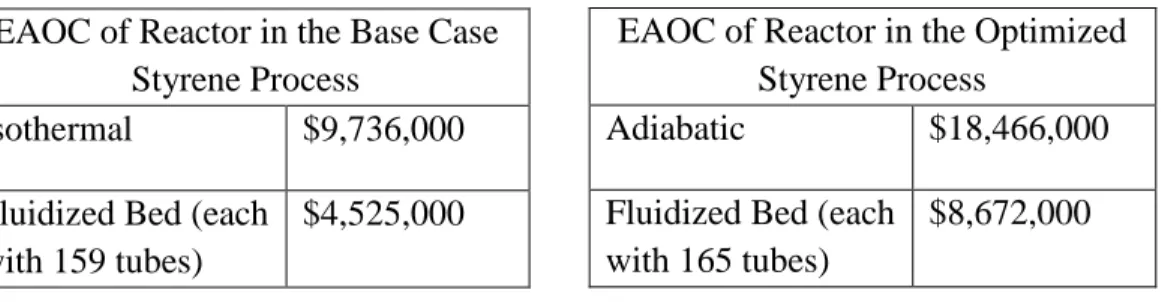
In addition, it was assumed that the fluidized bed reactors used nC36 as an aid to maintain an isothermal profile. In the case of the isothermal and adiabatic reactors, there were 2 schemes with 5 reactors each. Ultimately, to enable easy calculation, the fluid bed reactor must be compared with the isothermal reactor from the base-case styrene production process and the adiabatic reactor from the optimized production process.
Finally, no further optimization could be completed on the fluidized bed reactors because the only variable affecting the calculated EAOC was the number of heat transfer tubes, which changed the heat transfer area. Based on simplified calculations, it was very clear that fluidized bed reactors were the best option for reducing reactor costs in the styrene production process. This was most likely due to the fact that 3 fluidized bed reactors could replace 10 isothermal or adiabatic reactors; therefore, they greatly reduced investments in reactors.
Ultimately, the requirement of fewer actual reactors in the process was due to the fact that, due to the fluidized process stream, the fluidized bed reactors have more efficient heat transfer. The theory behind fluidized bed reactors was discussed before the fluidized bed reactor calculations were detailed. Finally, these calculations led to a scheme of 3 fluidized bed reactors with volumes of 83.3 m3 in parallel.
Compared to isothermal and adiabatic reactors, fluidized bed reactors have been found to have about half the cost. This was probably because the fluidized bed reactor scheme contained only three reactors, while the isothermal and adiabatic schemes contained ten each; therefore, the capital investment required for fluidized bed reactors is much lower.
Appendix A – Styrene Process Optimization Design Report (written with Seth Gray and Mitch Sypniewski in ChE 451, Fall 2018)
- Introduction
- Base Case
- Notes about Sign Conventions for Optimization
- First Change: Reactor Type
- Second Change: Reactor Conditions
- Third Change: Materials of Construction
- Fourth Change: Extra Tower to Purify Benzene Stream
- Fifth Change: Heat Integration
- Sixth Change: Compressor Adjustments
- Summary
- Sensitivity Scenarios
- Conclusions
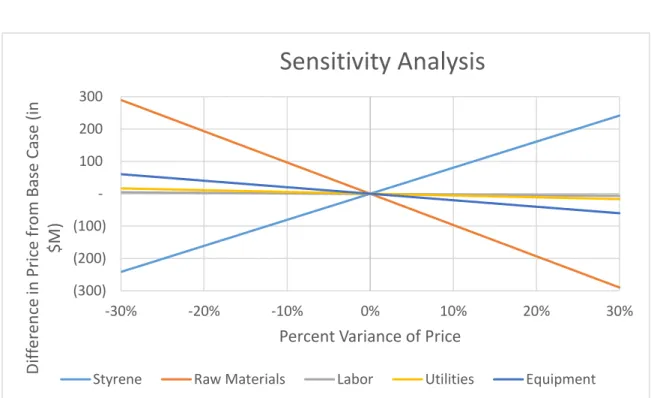
As can be seen from the figure, the price of styrene and the cost of raw materials varied the most. The main contribution to the improvement of NPV was the reduction of raw material costs. This was due to a lower single-pass ethylbenzene conversion in the reactor section (57% to 42%), which ultimately resulted in a higher ethylbenzene recycle stream and a higher overall styrene yield (50% to 58%).
The contribution of the FCI to the project's NPV is mainly attributed to three different points in the process. This is due to the lower single pass conversion of ethylbenzene in the reactor sections; therefore, this leaves a larger amount of ethylbenzene present in T-502, and the higher flow rate requires a larger tower volume. Since the catalyst volume is proportional to the reactor volume, this change was accompanied by a decrease in the catalyst cost of $2.5 M per year.
Due to the dehydrogenation mechanism of ethylbenzene, atomic hydrogen will be present in the reactors. Due to the recent decline in utility market value, the engineering team only focused on implementing heating integration in part of the process. In the preliminary design, high pressure steam (HPS) is heated and vaporized stream 2 in heat exchanger E-501.
The other major process safety issue noted was limiting exposure to the chemicals in the process. If utility costs were to drop, little would change in the optimized design process.
Appendix B- Base and Optimized Case Specifications
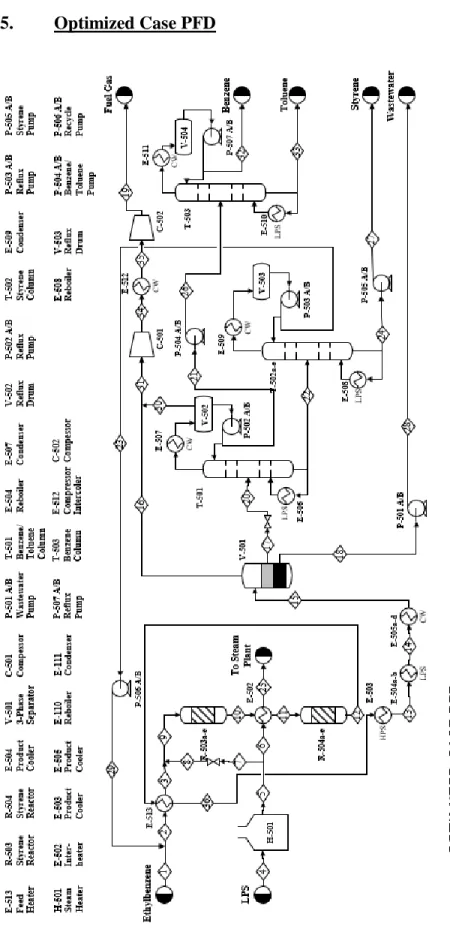
Base Case PFD
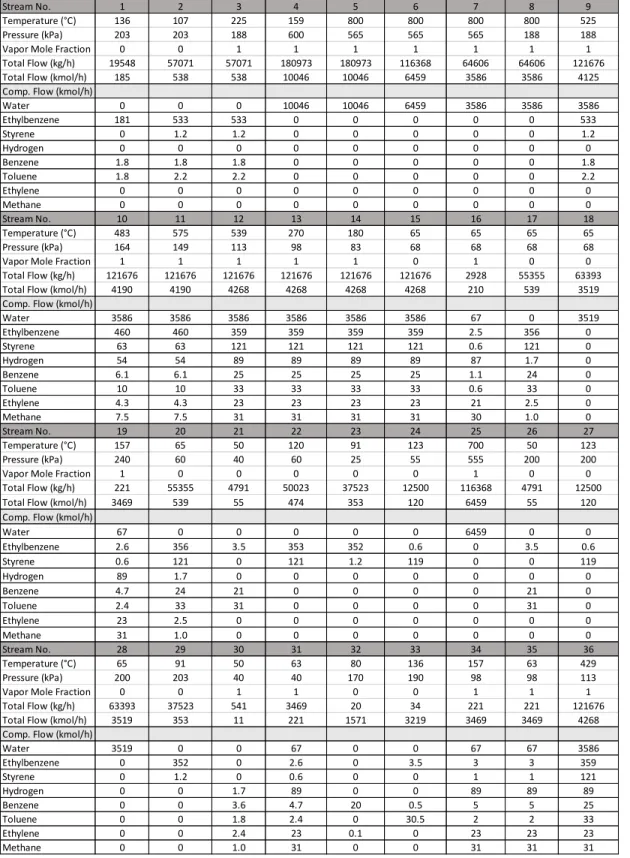
Base Case Stream Table
The vaporized stream 3 is mixed with a sufficient amount of high-pressure steam (stream 8) to form stream 9. Here the vapor is cooled and partially condensed into a liquid/vapour mixture at 65°C and 102.2 kPa (stream 15). This mixture is then fed to a three-phase separator, V-501, where it separates into three streams: the vapor stream (stream 16), which contains all aqueous and organic substances.
The vapor stream is mixed with the fuel gas exiting the reflux drum V-502 (stream 30) to form stream 31. The water flow is fed to the pump P-501A/B, where the pressure is increased to 200 kPa and treated as wastewater. . The vapor stream from the top of T-501 is condensed in heat exchanger E-507 with the help of cooling water and sent to the reflux drum V-502.
The vapor product from the top of T-502 condenses in heat exchanger E-509, with the aid of cooling water, before passing through reflux drum V-503. Here the vapor is cooled and partially condensed to a liquid/vapor mixture at 65°C and 68 kPa (stream 15). These are the conditions at which the stream is sold as fuel gas in stream 19.
The water flow (stream 18) is supplied to the P-501A/B pump where the pressure is increased to 200 kPa and treated as dirty water. The product vapor from the top of T-502 is condensed in heat exchanger E-509, using cooling water, before passing through reflux boiler V-503.
Optimized Case Equipment Summary Table Utility Summary for Unit 500
Appendix C- Optimization Materials and Steps
Sensitivity Graph
Economic Comparison (Reactor Type) NPV
Economic Comparison (Reactor Conditions) NPV
Conversion vs. Selectivity (Temperature of R-503)
Conversion vs. Selectivity (Temperature of R-503)
Economic Comparison (Heat Integration) NPV
Economic Comparison (Base Case vs. Optimized Case)
Appendix D- Miscellaneous Information
Rate Laws
Notes About November 2018 Presentation Deficiencies
Initially, the engineering team defined it as the yield of styrene divided by the total amount of all by-products (benzene and toluene) and by-products (hydrogen, ethylene and methane). Now, the definition is the yield of styrene divided by the total side product alone. The additional separation caused an increase in the raw material cost for the total process when solving the mass balances, which did not make sense since it only had to separate the existing stream.
Our original tables had annualized prices, one-time costs, and NPV in one place, and we indicated the significance of each adjustment in the process with percentage changes. We have corrected all tables in Appendix C to reflect NPV contributions (the panel asked us to present all values in terms of NPV or equivalent annual operating costs – EAOCs). We have moved these figures to the appendix section to make them accessible to the but also to keep them separate so that they are not a distraction (the panel mentioned this during the presentation). We also created the graphs below for the presentation; however, the NPV values are now incorrect because we discovered that we had not removed the energy costs for the isothermal reactors after we changed them to adiabatic. However, despite this error, the trends observed in the graphs did not change and this still influenced the team's design choices.
Given more time, the team would have revised them to properly reflect the exact NPV.
Temperature (°C)
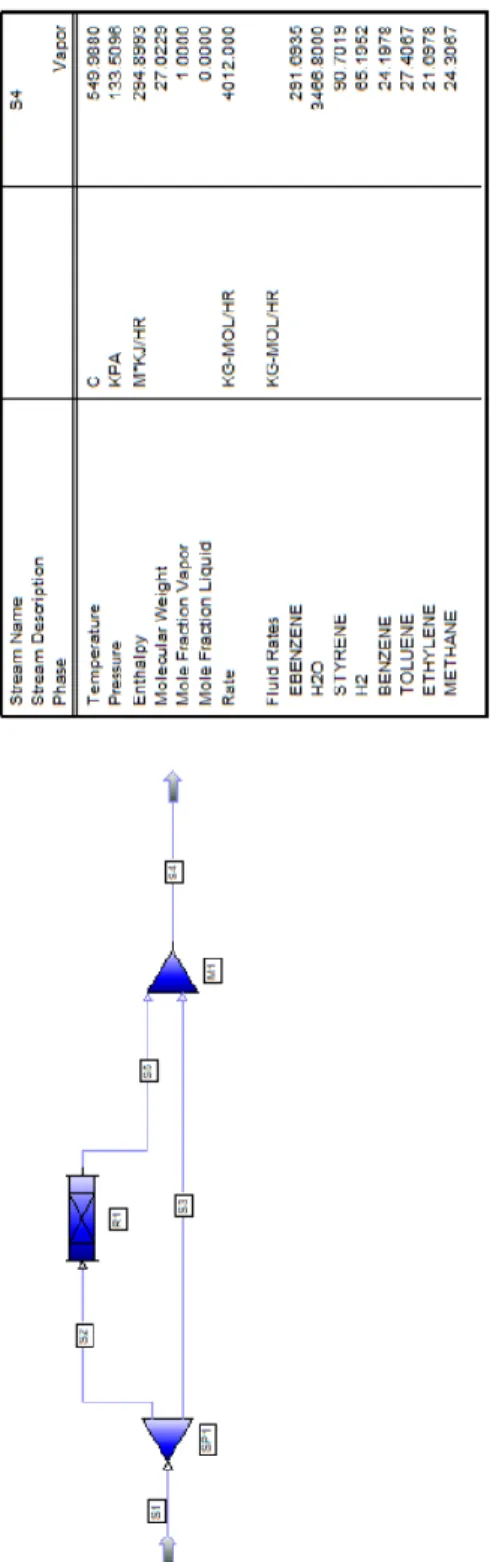
Appendix E- Fluidized Bed Reactor Pro-II Simulation