Initially, during the discussions among four colleagues about this writing project, we used "on the optimal design of production lines" as the working title of the book. Therefore, we see the process of optimal design of production lines as a complementary activity between researchers and practitioners.
Manufacturing Systems: Types and Modeling
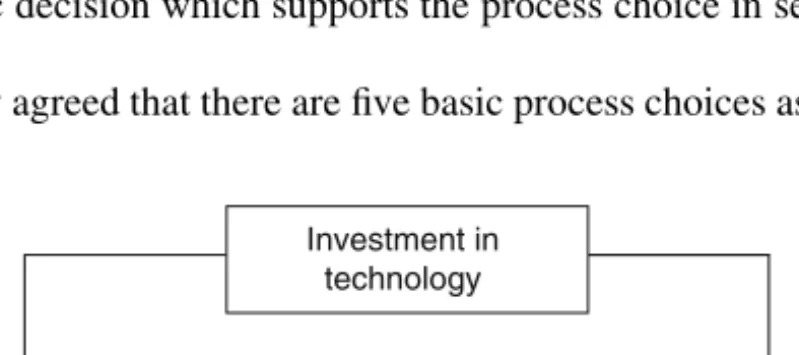
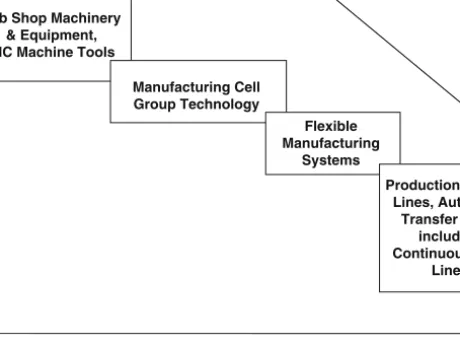
Manufacturing Systems: Evolution and Classification
The flexibility of a production system (automatic or manual) is a function of the physical system, its associated software, and how it operates. Agility can be considered a characteristic of the enterprise and not simply of the production system.
Models and Modeling
Dynamic models can be subdivided into stable and unstable models, while static models must be stable. In some processes, a model of the process can be used as a real-time decision support system to assist in control decisions.
Classification of Manufacturing Systems
Care must be taken when discussing the number of workstations in a production system from the point of view of an individual product. This classification system developed above, although perhaps somewhat academic and open to criticism in some circumstances for lack of completeness, clearly illustrates the complexity of manufacturing systems in general and demonstrates the need to limit one's attention in the context of today's computing capabilities for well-defined and well-structured production systems.
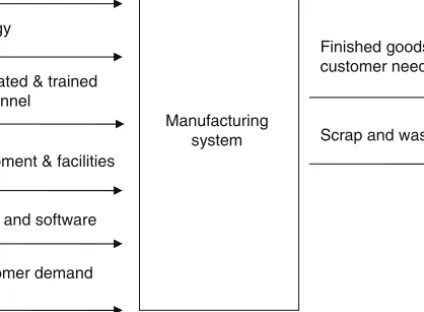
Models of Manufacturing Systems
Such models could be used as planning models or planning models within the classification already given. Throughput or other system performance measures are determined by the evaluation model.
Methods of Analysis
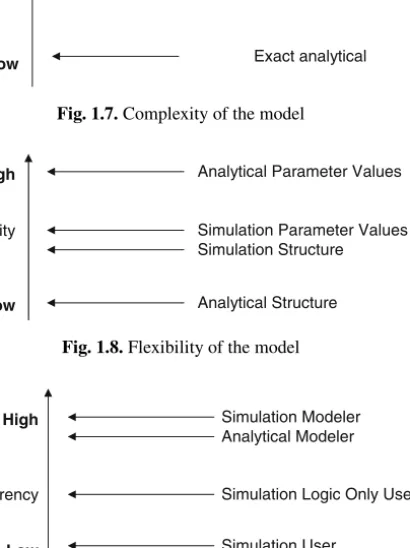
Finally, in terms of user interface, the simulation model is very user-friendly if the visualization unit is part of the simulation solution, and analytical models can be made more user-friendly by incorporating them into easy-to-operate decision support systems (DSS). A rather different approach to developing solutions to problems related to the design and operation of production systems are techniques based on artificial intelligence (AI) expert systems.
Measures of Performance
System or global utilization is the average of the utilizations of the workstations that make up the system (including workstations working in parallel). Hold time or completion time of a workstation for a "standard" product is the product of the "standard" processing time by (1 plus the block time ratio).
Related Bibliography
2001), Automation, Production Systems, and Computer Integrated Manufacturing, Second Edition, Prentice Hall. 1998), Fundamentals of Queuing Theory, 3. udgave, John Wiley. Company og Bodley Head. 2005), Operations Management, 4. udgave, Prentice Hall. 2002), Operations Research: An Introduction, 7. udgave, Prentice Hall. 1998), A Practical Introduction to Management Science, Addison-Wesley.
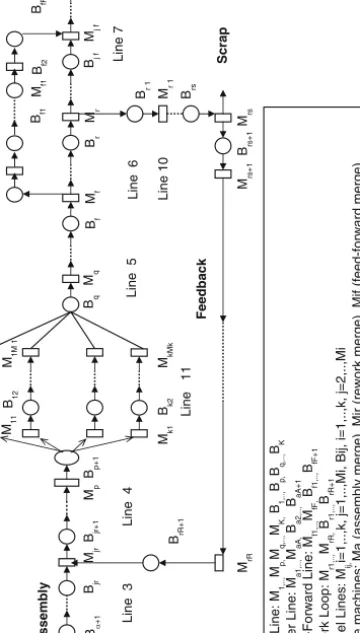
Evaluative Models of Discrete Part Production Lines
Markovian Model
- A numerical approach
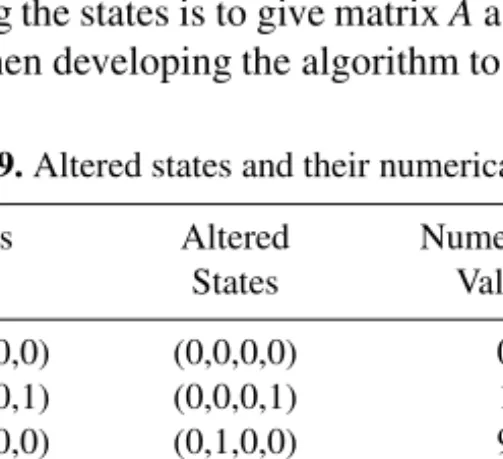
- The algorithm for the generation of the conservative matrix A for the reliable exponential production lines with inter-station buffersreliable exponential production lines with inter-station buffers
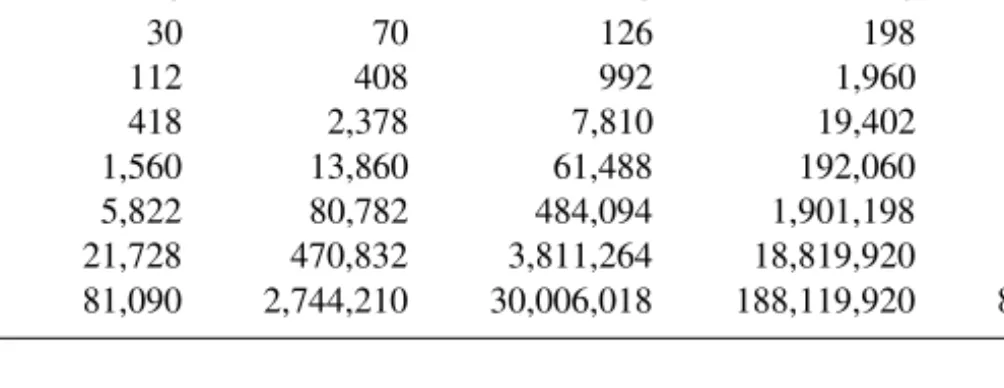
A prerequisite for the development of the algorithm is the derivation of the equation for calculating the number of states in the subnet. The latter method is used in the transition matrix generation algorithm.
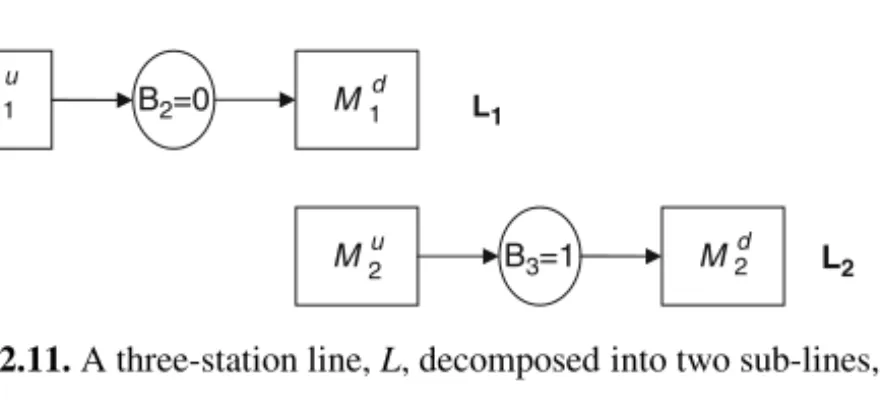
Decomposition Approach
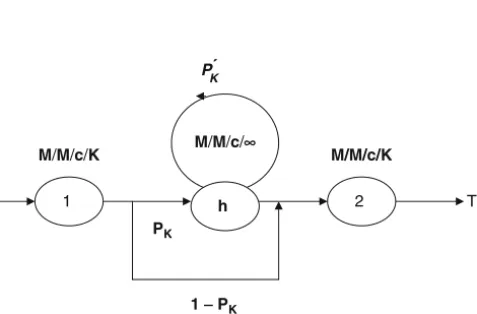
Each subline normally consists of two stations and an intermediate buffer corresponding to a buffer of the original line. There are B+2 states in the system of Figure 2-14, where B is the buffer size of the intermediate buffer B.
The Expansion Method
The probability that the buffer in the subline Li is empty or full is close to Biin, the original line L being empty or full. The probability of resumption of flow into and out of the buffer in sub-line Liin a time interval after a period in which it was interrupted is close to the probability of the corresponding event in the original line L.
Network reconfiguration
Parameter estimation
The Aggregation Method
This merged combined machine is then merged with a third machine and this advanced merging process continues until the last machine is reached. It is assumed that the first machine is never exhausted and the last machine is never blocked.
Modeling of Production Lines with Parallel Reliable Machines at Each StationMachines at Each Station
- Exact solution to a two-station production line with parallel machines at each stationat each station
- Alternative exact Markovian analysis of a two-station line with parallel machines at each stationmachines at each station
- Approximate methods for large lines
- Derivation of the decomposition equations
- The decomposition algorithm
- Numerical results
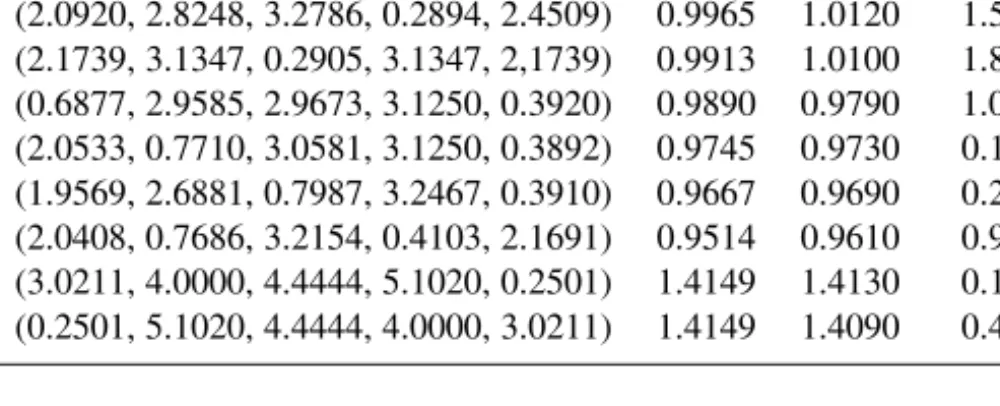
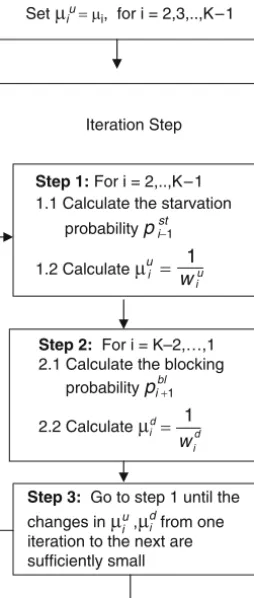
Let XiL be the average production rate of the two-workstation, one-buffer subline Li and Xiu(Xid) be the average production rate of the virtual upstream (downstream) pseudo workstation Miu (Mid), i=1 ,..,K−1. Recall that this decomposition algorithm for K=2 stations specifies the two-station line, with parallel machines at each workstation and an intermediate buffer, which is solved exactly and the throughput of the system is calculated.
Simulation Modeling
The service or processing times are exponentially distributed and the average service rates of identical machines at each workstation are μi =1, i=1,..,4. Any individual machine may block after service due to finite buffer capacities, excluding the last set of parallel machines.
General Comment
It may be of interest to briefly discuss possible extensions of the relatively simple simulation model developed above. Obviously, the number of stations and the number of parallel cars at each station can be modified.
Related Bibliography
1996), An analytical formula for the average throughput of K-station production lines without intermediate buffers, European Journal of Operational Research, Vol. 1993), Queuing Theory in Manufacturing Systems Analysis and Design, Chapman & Hall. 1989). A Recursive Algorithm for Generating Transition Matrices for Multistation Serial Production Lines, Computers in Industry, Vol. 2001), Modeling and Analysis of an Unreliable Flow Line Composed of Parallel Machine Steps, IIE Transactions, Vol. 1994), Queuing Networks with Blocking - Exact and Approximate Solutions, Oxford University Press.
The Design of Production Lines
Introduction
Further details of the considerations involved can be found in Buzacott and Shanthikumar (1993), Altiok (1997) and Groover (2001) among others. Determining the number of machines at each workstation: The use of parallel systems will affect line throughput.
Role of the Design Engineer
In passing it may be noted that in practice the coefficient of variation of service times has been found to be of the order of 0.2 to 0.4. It is unrealistic to expect at this stage of the development of analytical modeling, including simulation, that the designer can produce designs of production lines that cannot be improved.
Improvability
Workforce scheduling determines the production rate (machine operators) and average uptime (repair personnel) of each machine. A more detailed review of issues related to bottlenecks is covered in Goldratt and Cox (1986) in the context of the theory of constraints.
Work-Load and Server Allocation Problems
The Work-Load Allocation Problem
- The bowl phenomenon
- Computational issues
The classic concept of the bowl phenomenon is that the workload should be divided among workstations according to a strictly concave function. The TLWLA procedure will give an approximate distribution of the workload and the approximate optimal throughput of the production line.
The Server Allocation Problem
The following summary may be of value to the reader who wishes to use the software available on the website linked to this book for solving workload sharing problems. For large exponentially reliable production lines with multiple parallel identical machine stations and finite intermediate buffers with specified workload allocation.
The Simultaneous Work-Load and Server Allocation
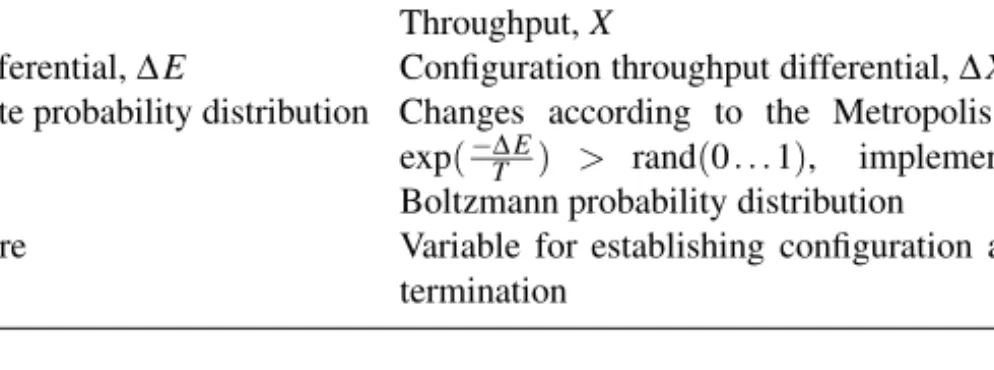
Specifically, one uses the evaluative decomposition algorithm for solving serial production lines with multiple parallel machine stations in conjunction with an optimization algorithm such as simulated annealing and genetic algorithm to find an optimal or near-optimal solution to the server allocation problem. Details of simulated annealing (SA) and genetic algorithms (GA) as optimization procedures are given in Chapter 5, Section 5.4.
The L-phenomenon
Related Bibliography
- Bowl phenomenon
- Reversibility
1979a), The efficiency of balanced and unbalanced production lines, International Journal of Production Research, Vol. 1979b), The Effect of Interstage Buffer Capacity Inequality and Runtime Variability on the Efficiency of Production Line Systems, International Journal of Production Research, Vol. 2000), The multiple server effect: Optimal allocation of servers to stations with different service time distributions in tandem queuing networks, Annals of Operations Research, Vol. 1988), Optimal Ordering of Servers for Tandem Queues in Light Traffic, Management Science, Vol. 1999), Performance Analysis of Flow Lines with Nonlinear Flow of Material, Springer-Verlag. 1990), The efficiency of unbalanced production lines: an alternative interpretation, International Journal of Production Research, Vol. 1989), On the efficiency of unbalanced production lines, International Journal of Production Research, Vol. 1990), On the efficiency of unbalanced production lines: a response to an alternative interpretation, International Journal of Production Research, Vol.
The Buffer Allocation Problem
Formulation of the Buffer Allocation Problems
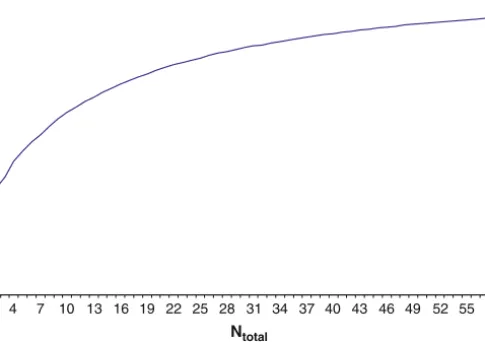
As a consequence of the proof by Meester and Shanthikumar (1990) of the concavity of the throughput of tandem queuing systems with finite buffer storage space, it is clear that problem BAP-A is an increasing function of the total buffer space N. In general, numerical approaches are for solving the problems unavoidable, even in situations with a relatively small number of states, due to the discrete nature of the buffer allocation and the unavailability of closed-form expressions.
Solution of the Buffer Allocation Problems
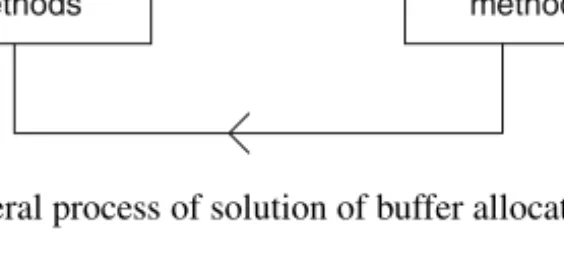
The method of solving the buffer allocation problem follows the process as shown in Figure 5.1. The evaluation method determines the performance objective value for the system as specified.
Solution Approaches to the BAP in Short Lines
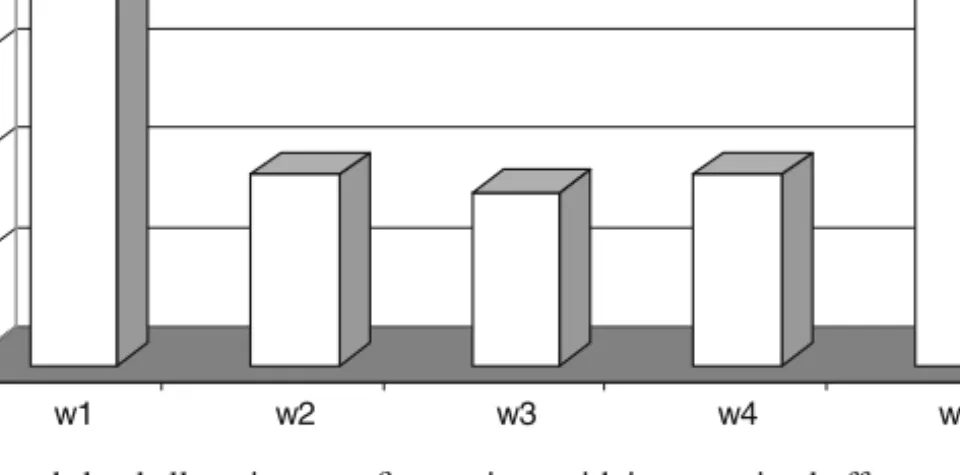
This finding contradicts the well-known result on the uniformity of the optimal buffer allocation in a balanced line. Find the optimal buffer allocation for N=9 shared buffer slots among the three buffer locations of the production line that maximizes its throughput.
Solution Approaches to the BAP in Longer Lines
The solution gives N, the total number of buffer slots, and the distribution of N among the intermediate K−1 buffers of the production line. It follows a logical improvement paradigm considering the exponential complexity of the solution space.
Related Bibliography
A tutorial and an application to neural networks, OR Spektrum, pp. 2002), Buffer Capacity for Accommodating Machine Breakdown in Serial Production Lines, International Journal of Production Research, Vol. 1993), Effect of discrete batch WIP transfer on the efficiency of production lines, International Journal of Production Research, Vol. 1992), Some Convergence Results for Probabilistic Tabu Search, ORSA Journal on Computing, Vol. 1993), Integrating and accelerating tabu search, simulated annealing, and genetic algorithms, Annals of Operations Research, Vol. 1986), Future Paths for Integer Programming and Links to Artificial Intelligence, Computing and Operations Research, Vol. 1998), Taboo Quest, Kluwer Academic Publishers. 1999), An algorithm for optimal buffer placement in reliable serial lines, IIE Transactions, Vol. 1969), The effect of internal storage on the production rate of a series of stages with exponential service times, AIIE Transactions, Vol. 1993), The throughput rate of multistation unreliable production lines, European Journal of Operational Research, Vol.
Double and Triple Optimization
- Simultaneous Allocation of Work and Buffers, W + B
- Simultaneous Allocation of Servers and Buffers, S + B
- Simultaneous Allocation of Work, Servers and Buffers, W + S + BW+S+B
- Concluding Remarks
- Related Bibliography
However, as the number of servers increases in Spinellis et al. 2000), servers tend to build up toward the beginning of the line. There is a tendency for the extension method to assign the buffer slots to the end buffers of the line.
Cost Considerations
Cost Models: Profit Maximization
In general, the value of α will be estimated based on material, labor and machine content of the item in inventory. In Figure 7.3 the value of the objective function for each N is given for these parameter values.