Participatory research toolkit
for social norms measurement
December 2020
Participatory research toolkit
for social norms measurement
Contact information:
Suruchi Sood, PhD
Dornsife School of Public Health Drexel University
Philadelphia, PA USA Email: [email protected] Charlotte Lapsansky, PhD
Communication for Development Section, Programme Division
United Nations Children’s Fund Email: [email protected]
Suggested citation:
Sood, Suruchi, Kelli Kostizak and Sarah Stevens, Participatory Research Toolkit for Social Norms Measurement, United Nations Children’s Fund, New York, N.Y., 2020.
© United Nations Children’s Fund (UNICEF), New York, 2020.
The information presented in this toolkit is a culmination of decades of social and behaviour change communication research and practice around the world. The toolkit brings together instruments that have been used as part of larger research projects in collaboration with the United Nations Children’s Emergency Fund (UNICEF), including the development, testing and validation of ACT Framework for social norms related to female genital mutilation, which was initiated and developed under the oversight of the UNFPA- UNICEF Joint Programme on the Elimination of Female Genital Mutilation: Accelerating Change.
The development of this toolkit has been led by Dornsife School of Public Health, Drexel University, including Suruchi Sood (Associate Professor), Amy Henderson Riley, Carmen Cronin, Maho Okumura, Farren Rodrigues, and Sarah Wasser, in close collaboration with members from UNICEF’s Communication for Development and Child Protection Sections of the Programme Division and UNFPA’s Gender and Human Rights Branch.
In particular, technical guidance was provided by Charlotte Lapsanski (C4D Specialist, UNICEF HQ) and Mar Jubero (Child Protection Specialist, UNICEF HQ), with support from Berhanu Legesse, David Conrad, Alessia Radice, Harriet Akullu and Yasmine Sinkhada.
Editorial support was led by Green Ink and design support was led by Domestic Data Streamers with inputs and guidance given by UNICEF’s Communication for Development and Child Protection Sections.
The tools themselves have been adapted for use from numerous sources, including academic institutions, non- governmental organizations and experts in various fields. They have been tried, tested and refined based on the feedback of participants, whose points of view were invaluable along the way. We wish to thank and acknowledge the work of all these individuals – of whom there are too many to mention by name – without whose efforts this work would not have been possible.
A special thank you to the local research agencies (Frontieri, Sonfonia University, NRMC India, CMS Communication, and Indago) and to UNICEF country office staff in Ethiopia, Guinea, India, Jamaica and Macedonia, who oversaw and conducted research that contributed to the development of the tools within this kit.
UNFPA and UNICEF, on behalf of the UNFPA-UNICEF Joint Programme on the Elimination of Female Genital Mutilation:
Accelerating Change, wish to thank the people and
governments that have contributed to this work. Specifically, we thank the European Union and the governments of Austria, France, Iceland, Italy, Luxembourg, Norway, AECID (Spain), Sweden and the United Kingdom for their generous financial contributions.
© United Nations Children’s Fund (UNICEF), New York, 2020
Acknowledgements
Despite significant global investment and efforts to create a more
equitable and safer world for children, some challenges are so deeply rooted in the long-standing beliefs and social norms of communities that they continue to persist.
Over the last decade, there has been growing global recognition that addressing social norms is key to the achievement of the global 2030 Agenda for Sustainable Development. Social norms are critical determinants for explaining how behaviours and practices persist – at times going against the health, safety and rights of com- munities – across a range of issues, such as water, sanitation and hygiene (WASH), parenting, nutrition, breastfeeding and early childhood development. Social norms that reinforce harmful practices around female genital mutilation (FGM), child mar- riage (CM) and violence against children (VAC), for instance, continue to endanger the health and futures of children around the world, and are leading to long-term physical, psychological and social consequences.
The United Nations Children’s Fund (UNICEF) has a critical role to play in promoting positive social norms, putting rights-based, culturally sensitive, social norms change at the centre of programme strategies, and working with governments to put in place viable national response systems for addressing harmful practices.
These efforts will only be successful when they are based on clear understanding of social norms. In recent years, new tools and methods have emerged for researching social norms change, but many focus on quantitative techniques or traditional qualitative methods that are driven by the researcher. One exception is the ‘ACT Framework for Measuring Social Norms Change Around FGM’, which has been developed as part of the UNFPA-UNICEF Joint Programme on the Elimination of Female Genital Mutilation Accelerating Change, which includes a number of participatory research tools. Consultations as part of the ACT Framework devel- opment led to the realization that a toolkit of participatory activities, which could be applied to any social norms issue, is missing in the present universe of social norms research tools.
In response, this toolkit brings together participatory research tools that have been tried and tested, not only within UNICEF, but also academic institutions, non-gov- ernmental organizations, and United Nations agencies, and further refined through expert consultations. These tools are issue agnostic and can be used be used for a broad range of issues, including nutrition, parenting, gender socialization and protection, and are particularly relevant for social norms change around harmful practices, such as FGM and child marriage. The tools can also be used across the programme cycle, providing pathways for communities to identify issues collectively and gain consensus, for children to safely express their experiences on issues of health and other sensitive topics, and for communities to serve in accountability roles and track changes over time.
We hope that country offices, governments, partner agencies, researchers and anyone working in the area of social norms change will find these tools useful and that they will help position community members’ experiences at the centre of social norms research and programming.
foreword
Cornelius Williams
Associate Director of Child Protection,
C4D CM FGM M&E MHM SBCC
UNICEF
UNFPA VAC WASH Communication for Development
Child Marriage
Female Genital Mutilation Monitoring and Evaluation Menstrual Hygiene Management Social and Behaviour Change Communication
United Nations Children’s Emergency Fund
United Nations Population Fund Violence Against Children Water Sanitation and Hygiene
acronyms
table of contents
Acknowledgements Foreword
Acronyms List of Figures List of Tables Overview
° Purpose and Scope of the Toolkit
° Who Should Use This Toolkit?
° How to Use This Toolkit
° Why Use Participatory Methods?
Defining Social Norms
° Key Definitions The Tools Body Mapping
° When to Use This Method
° Practical Examples
° Conducting the Activity
° Analysing the Data
° Interpretation
Cannot Do, Will Not Do, Should Not Do
° When to Use This Method
° Practical Example
° Conducting the Activity
° Analysing the Data
° Interpretation Complete-the-Story
° When to Use This Method
° Practical Example
° Conducting the Activity
° Analysing the Data
° Interpretation
03 04 05 08 08 10 10 10 12 12 14 15
18 19 19 22 23 23 24 25 25 26 28 28 29 29 30 31 33 33
34 34 34 37 38 38 39 39 39 40 42 42 43 43 43 44 45 45 46 47 47 48 50 50 51 52 52 53 55 55 56 56 57 59 61 62 63 16
Free Listing
° When to Use This Method
° Practical Example
° Conducting the Activity
° Analysing the Data
° Interpretation Gender Boxes
° When to Use This Method
° Practical Example
° Conducting the Activity
° Analysing the Data
° Interpretation Gender Jumble
° When to Use This Method
° Practical Example
° Conducting the Activity
° Analysing the Data
° Interpretation Lifeline
° When to Use This Method
° Practical Example
° Conducting the Activity
° Analysing the Data
° Interpretation
Social Network Mapping
° When to Use This Method
° Practical Example
° Conducting the Activity
° Analysing the Data
° Interpretation
2x2 Tables for Social Norms
° When to Use This Method
° Practical Example
° Conducting the Activity
° Analysing the Data
° Interpretation References
Figure 1 Figure 2
Figure 3
Figure 4 Figure 5
Figure 6
Figure 7
Figure 8 Figure 9
Figure 10 Figure 11
Figure 12
Figure 13
Figure 14
Figure 15
Figure 16
Figure 17
Figure 18 Figure 19
Figure 20
Figure 21
Figure 22
Figure 23 Figure 24
Figure 25
Figure 26 Figure 27
Figure 28
Figure 29
Figure 30
Figure 31 Figure 32 Figure 33
Table 1 Table 2
Table 3
Table 4
Table 5 Table 6
Table 7 10
10
11
12 13
14
19
21 21
24 25
27
29
30
30
35
35
36 36
39
40
43
43 46
47
48 52
53
58
59
60 60 62
15 16
18
20
35 48
57 Sections of the toolkit
Examples of UNICEF initiatives that have employed participatory research methods
Opportunities in the programme cycle to use participatory research and reasons to use this toolkit
Steps for adapting this toolkit Benefits of using participatory research methods
Requirements for a social norm to exist
Life-sized body map from Jamaica
Body map images used in Guinea Body Mapping results
from Ethiopia
Types of behavioural restrictions Cannot Do, Will Not Do, Should Not Do results from rural India Definitions – Cannot Do, Will Not Do, Should Not Do
Examples of vignette probing questions by measurement topic Inclusive education vignette results from Macedonia Complete-the-Story results from Ethiopia
Free Listing results from rural India
Free Listing results from Jamaica
Free Listing results from Ethiopia Free Listing categorization results from Ethiopia
Example of Gender Boxes
Gender Boxes results from Ethiopia
Example of Gender Jumble diagram and images
Gender Jumble data from India Example of a completed Lifeline diagram
Lifeline diagram from the ACT Framework
Lifeline results from Ethiopia Social Network Mapping completed by girls in rural India Social Network Map
diagram based on the social ecological model
Approval and behavioural expectation tables from Ethiopia Rewards and sanctions for FGM continuation/abandonment in Ethiopia
Approval 2x2 Table diagram Behaviour 2x2 Table diagram Meaning of quadrants on the approval and behaviour tables
Definitions of key constructs Using participatory activities to measure social norms Types of body maps and what they measure
Body Mapping results from Jamaica
Free Listing results from Jamaica Lifeline FGM results
from Ethiopia
2x2 Table results from adolescent girls in rural India
list of figures and tables
Figure 1. Sections of the toolkit
overview
Participatory research methods empower and encourage participants to discuss complex and sensitive topics in engaging ways that can complement traditional research methods. In this Participatory Research Toolkit for Social Norms Measurement, nine participatory tools are introduced and an explanation of what each of them mea- sures is given.
Examples of how they have been used are also included and instruc- tions for their use are given. Finally, suggestions are given for analysis of the data produced by the tools to qualitatively measure social norms (see Figure 1).
This toolkit is a practical ‘how to’ document for researchers, programme planners, programme imple- menters and evaluation experts, and is intended to enhance their social-norms-related efforts. By including examples from a variety of social and behaviour change initiatives that have successfully incorporated these methods into measuring social norms, this toolkit illus- trates the utility and capacities of each tool (see Figure 2).
Anyone can use this toolkit, regardless of their level of experience with qualitative and participatory research methods. Specifically, programme planners, imple- menters, evaluators, donors and researchers who are focused on social norms and other related factors (e.g., attitudes, behaviour, and social networks) will benefit from using this toolkit.
Data gathered using these tools can be used on their own, or can be used to validate quantitative data and allow for a more holistic interpretation of findings.
Participatory research tools facilitate and engage intended beneficiaries of social norms programming throughout Purpose, scope and
audience of this toolkit
Background on social norms
Nine participatory research tools
PURPOSE AND SCOPE OF THE TOOLKIT
WHO SHOULD USE THIS TOOLKIT?
Many of these tools appear in the ACT Framework – a tool for examining social and behaviour change around FGM – which is being used to evaluate the effectiveness of initiatives under the UNFPA- UNICEF Joint Programme to Eliminate FGM, along with other related issues.
The Girls' Adolescent and Reproductive Rights:
Information for Management and Action (GARIMA) programme has used some of these tools to monitor and evalaute effectiveness. GARIMA is aimed at ending the culture of silence around menstruation and improving menstrual health and hygiene management in India.
Tools from this kit have been used to validate a measurement and evaluation framework to examine stigma and discriminatory social norms children with disabilities in the Europe and Central Asia region.
Figure 2. Examples of UNICEF initiatives that have employed participatory research methods
OVERVIEW
Figure 3. Opportunities in the programme cycle to use participatory research and reasons to use this toolkit
Formative research to understand populations and the social and behavioural factors that should be altered to improve health outcomes
Behavioural monitoring to verify whether
programmatic efforts are moving in the right direction and having the intended results
Evaluation designed to measure the effectiveness of social norms
programming by exploring how change happens for replication and scale-up
Learn about social norms theory
Review how these tools have been used in previous studies Learn how to analyse
data gathered using these participatory methods
Explore data
interpretation and how
data can be used Discover how to use
these participatory methods in your own work Understand the
value of participatory research methods
Examine a number of participatory methods focused on social norms measurement
Kenya
© Geogina Goodwin for UNFPA
OVERVIEW
This toolkit can be used in a variety of ways. We suggest you start with four steps to adapt this toolkit for your needs (see Figure 4).
Once you commit to using the tools described here, create a mechanism to ensure that the information generated is accessible and understandable to all key stakeholders, including programme participants, so that they can utilize the results to improve community-driven programmatic efforts.
Using participatory methods – either on their own or in combination with other quantitative or qualitative research efforts – is ideal for examining social norms, offering several advantages over traditional research methods (see Figure 5).
These tools have been incorporated into communi- ty-based interventions as programme activities that serve a dual purpose of fulfilling programme objectives while also providing behavioural monitoring data to assess programme implementation. This toolkit does not go into detail about how to disseminate and utilize the informa- tion collected through participatory methods. Monitoring behaviours systematically over time means that we do not have to wait before seeing if change is starting to occur. If behaviours are beginning to shift, then we know that our social and behaviour change efforts are working and we are heading in the right direction (towards our ex- pected medium-term outcomes). However, if behaviours are not changing, then there is an opportunity to review and revise the interventions. This creates a feedback loop, where information can be used to adjust our approaches, activities, channels and even messages, so that the programme as a whole is better positioned to reach its expected objectives. Using participatory methods further allows for engaging community members in the research process; these activities therefore become part of an empowerment process, through which community members gain knowledge and skills for the co-creation of knowledge that is frequently transferrable to other contexts and issues.
HOW TO USE THIS TOOLKIT
WHY USE PARTICIPATORY METHODS?
Figure 4. Steps for adapting this toolkit
Develop a theory of change with individual social constructs that need to be measured.
1.
Review which tools will measure which constructs in your theory of change to meet your objectives and results; start with the “Defining Social Norms”
section. You can refer back to the glossary in the
“Key Definitions” section if needed.
2.
Select – read through all nine sections. If you are looking to measure specific constructs only, in “The Tools” section, you will find a list of the components of social norms theory that each tool measures and the ideal context in which to implement them (see Table 1).
3.
Consider and imagine – use the applied
examples highlighted under each tool to consider the circumstances and experiences and imagine the contexts in which they might be applicable to your work.
4.
Burkina Faso
© Luca Zordan for UNFPA
OVERVIEW
Engages participants’
auditory, visual, oral, written and numeric skills
Empowers participants by fostering skill- building and initiatiating critical dialogue
Raises participant consciousness around previously unarticulated behaviors and beliefs
Shifts power from researchers to participants
Enables in-depth examination of the thoughts, beliefs and practices of participants
Allows participants to take on various roles in the design, implementation, analysis and distribution of data
Determines the assets and needs of community- based issues that are important and relevant
to participants
Provides input into culturally relevant indicators Figure 5. Benefits of using participatory research methods
Ethiopia
© UNICEF/UN0140825/Mersha
Individuals are motivated to follow norms because of outcome expectancies; i.e., the benefits and/or social sanctions they expect to receive for adhering or not adhering to a norm (Mackie et al., 2015). According to some scholars, social norms and social and behaviour change are interrelated. Using a socio-ecological perspec- tive situates individuals within their broader environment and builds upon the human rights-based approach, to focus on intersectional issues such as gender and religion (Kincaid et al., 2007).
Recent interest in social norms interventions has resulted in social-norms-specific conceptual models. The Flower for Sustained Health Model is one such conceptual model that illustrates how resources and individual, social, and institutional factors shape social and gender norms (Cislaghi and Heise, 2017; Institute for Reproductive Health, 2019). Another recent model, Everybody Wants to Belong, provides a broad approach for understanding the complexities behind how social norms persist and how change can best happen. It addresses multiple social norms components, grouped into sociological factors that affect psychological factors (attitudes, cognitive bias and self-efficacy) and the adoption of new behaviours and actions (Petit and Zalk, 2019).
Despite growing popularity, there has been little global progress in producing evidence-based measures for evaluating whether social norms work is having its intended impact. Some recent guidance has addressed this measurement gap (Institute for Reproductive Health, 2019). However, these guides mostly focus on quanti- tative techniques; much of the measurement literature does not use participatory research as a technique to understand and evaluate norms.
One exception is the conceptual model for the ACT Framework, released as part of the UNFPA-UNICEF Joint Programme on the Elimination of Female Genital Mutilation Accelerating Change in December of 2020, which ad- dresses FGM-related social norms. ACT highlights that social norms have a bidirectional relationship with knowl- edge, beliefs and attitudes; social networks; and social support. It assumes that norms impact social and behaviour change and vice versa. The model takes a socio-ecological perspective, accounting for the effects of gender and power contextual factors on all constructs. Communication approaches for social norms change are included within the ACT model, highlighting its potential use as a monitoring and evaluation tool to examine the effectiveness of commu- nication interventions (UNICEF 2019; Sood et al., 2020).
For a deeper discussion of social norms theory and con- cepts, please see the literature review that is included in
DEFINING
SOCIAL NORMS
Although it may seem that our attitudes and practices are decided independently, our thoughts and actions are often socially motivated.
Social norms are the unwritten rules guiding behaviour; they encom- pass what we do, what we think others do and what we think others believe that we should do (World Health Organization [WHO], 2010).
There are two conditions that must be satisfied for a norm to exist (see Figure 6; Bicchieri, 2006, 2017; Mackie et al., 2015).
Figure 6. Requirements for a social norm to exist
Condition 1 Condition 2
Individuals must be aware of the norm and believe that it applies to them.
Individuals expect that a majority of their social network conform to a norm and they believe that a sufficiently large part of their social network thinks they ought to conform.
DEFINING SOCIAL NORMS
Key definitions from social norms theory can be referred back to as you review individual tools and the constructs they measure (see Table 1).
KEY DEFINITIONS
Key terms
Attitude Value judgements and feelings towards something. Attitudes may agree with actions, or be counter to them; they influence but do not determine behaviours (Mackie et al., 2015).
Descriptive norms Beliefs about what others do; beliefs about the prevalence of a given behaviour (Lapinski and Rimal, 2005; Mackie et al., 2015).
Gender norms Social norms that are interdependent on the conceptualization of gender within a given society.
Injunctive norms Beliefs about what others expect us to do; beliefs about pressure to comply with what others do (Ajzen and Fishbein, 1980; Lapinski and Rimal, 2005; Mackie et al., 2015).
Behavioural expectations The social rewards and social sanctions expected from performing or not performing a certain behaviour (Bicchieri, 2006; Mackie et al., 2015).
Personal norms Essentially, an attitudinal norm; a norm one follows based upon one’s own
motivation and not the influence of others (as in social norms) (Mackie et al., 2015).
Personal restrictions A restriction that is followed out of one’s own volition; an internally motivated restriction that is not dependent on structural barriers or social norms.
Reference groups The people with whom we compare ourselves and whose opinions matter to us when making decisions and forming attitudes (Mackie et al., 2015).
Social ecological model The theory that an individual’s attitudes, beliefs and behaviours are influenced by (and in turn influence) those of their family, peers, community, institutions and society as a whole (Kincaid et al., 2007).
Social networks The people with whom a person interacts. Social networks can be mapped and studied to understand relationships and the exchange of messages between individuals, and within groups, organizations and societies (Ulin et al., 2005).
Social norms Informal social rules and expectations, shared among a population, which guide behaviour (Mackie et al., 2015). Social norms essentially comprise what we do, what we think others do, and what we believe others think we should do (WHO, 2010).
Structural barriers External environmental, organizational and/or systemic obstacles that prevent people from performing certain behaviours (Mackie et al., 2015; WHO, 2008).
Table 1. Definitions of key constructs
the tools
This toolkit outlines information on nine participatory research
activities to measure social norms and related constructs. All of these activities can serve a formative research, monitoring or evaluation function (see Table 2).
Tool How it measures social norms Ideal context Body Mapping ° Maps knowledge, attitudes and
behaviours regarding the body
° Maps knowledge, attitudes and behaviours regarding the body
° Sheds light on normative beliefs and practices
Useful for answering research questions around the body and mind, to assess the state of the physical and psychosocial self, both in general and specifically to certain circumstances or behaviours.
Cannot Do, Will Not Do, Should Not Do
Defines the extent to which behaviours are driven by:
° Social norms (expectations of others)
° Personal norms (one’s own choice)
° Environmental barriers (not a choice or norm; something one cannot do because the environment prevents it)
Used with a set of behaviours of interest (within a particular domain or generally) to determine if they are considered structural barriers, personal norms or social norms.
Complete-the-Story ° Identifies and describes what behaviours and practices are normative
° Measures attitudes around a specific topic
Used for discussing sensitive topics where participants may be reluctant to disclose information on their personal attitudes and actions.
Free Listing ° Reveals the different types of norms that impact specific behaviours
Used for insight into how participants conceptualize a concept or construct as well as the terminology and
categorization participants use in relation to that concept or construct.
Gender Boxes and Gender Jumble
° Measures gender norms
° Examines how gender impacts attitudes and behaviours
Used with research questions concerning the existence, nature and influence of gender norms.
The following section provides detailed information on each tool, with information on what the method is, how it has already been used, and how it can be adapted for your research needs, including data analysis and interpretation.
Table 2. Using participatory activities to measure social norms
THE TOOLS
Lifeline ° Identifies normative cultural practices
° Provides a timeline to determine when key events occur
° Helps identify the importance of these practices
Useful in answering research questions about using a life-course perspective to identify important life events.
Social Network Mapping
° Visually represents reference groups across different levels of the social ecological model
° Categorizes reference groups by level of trustworthiness, as well as allies and barriers to specific practices
° Identifies norms that are held in place by perceptions about approval, practices and expectations of people whose opinions matter
Used to understand the flow of
communication, levels of social support and the types of people who hinder or further the flow of messages across the network.
2x2 Tables for Social Norms
° Describes the existence and nature of social norms
° Allows the components of social norms (injunctive and descriptive norms, behavioural expectations, attitudes, and social rewards and sanctions) to be measured individually and compared so norms can be understood on a deeper level
° Identifies perceptions of rewards and sanctions
° Allows participants to reflect on the extent to which their opinions and actions are driven by others
Used for a multitude of topics and contexts to specifically measure whether social norms are at play and if so, what these social norms are, how prevalent they are and how they can be best addressed programmatically.
Tanzania
© Gonzalo Bell for UNFPA
BODY
MAPPING
Body Mapping involves the use of visual aids to assess knowledge, af- fective factors and behaviours concerning the body and mind (de Jager et al., 2016). The visual aids used can take many forms. Body maps can be provided to participants or drawn by the participant themselves (de Jager et al., 2016). Either way, the body map provides a visual aid to prompt the participant to answer a series of questions about what different parts of the body experience in a situation of interest (see Table 3; de Jager et al., 2016).
Type of body map Description What it measures
Life-sized body outlines Participants fill in the blank life- sized body map with words and drawings related to different aspects of their lives (de Jager et al., 2016).
° Embodied awareness
° Relations of self to others
° Life experiences
° Psychosocial factors
° Affective factors
Anatomical diagrams Anatomically correct images of different body parts are shown to participants as a visual aid (Orchard, 2016).
° Physiological knowledge
Sensory body maps Images of the body (which can be realistic, or just outlines) are used to ask participants what different parts of the body, the mind and the heart feel and experience in a given situation.
° Psychosocial factors
° Affective factors
° Behaviours Table 3. Types of body maps and what they measure
Body maps help initiate discussions about the participant’s perspec- tives, values and desires concerning the body. More than one type of body map can be used in research to measure both physiological knowledge and psychosocial factors, which are often overlooked as posing serious risks to children’s health and well-being. Measuring both physiological and psychosocial factors allows us to understand the subtle nuances of how the body and mind are impacted by the research topic, and give us a more complete picture. Data from Body Mapping can provide insight into normative practices and how they affect, and are affected by, knowledge, attitudes and behaviours around the body.
BODY MAPPING
To use Body Mapping, the research topic must have a physical or psychological component that researchers seek to understand. Use anatomical maps if you are only interested in evaluating knowledge of body parts and functions. Use life-sized and sensory body maps when looking at the experiences of the body regarding the research topic. Life-sized body maps require more time to complete because participants fill in a large body outline.
The data can also be more varied because participants are free to draw and write whatever comes to mind when they are given a prompt. Sensory maps are more targeted, using the image to point to different body parts, such as the eyes, nose, ears, mind and heart, to ask what they sense, think and feel in a certain situation.
WHEN TO USE THIS METHOD PRACTICAL EXAMPLES
Violence against children
In this example from Jamaica, children filled out life-sized body maps as an activity in focus group discussions, to understand their experiences with, and the effects of, cor- poral punishment (see Figure 7).1 The children drew the outline of the body on a large sheet of paper, then were taken through a vignette about a child who misbehaved and was going to be physically punished. The children coloured in their body maps according to the different body parts involved and the sensations experienced when being punished physically. They reflected on the psycho- social consequences of corporal punishment and added these to their body maps. Probing questions guided the children to fill in the body map from multiple viewpoints to elicit differences and similarities in experience. The activity concluded with the children describing how adults and children could act differently concerning corporal punishment (see Table 4).
1 Please contact the author, Suruchi Sood ([email protected]), for more information on positive discipline research in Jamaica.
Figure 7. Life-sized body map from Jamaica
Jordan
© UNICEF/UNI394982/El-Noaimi
BODY MAPPING
Question or Experience
Response
Boys Girls
Vignette Shamar, a boy, is hungry. His mom prepared lunch and he sneaks into the kitchen and takes a piece of chicken. His mother catches him.
Emma was out with her boyfriend in the community. A neighbour saw them and told her mother and father.
See That his mother is vexed. Her parents punishing her.
Hear Indecent words: “ugly,” “no sense,” “thief.” ° Curse words
° Mother saying not to have a boyfriend
Say “Sorry mummy I won’t do it again, I was hungry. I will be a better child.”
° Silent
° “Okay, I’m not coming back to this house!”
Think ° He is going to get a beating
° He is afraid
° Mother is going to kill me
° That her parents don’t love her
° She can’t go back to the house
Feel Fast heartbeat, upset and short of breath. Sad and angry.
Stomach experience
Burning belly, grumbling and wanting to cry.
Hurt, bad and funny feelings
Hands and feet do
° Trembling
° Start to run
° Fights back
° Runs away
What could children do differently?
Shamar should ask before taking. ° Explain to the parents what happened
° Apologize/say sorry
What could adults do differently?
Talk to him instead, ask him why he took it and tell him its wrong and warn him.
° Talk to her instead of beating her
° Grab her collar and talk to her
° Talk to her privately Table 4. Body Mapping results from Jamaica
BODY MAPPING
Figure 8. Body map images used in Guinea Female genital mutilation
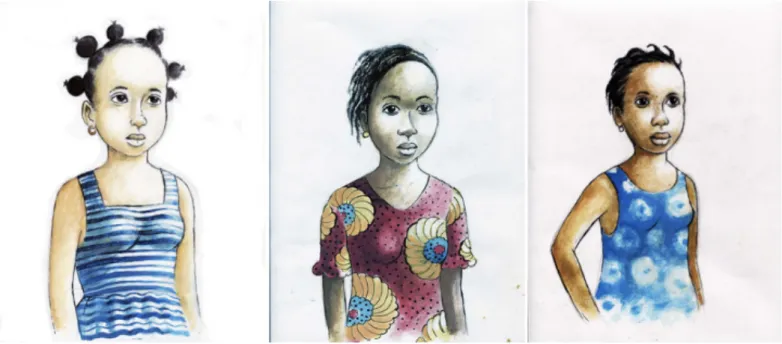
Body Mapping is included in the focus group discussion tool of the ACT Framework to measure social and behaviour change around FGM in countries supported by the Joint Programme. Participants in Ethiopia and Guinea were shown an image of a girl that looks like a ‘typical’
girl in their community (see Figure 8). They were asked questions about what the girl would feel, think and sense while undergoing FGM. The data were used to examine the physical and psychosocial risks of FGM, as well as social norms concerning the practice.
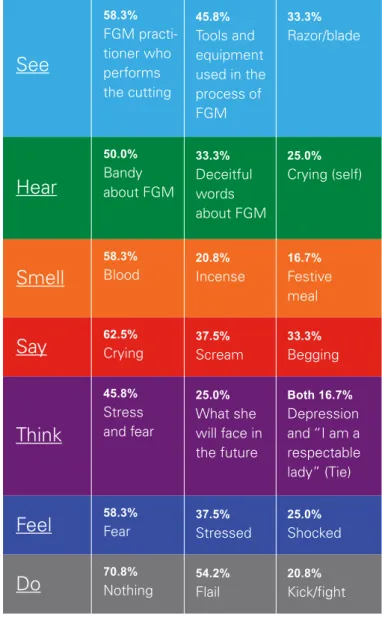
Findings from 195 participants in Ethiopia showed that the most commonly reported negative physical and psy- chosocial consequences of FGM were pain, screaming, fear and deceitful words. There were some positive responses, such as the thought that they are now a re- spectable lady, highlighting the social importance of being cut to secure a good reputation and the coming-of-age nature of the practice. The activity captured data on the ceremonial aspects of FGM and the way in which it is performed. For example, incense is used during the ceremony and it is coupled with a festive meal in some areas. A razor blade was the most common tool seen and a traditional practitioner was the person who was most often seen performing the cutting. These data, therefore, revealed attitudes, social norms and behaviour around the act of FGM (see Figure 9).
Figure 9. Body mapping results from Ethiopia
58.3%
FGM practi- tioner who performs the cutting
50.0%
Bandy about FGM
45.8%
Stress and fear 58.3%
Blood
62.5%
Crying
58.3%
Fear 70.8%
Nothing
45.8%
Tools and equipment used in the process of FGM 33.3%
Deceitful words about FGM
25.0%
What she will face in the future 20.8%
Incense
37.5%
Scream
37.5%
Stressed 54.2%
Flail
33.3%
Razor/blade
25.0%
Crying (self)
Both 16.7%
Depression and “I am a respectable lady” (Tie) 16.7%
Festive meal 33.3%
Begging
25.0%
Shocked 20.8%
Kick/fight
See
Hear
Think Smell Say
Feel
Do
BODY MAPPING
° Start by showing participants the body map.
It is helpful to have them first describe what the typical person (i.e., girl, boy, woman, man, etc.) is like. You could have them choose a name for the body map. This introduction gets them thinking about the ‘typical’ person’s experience and discour- ages them from responding as though about themselves.
° Explain that you will be asking how this person feels and what they think in the particular context. Tell them that there are no right or wrong answers, and that you just want to know their ideas.
° Go through the following questions about each of the participant’s senses, thoughts and feelings. When asking each question, point to the body part it relates to on the sensory body map.
° What do his/her eyes see?
° What do his/her ears hear?
° What does his/her mouth say?
° What does his/her mind think?
° What does his/her heart feel?
° What does his/her stomach experience?
° What do her/his hands and feet do?
° Ask probing questions, which should be determined by your team. They can range from simple questions such as, “why?”
to complex questions such as how these feelings and experiences would differ in other circumstances. The body maps can be used to:
° Reflect on the benefits and drawbacks of cultural practices
° Think about how things in the partici- pants’ lives could be changed to improve the outcomes on the body map
° Compare with other body maps that have been completed at different time points
There are unlimited options for probes, but keep in mind the time restrictions and the ultimate research and programme goals. Participatory research can be very empowering, so take the opportunity to have participants discuss items that help to further the programme’s goals.
° Thank the participants for their time and effort.
° Ensure you have the Body Mapping data transcribed and transfer it for safe-keeping.
1. 4.
2.
5.
3.
6.
Body Mapping can be used in both one-on-one interview and focus group discussion formats. The following instructions are for conducting Body Mapping in a focus group context. To adapt it for a one-on-one interview format, the group discussion may be eliminated; instead, the questions can be phrased as open-ended, for the participant to respond to in his or her own words. In this example, sensory body maps are used. If the life-sized body maps are being used, however, the questions can be broader; e.g., ask the group or individual to explain what they drew and why and how what they drew relates to the research topic. The anatomical body maps focus on knowledge of factual information. The questions, therefore, would be about naming the parts or processes depicted in diagrams. The same general process in the example below can be adapted to these different types of maps, although the content of the questions would differ.
CONDUCTING THE ACTIVITY
Djibouti
© UNICEF/UN0199039/Noorani
BODY MAPPING
1.
2.
3.
4.
° Divide data into groups based on participant characteristics, for analysis (i.e., gender, age, socio-economic status, intervention-control, etc.)
° Determine the frequency of responses for each sense
° Identify and report the most common responses for each sense
° Transcribe the responses to your chosen probes and conduct thematic analysis;
report the most common themes and any particularly interesting or telling themes
Life-sized body maps
Interpretation of data will vary greatly depending on the exact questions used. For a hybrid format such as in the example from Jamaica, where sensory body-map ques- tions were used with the life-sized body map activity, then the interpretation will combine that of sensory body maps (discussed below) and the wider interpre- tations of what participants drew and what it means concerning embodied awareness, relations to the self, life experiences, and psychosocial and affective factors.
Interpretation will generally consist of developing a list of themes among all the body maps that have been anal- ysed and interpreting the meaning behind these themes and how they affect normative factors.
Anatomical body maps
For anatomical body maps, data interpretation is limited to measuring the level of factual knowledge concerning the bodily parts and processes that the anatomical maps represent. These data are best interpreted in combination with the more qualitative data provided from the life-sized body maps and sensory body maps to compare how physiological knowledge interacts with psychosocial and experiential factors.
Sensory body maps
Sensory body map interpretation will focus on com- paring and contrasting the senses and experiences described by participants. The factors by which groups are compared – e.g., age, religion, ethnicity, residence – should be determined, because these may affect the findings. Results should be compared with other data on behaviour, knowledge (including the anatomical body map data), attitudes and social norms, to highlight how the psychosocial and physiological effects on the body, as measured by the sensory body maps, interacts with these factors. These data can shed light on the nature of cultural practices, and can be used in future research to understand how practices are evolving over time, and are influenced by programmatic activities.
ANALYSING THE DATA
INTERPRETATION
Tanzania
© Gonzalo Bell for UNFPA
When the behaviour is classified as something they participant cannot do, it is a structural barrier; the environment or other circumstances they cannot control prevents them from acting out the behaviour (Mackie et al., 2015). For example, they might classify a practice as something they cannot do for financial and availability reasons. It is not a choice or a norm; their environment simply does not facilitate it.
When the behaviour is classified as something they will not do, it is a personal restriction, which is a type of personal norm (Mackie et al., 2015). The participant does not perform the behaviour by their own volition.
It is not due to structural barriers or social norms, it is their own choice.
When the behaviour is classified as something they should not do, it is a normative restriction, which is a type of social norm. The word ‘should’ indicates social influence. The participant believes that they should not do the behaviour because of pressure (both conscious and unconscious) to follow social norms (Mackie et al., 2015).
Cannot Do, Will Not Do, Should Not Do allows partici- pants to reflect on the reasons that restrictions on certain behaviours exist. Probing questions challenge participants to consider how restrictions can be over- come. Raising awareness of restrictions is critical to fostering social and behaviour change. Proposing solu- tions can be an empowering experience for participants, providing them with practical ways to eliminate restric- tions from their own lives.
Behavioural restrictions
CANNOT DO, WILL NOT DO, SHOULD NOT DO
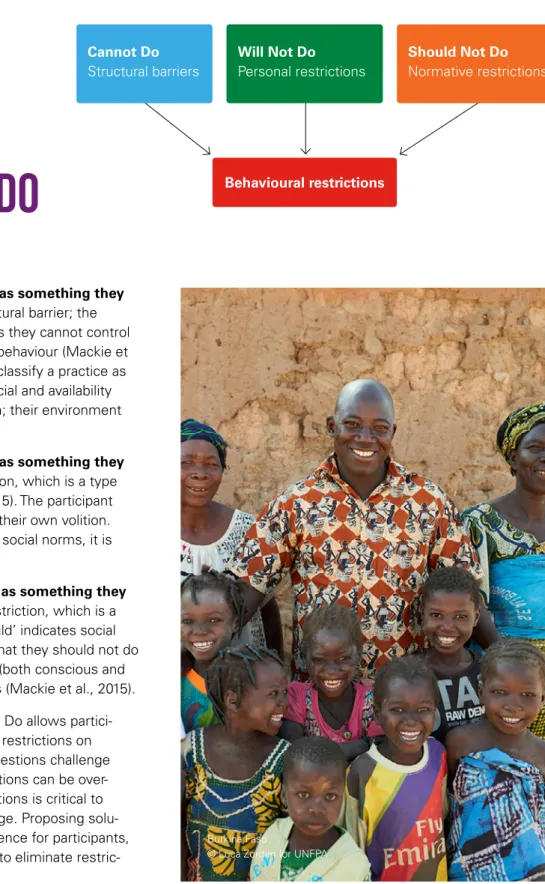
In the Cannot Do, Will Not Do, Should Not Do activity, participants categorize a series of behaviours as things they cannot do, will not do or should not do (see Figure 10). These data shed light on why participants are restricted from enacting these behaviours.
Burkina Faso
© Luca Zordan for UNFPA
Figure 10. Types of behavioural restrictions
Cannot Do Structural barriers
Will Not Do Personal restrictions
Should Not Do Normative restrictions
CANNOT DO, WILL NOT DO, SHOULD NOT DO
India
© UNICEF/UN062025/Vishwanathan
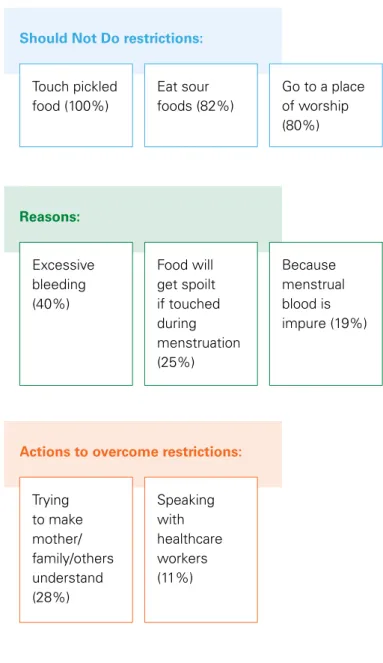
Figure 11. Cannot Do, Will Not Do, Should Not Do results from rural India
Cannot Do, Will Not Do, Should Not Do should be used to examine restricted behaviours. This activity will not be effective if the population engages in the behaviour, since the purpose is to categorize the reasons why they do not do it. Likewise, this activity should be focused on behaviours that the programme indicates should increase among the population, e.g., health-promoting behaviours such as hand washing and safe sex practices.
Menstrual health and hygiene management Certain behaviours are restricted during menstruation for girls in rural India. These restrictions relate to the food that is eaten, clothing that is worn, places that are attended and participation in religious activities. Many of these restrictions are long-standing historical taboos that are still followed today, which affect girls’ rights and perpetuate harmful beliefs and norms around menstru- ation. The Girls’ Adolescent and Reproductive Rights:
Information for Management and Action (GARIMA) programme aimed to improve menstrual health and hygiene management practices by increasing commu- nication around menstruation to break the silence and taboos around it (UNICEF, 2018). The GARIMA evaluation included the Cannot Do, Will Not Do, Should Not Do activity in focus group discussions with adolescent girls (UNICEF, 2018).
Girls were presented with a series of behaviours traditionally considered taboo during menstruation including entering a temple, praying, going to a wedding, wearing certain types of clothing and eating sour foods.
The girls categorized each behaviour as something they cannot do, will not do or should not do, then described why they categorized it as such. For all behaviours classified as things they should not do, they were asked whether they do the behaviour despite the ‘should not’
restrictions. This reveals which normative restrictions are being challenged.
The data suggested that traditional taboos related to menstrual blood being perceived as impure are still pervasive. The restrictions were common despite high levels of knowledge about the physiological and biological processes of menstruation, indicating that these beliefs are normative (see Figure 11).
WHEN TO USE THIS METHOD
PRACTICAL EXAMPLE
Should Not Do restrictions:
Actions to overcome restrictions:
Reasons:
Touch pickled food (100%)
Trying to make mother/
family/others understand (28%) Excessive bleeding (40%)
Eat sour foods (82%)
Speaking with healthcare workers (11%) Food will get spoilt if touched during menstruation (25%)
Go to a place of worship (80%)
Because menstrual blood is impure (19%)
CANNOT DO, WILL NOT DO, SHOULD NOT DO
Cannot Do, Will Not Do, Should Not Do can be conducted in both the one-on-one and focus group discussion contexts. The following instructions describe conducting the Cannot Do, Will Not Do, Should Not Do activity in focus group discussions. For one-on-one interviews, the process will be the same, replacing the discussion component with open-ended questions that the individual responds to.
First, decide how to generate the list of behaviours in the domain of interest, which are generally restricted among the population. You can use formative research and pretesting to develop and verify the list or participants can free list (see “Free Listing” section below) behaviours within the specific topic area at the beginning of the ac- tivity. Once the list of behaviours is created, participants will classify them into the cannot do, will not do or should not do categories.
When deciding what restrictions to categorize, consider domains that are pertinent to the population. In the GARIMA evaluation example above, the domains were:
clothing, religious, mobility and food restrictions; each domain then contained a set of restrictions that were discussed. For example, under the “social and religious”
domain, girls were asked whether they could: (1) attend temple; (2) touch a holy book; and (3) attend wedding ceremonies when menstruating. During data analysis, disaggregation of results by domain (i.e., clothing, religious, mobility, etc.) can determine which domain as a whole is most pertinent, in addition to which individual restrictions are most pervasive.
The following example uses the Free Listing technique to have participants name restrictions. The process for using a previously developed list of restrictions is the same, except participants are given the behaviours to classify.
There are benefits and drawbacks to having a previously developed list. Mainly, it limits the responses and is subject to bias by researchers that potentially omits key restrictions participants may have identified. However, using a previously developed list saves time during the discussion. We suggest using a researcher-developed list in the one-on-one interview context – with probes for adding additional restrictions – and using the free listing approach in groups.
CONDUCTING THE ACTIVITY
° Introduce the activity by explaining that you will be asking about a series of behaviours and whether participants cannot do, should not do, or will not do the behaviours. If there is a specific context that affects these re- strictions, explain this context to participants as well. Remind participants that there are no right or wrong answers; you just want to know their ideas.° Define each category, after ensuring that the definitions have been pretested for clarity (see Figure 12). Explain that the participant has to classify each behaviour into one of these categories.
° If needed, go through an unrelated example with participants to verify that they under- stand the meaning of the categories. This improves data accuracy and is especially important for younger participants.
° Begin the activity by having participants free list things that they do not do around the topic of interest (insert the specific context if relevant). Record all responses on a large sheet of paper.
° Optionally, use the domains you have chosen as probes. For example, “what about mobility restrictions? Are there any mobility restric- tions you face?” and so on.
° Once all responses have been given, ask par- ticipants to classify their responses as things they cannot do, should not do, or will not do.
Choose a different-coloured writing utensil for each category and circle responses in the appropriate colour as they are categorized.
Remind them of the definitions as needed (see Figure 12).
° Once all responses are categorized and circled in the respective colours, ask partici- pants which restrictions classified as “should not do” that they do anyway. Underline the restrictions named. The underlined restric- tions represent norms that participants are actively challenging.
1.
2.
3.
4.
5.
6.
7.
CANNOT DO, WILL NOT DO, SHOULD NOT DO
° Ask participants to identify which of the restrictions named is the most common and/or most influential.
° Have participants discuss why the most common and/or influential restriction exists.
Probe for what actions they have taken to overcome the most common and/or influen- tial restriction. If time allows, use this probe for any other restrictions of interest. Add or modify this probe to meet your research goals, keeping time restrictions in mind.
Remember that participatory research can be very empowering, so take the opportu- nity to have participants discuss things that help achieve the programme’s goals.
° Thank the participants for their time and effort.
° Ensure you have the Cannot Do, Will Not Do, Should Not Do data transcribed and transfer it for safe-keeping.
8.
9.
10.
11.
Figure 12. Definitions – Cannot Do, Will Not Do, Should Not Do
Something you cannot do that is beyond your control; something you cannot do because you have no choice.
Something you choose not to do because you do not want to, not because you can’t and not because of what others think or do.
Something you think or believe you should not do because of what others would think or do.
Cannot Do
Will Not Do
Should Not Do
Ethiopia
© UNICEF/UN0140848/Mersha
CANNOT DO, WILL NOT DO, SHOULD NOT DO
° Divide data into groups based on partic- ipant characteristics, for analysis (i.e., gender, age, socio-economic status, intervention-control, etc.)
° Specifically, analysis by gender reveals im- portant information regarding gender roles and responsibilities, as well as freedoms and restrictions.
° Determine the frequency of restrictions overall and report the most common.
° Calculate and report the number and frequency of restrictions in each domain (if used) and report the total number, as well as the most common, in each domain.
° Determine the frequency of each restric- tion by category (cannot do, should not do, will not do) and report the most common cannot do, will not do and should not do restrictions. Note: if you used specific domains, do this by domain.
° Of the should not do restrictions, report how many were things they do anyway (underlined), overall and by domain, if applicable.
° Determine the frequency of the most common/influential restrictions named and report the most common.
° Conduct thematic analysis of the data from the probes and report the most common reasons for why the restrictions exist and actions taken against the restrictions.
In addition to the most common, report anything particularly telling or insightful.
ANALYSING THE DATA INTERPRETATION
1.
2.
3.
4.
5.
6.
7.
8.
Interpretation of data is straightforward; it consists of identifying which restrictions are structural barriers, personal norms and social norms and which of these are most pervasive in order to inform strategic programmatic decisions. Categorizing behaviours as structural barriers, personal restrictions and normative restrictions outlines the types of programmatic efforts needed to affect change. If structural barriers are present, the programme must focus on eliminating the barriers, so people are able to perform the behaviour. When personal restrictions are present, the programme should focus on attitudinal change on a more individual level. Alternatively, when social norms are behind restrictions, programmes need to address normative factors from multiple vantage points, including addressing personal attitudes and knowledge levels, increasing communication about the behaviour, and altering injunctive and descriptive norms around the behaviour on a micro- and macro-level. Social norms categorized as things participants do anyway can represent normative change when measured over time, as well as highlighting which norms programmes can focus on as they are already being actively challenged.
Overall, Cannot Do, Will Not Do, Should Not Do data help programme planners to allocate resources based on the predominant limiting factors to the behaviours of interest.
Mali
© UNICEF/UNI81552/Pirozzi
COMPLETE- THE-STORY
The Complete-the-Story activity involves the use of vignettes: short stories that are read aloud, shown in a series of images or played on video (Barter and Renold, 1999; Finch, 1987; Hughes and Huby, 2004).
Participants answer a series of questions to “complete-the-story” by describing their reaction and stating what comes next in that situation (Barter and Renold, 1999; Hughes and Huby, 2004). The vignettes mirror reality so participants can relate to them while maintaining personal distance; they are not asked about themselves, but the characters in the vignette (Finch, 1987). In this way, Complete-the-Story allows researchers to broach sensitive topics because participants respond indirectly, instead of with their own experience with the vignette topic(s) (Finch, 1987; Pedersen, 2010; Vlassoff et al., 2000). Participants’ re- sponses reveal their attitudes and behavioural intentions without having to explicitly state their own views, values and behaviours, which can provide richer data (Finch, 1987; Pedersen, 2010; Vlassoff et al., 2000).
In order to conduct the Complete-the-Story activity, there must be a behaviour or situation of interest to researchers. The vignette must be written so that participants can complete the story, i.e., say what the characters in the vignette should do, think, say or feel in that situation. Beyond this requirement, the topics of vignettes and the potential use of the Complete-the-Story activity are varied and numerous. Complete-the-Story data can shed light on knowledge, affective factors, behaviour and social norms. Exactly what is measured will depend on the probing questions selected after the vignette is read, as well as the situation discussed in the vignette itself (see Figure 13).
WHEN TO USE THIS METHOD
Figure 13. Examples of vignette probing questions by measurement topicKnowledge
Behaviour Affective factors
Social norms
Factual questions related to the scenario
What will the characters do?
What do you feel about this situation?
What do the characters feel?
What should the characters do?
What do others in the population think the characters should do?
What do others in the population think the right thing to do is?
Do others in the population approve or disapprove of [enter behaviour]?
Burkina Faso
© Luca Zordan for UNFPA
COMPLETE-THE-STORY
Discriminatory social norms against children with disabilities
In the development of a monitoring and evaluation frame- work to track and assess the results of interventions aimed at changing discriminatory attitudes and social norms towards children with disabilities in Europe and Central Asia, vignettes were critical to include in the tools because not all participants had experience interacting with children with disabilities (Sood, et al., 2019). The vignettes described a child with either a physical or an intellectual disability and adult participants were probed to reflect on what they would do regarding institutionalization, human rights abuse and inclusive education using the questions outlined in the
“2x2 Tables for Social Norms” section below. The attitudes and behavioural intentions of these adults regarding institutionalization, human rights and inclusive education were revealed and examined holistically to determine levels of stigma and social norms.
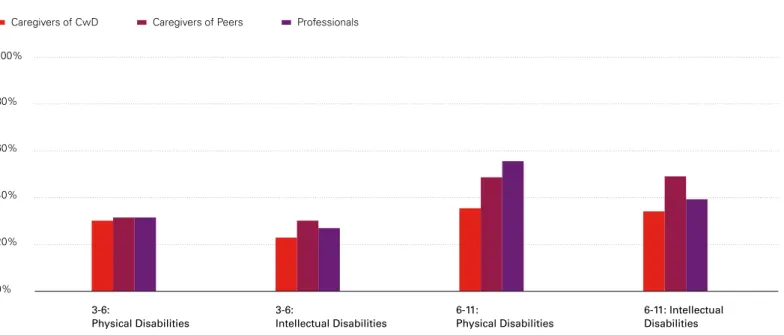
Among the adults, participants were more likely to say they approved of, and would practice, positive norms (keeping the child home, sending them to general school and changing the situation to avoid a human rights violation) relative to what they thought their family, others in the community and society in general approve of and would do.
However, rates of positive social norms were higher among the vignettes for children with physical disabilities than those for intellectual disabilities, indicating more negative social norms and attitudes towards intellectual disability types (see Figure 14).
Female genital mutilation
Complete-the-Story is included in the in-depth interview guide of the ACT Framework to examine social and be- havioural change around FGM in UNFPA-UNICEF countries (UNICEF, 2019). Participants are to read a short vignette about a married couple deciding whether or not to have their daughter undergo FGM. They are told the couple is confused about the decision and are asked a series of ques- tions regarding what the couple should do, how they feel, what others think and would do, and how their decision affects others. By using Complete-the-Story, this activity indirectly provided data on attitudes and social norms around FGM. The results from a select set of questions from Ethiopia are provided (see Figure 15).
PRACTICAL EXAMPLE
Figure 14. Inclusive education vignette results from Macedonia Perceived prevalence of inclusive education
Caregivers of CwD Caregivers of Peers Professionals
0%
20%
40%
60%
80%
100%
3-6:
Physical Disabilities 6-11:
Physical Disabilities 3-6:
Intellectual Disabilities 6-11: Intellectual
Disabilities
Behavioural intention to cut is illustrated by the responses to the question, “What advice would you give the family?”
with more than half of the participants saying they would advise the family not to cut, and 14% stating the daughter should undergo FGM. The rest of the responses to the vignette are divided among those who apply sanctions to FGM and reward not cutting; and the opposite, i.e., those who apply sanctions to uncut girls and reward continuing the practice. Results were generally divided by region and there was an urban-rural divide, with rural participants much more in favour of FGM, indicating that location of residence is a significant factor in the pressure to undergo FGM.
COMPLETE-THE-STORY
Ethiopia
© UNICEF/UNI77869/Holt
Figure 15. Complete-the-Story results from Ethiopia
She is stressed, frustrated and is in a difficult situation (7%)
She is in a dilemma and thinking of the side-effects of FGM from her past experience (7%)
How do you think the characters feel?
She knows the pain because she has experienced it (11%)
Because if she is cut, she will face problems during childbirth (9%)
Because she will be hurt and injured, and will experience bleeding and pain (9%)
Why do you think she feels that way?
To NOT have her daughter undergo FGM (57%) To have her daughter undergo FGM (14%)
What advice would you give the family?
Feels happy and acknowledges the decision not to cut (12%)
Some of them feel negatively and assume that the decision not to cut is against their culture (9%)
How does the community feel?
Preparation for Complete-the-Story requires developing the vignettes. The vignettes should be realistic and cultur- ally appropriate so that participants are able to relate to them. The best vignettes will be based upon real stories from similar people in the community. The language of the vignette must be pretested to ensure that it is under- standable and accurately communicates the intended ideas and messages. Pretesting should also look for the emotional receptivity of participants; if the vignette is par- ticularly upsetting or confusing then participants will shut down, negatively impacting the quality of their responses.
Likewise, vignettes should not be leading; participant responses should come from their actual thoughts and ideas, not be directed by the vignette. Thoroughly pretest all probing questions associated with the vignettes for these same factors.
Complete-the-Story can be used in both one-on-one interviews and in focus group discussions. The process for each method is the same except the discussion com- ponent in focus groups will be replaced by open-ended responses from a single participant in the one-on-one context. When using vignettes in focus groups, it is best to have a maximum of two to three participants re- sponding to vignettes, so they can be discussed in-depth.
The subgroups can have the same or different vignettes;
at the end they come together to discuss responses to the probing questions. This approach requires additional moderators and researchers to records the discussions, as well as more time allotted to the activity, so keep in mind resource limitations when using vignettes in focus group discussions. The example below uses the one- on-one in-depth interview format.
CONDUCTING THE ACTIVITY
Feels happy and acknowledges the decision not to cut (12%)
Some of them feel negatively and assume that the decision not to cut is against their culture (9%)
What are the social rewards for the decision not to have their daughter cut?
Ostracized from social interactions including coffee ceremonies and other social/cultural practices and events (i.e., Edir and Ekub) (20%)