An Atomic Force Microscopy Study of the Interaction between DNA and Nanostructured Beta-Gallia Rutile.5. The attachment of DNA to Beta-Gallia rutile surfaces as a function of DNA dissolution age.
Nano-Devices Based on Deoxyribonucleic Acid
A major limitation to DNA-mediated assembly remains the development of patterned, site-specific, DNA-reactive substrates on which to build these applications. Depending on the substrate, a suitable paint can be selected to accommodate the desired attachment.
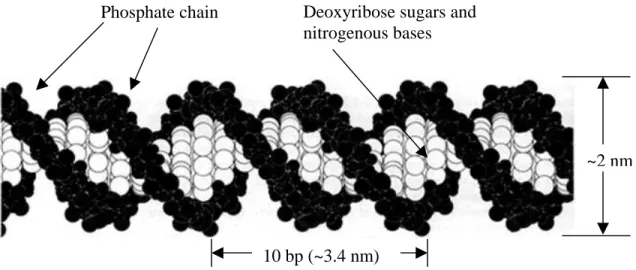
Atomic Force Microscopy of DNA on Mica
In strongly bound situations (called “kinetic trapping”), the DNA molecule is immobilized on the surface so rigidly that its conformation in 2D will resemble that of the intended 3D conformation. surface in a 2D conformation. As described by Stein et al., the ends of the DNA molecule are more negatively charged than its middle segment, so that in the correct
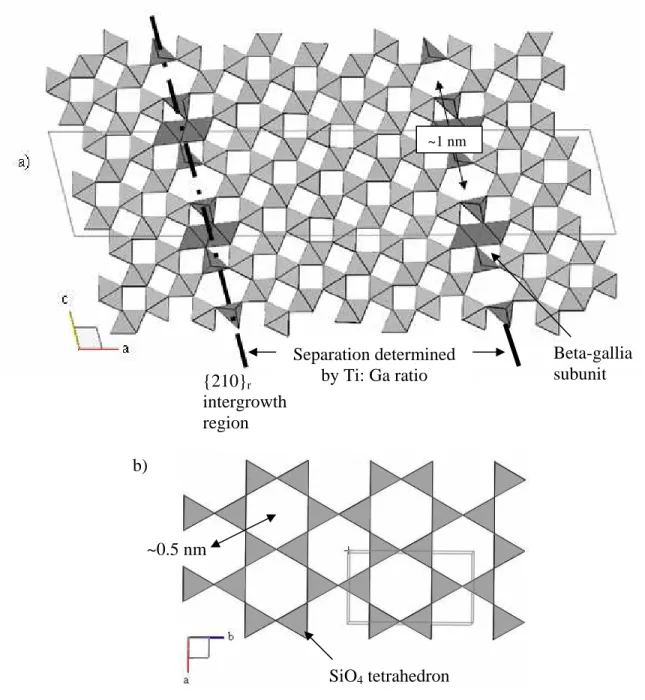
Beta-Gallia Rutile Intergrowths
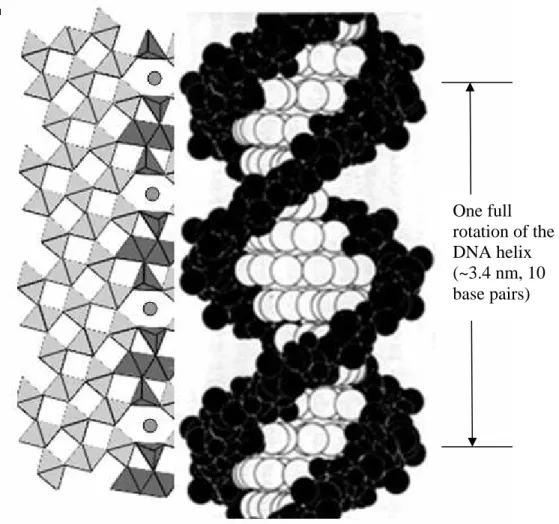
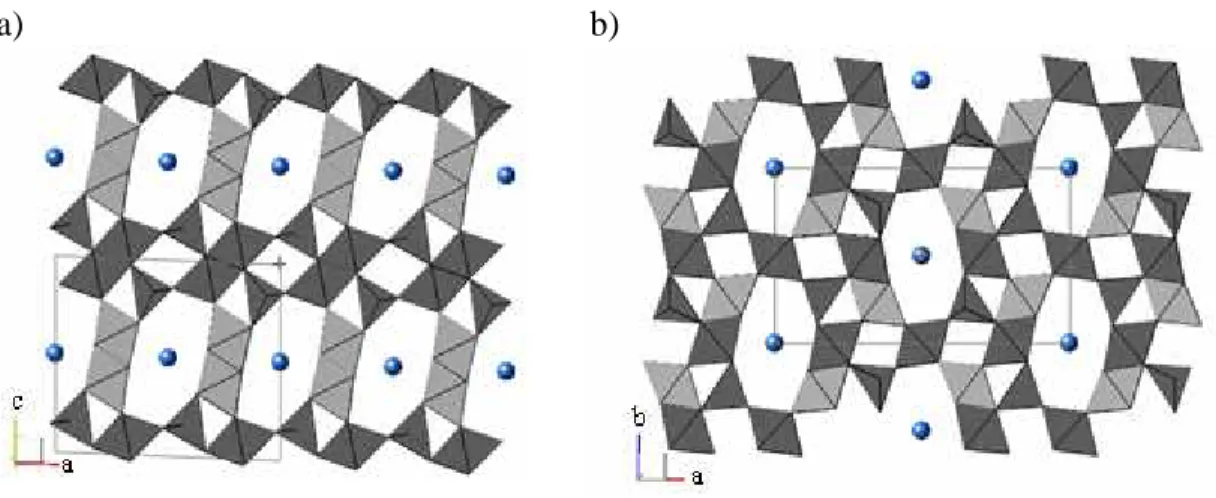
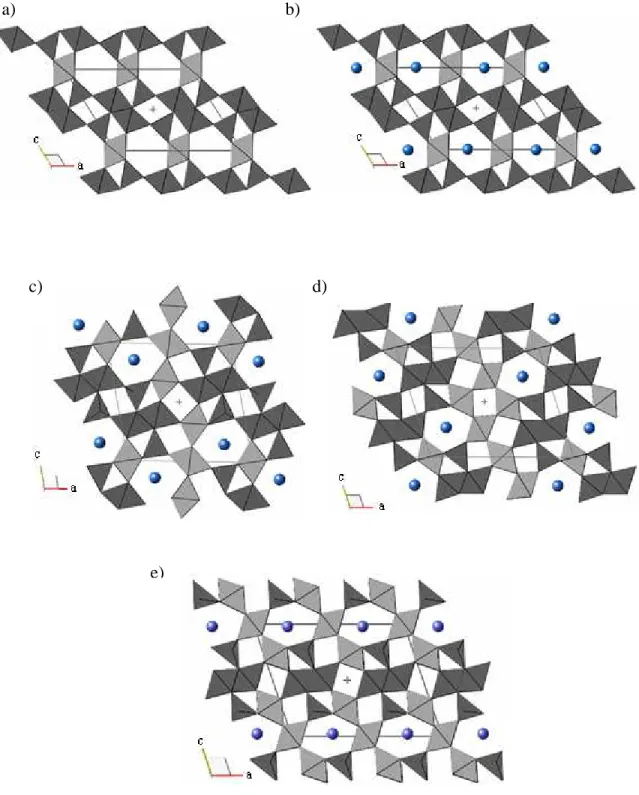
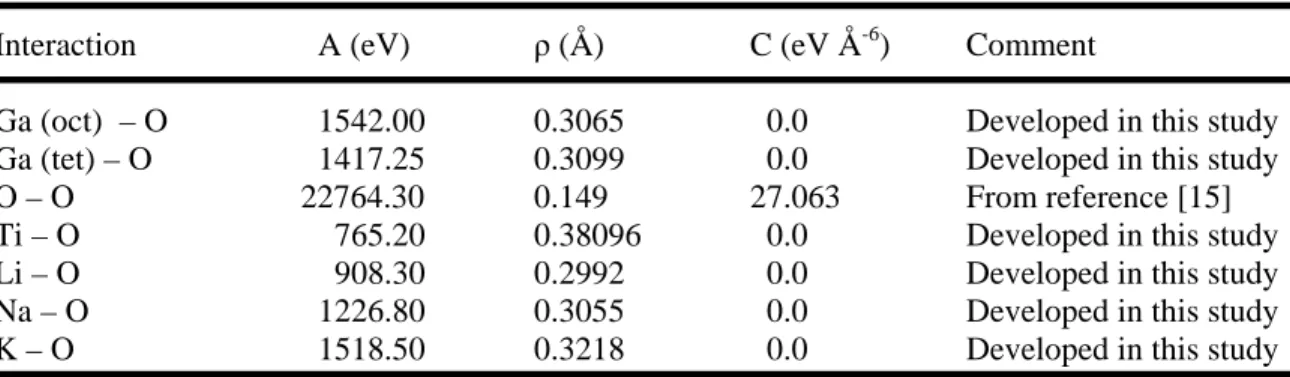
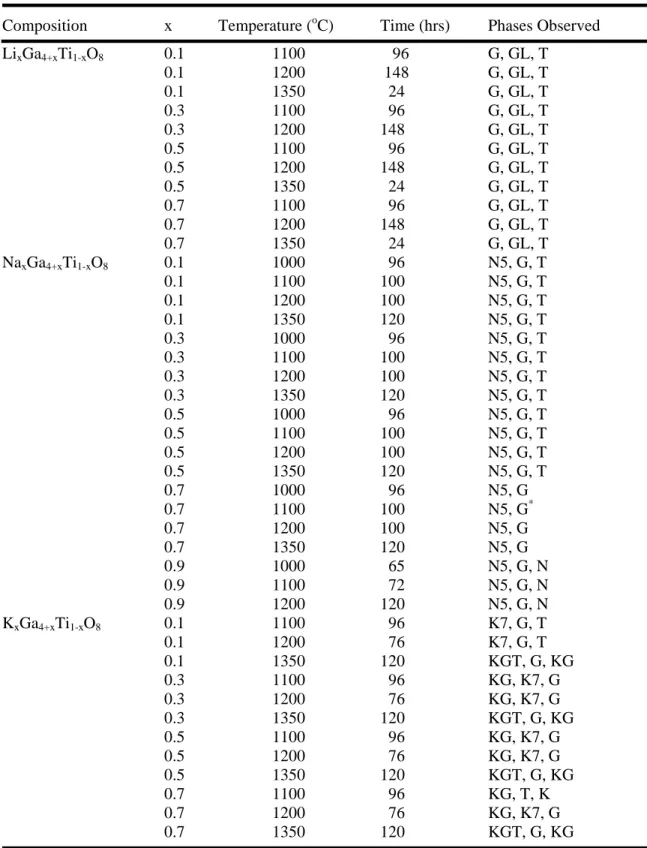
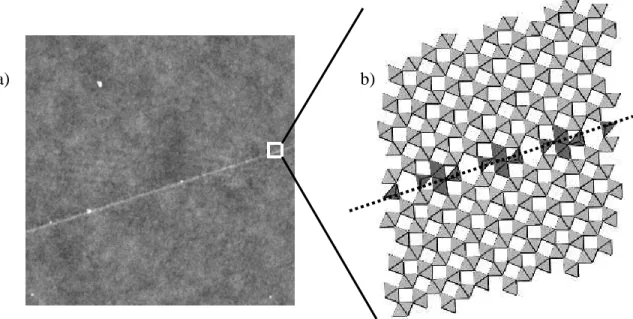
Polyhedral models of a) the (010) plane of beta-gallium.. projections of the TiO6 octahedron are shown in light gray. The projections of the GaO6 octahedron and the GaO4 tetrahedron are shown in dark gray. d) an extension of (c). a) b).
Schwartz, "Force Scanning Microscopy of DNA Molecules Elongated by Convective Fluid Flow in an Evaporating Droplet". Zozime, "Adsorption of DNA on mica mediated by divalent counterions: a theoretical and experimental study," Biophys.
Introduction
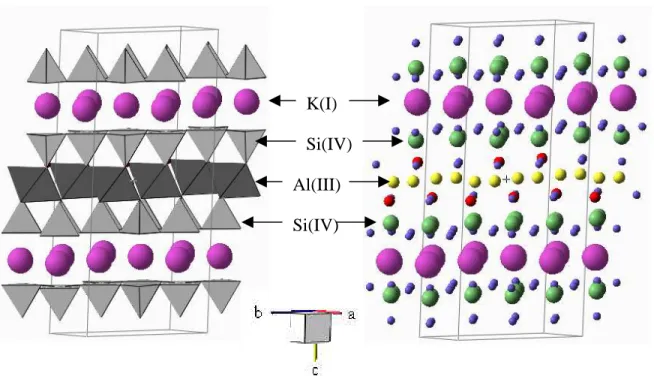
The incorporation of alkali cations into the tunneled structure of Ga4TiO8 (n=5) was investigated and compared with predictions based on atomistic computer simulations. This paper describes our attempts to prepare a series of alkali-substituted BGR intergrowths using solid-state reaction techniques.
Experimental Methods
Simulation Methods
The intergrowth phases all contain a ß-Ga2O3 substructure; separate potential parameters were therefore developed for Ga3+ in octahedral and tetrahedral coordination from a potential fit of ß-Ga2O3. The space group and atomic positions for ß-Ga2O3 were obtained from Ahman et al.12 Values for interatomic distances of Ga-O in tetrahedral and octahedral coordination (for ß-Ga2O3) were taken from Kahn.13 Potential parameters for Ti-O and Na- O was developed by matching both the Na0.7Ga4.72 Ti0.29O8 structure described by Chandrashekar et al. BVS analysis was used to determine the suitability of the potential parameters in these structures.
Results and Discussions
Phase analysis
Based on structural considerations, we expected the NaxGa4+xTi1-xO8 samples to form as a solid solution with x ranging from 0 to about 0.7—the upper limit being the approximate value of x reported by Chandrashekar for crystals grown in a flux containing excess sodium.2 However, the results of our study suggest that NaxGa4+xTi1-xO8 forms with either a relatively narrow solid solution (0.5 . < x < 0.9) or that it forms a compound with x ≅ 0.7. However, the phase analysis of our samples suggests that the NayGa4+yTi2-yO10 phase has a y value greater than 1.0. The results of phase analysis suggest that the x = 0.7 sample lies in the K2.56Ga22O34.28-Ga2O3- K0.8Ga4.8Ti2.2O12 compatibility triangle, but Figure 3.3b suggests that the initial composition of the x = 0.7 sample lies outside of this compatibility triangle.
The simulations show that the mixture of constituent oxides – Ga2O3, Na2O and TiO2 – is preferred over the observed phases. While the simulations show that the observed mixture of phases is favored over a single intercalation phase for x ≠ 0.7, the concurrence of the intercalation lattice energies and the observed phases at x = 0.7 is not particularly significant, since Na Ga Ti O. One of the possible explanation for the discrepancy between the observed and predicted phases in the Na2O-Ga2O3-TiO2 system is that the static lattice energy calculations performed in this study do not account for the contributions of entropy and temperature to the free energy of the system.
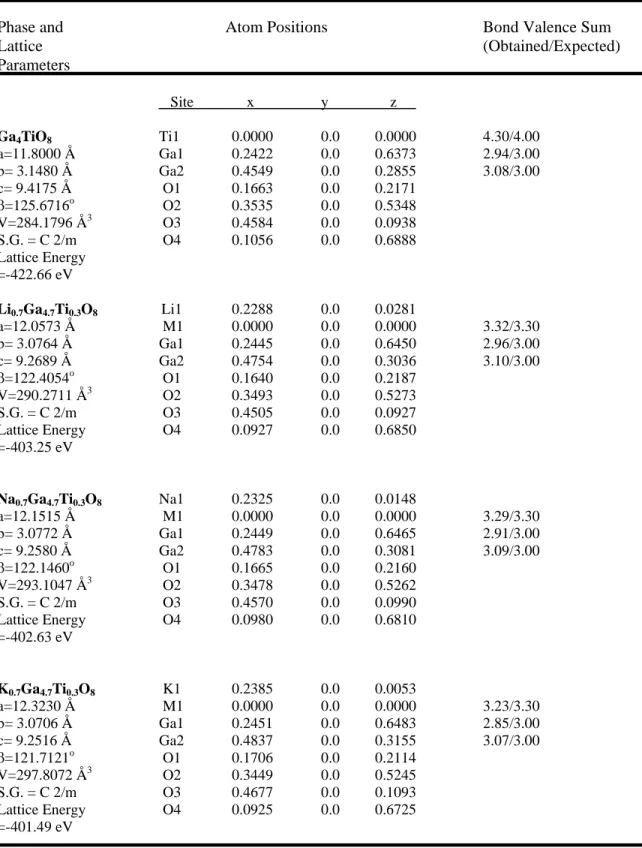
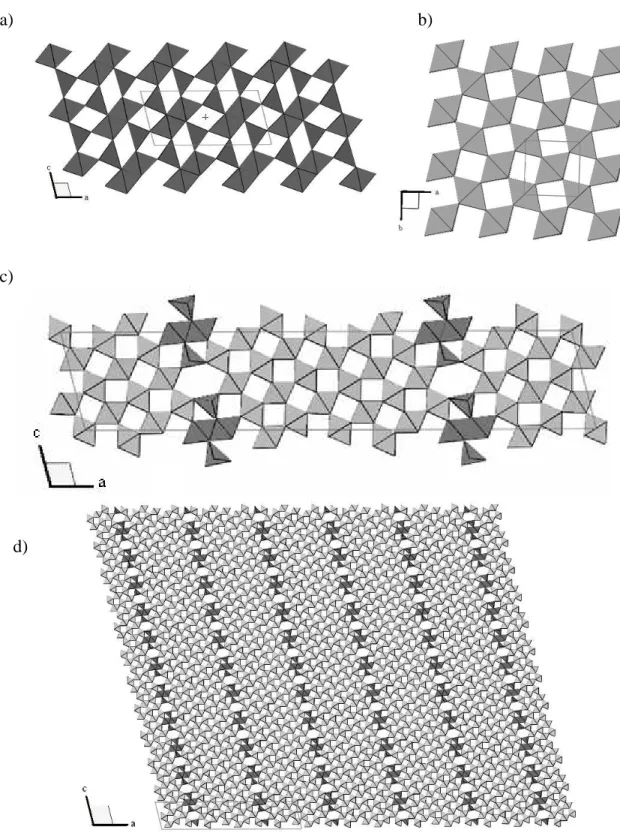
The calculated lattice energy of the BGR derivative (P2/m structure, Figure 3.1c) is 2.24 eV lower than that of the reported Na0.8Ga4.8Ti1.2O10 structure (C2/m, Figure 3.2a), suggesting that the BGR derivative should be the preferred phase, excluding possible temperature and configurational entropy effects. The simulated P2/m n = 7 BGR derivative (Figure 3.1d) has a lower lattice energy than that of both the C2/m BGR derivative (Figure 3.1e) and the reported Pbam structure (Figure 3.2b). Excluding the effects of temperature and configurational entropy, these results suggest that the P2/m BGR derivative should be preferred over both the C2/m BGR derivative and the observed Pbam structure.
Conclusions
An Atomic Force Microscopy Study of the Interaction of DNA and Nano-Structured Rutile Beta-Gallia. Of all cations examined, only Ni(II) resulted in DNA binding to rutile surfaces. DNA binding to BGR surfaces was strong enough to allow AFM imaging when the deposition buffer contained one of the following cations: Co(II), Mg(II), Mn(II), Ni(II), and Zn ( II).
Introduction
Attachment of DNA to planar substrates is also required for AFM studies of the biomolecule. In this work, we report on the attachment of DNA to beta-gallia rutile (BGR) substrates. Herein, the observed interaction of DNA with BGR surfaces in the presence of divalent cations via AFM is reported.
Experimental Procedure
Initially, the samples were prepared by exposing the substrates to 20 µl of DNA buffer solutions for 10 minutes. The second batch of samples was first pretreated with 10 mM divalent salt solution for 5 min, rinsed with distilled water, and then exposed to 20 µl DNA buffer solutions for 10 min before solidification and drying. For the third batch of samples, 20 µl of DNA buffer solution was applied to the BGR surfaces and allowed to dry completely before imaging.
![Figure 4.1. Projection of the ß-gallia rutile (Ga 4 Ti 21 O 48 ) structure along [001] of the parent rutile structure, after Ref](https://thumb-ap.123doks.com/thumbv2/123dok/10519168.0/81.918.217.795.136.577/figure-projection-gallia-rutile-structure-parent-rutile-structure.webp)
Results and Discussion
Beta-gallia rutile synthesis
The dried 20 µl aliquot masked most features of the BGR surface and prevented imaging of any DNA attachment. The null result validates the importance of the salt additions in contributing to the attachment of DNA to the BGR surface. A comparison of the density of DNA attached to intergrowths (solid bars) with the density of DNA observed along random lines along the surface of BGR substrates (dashed bars) for various divalent cations.
![Figure 4.2. AFM height images (10 x 10 µm) of a) bare single crystal [001] TiO 2 (z range: 100 nm), b) BGR fired at 900 o C for 24 hrs (z range: 100 nm), c) BGR fired at 1100 o C for 24 hours (z range: 100 nm), d) BGR fired at 1350 o C for 96hrs (z](https://thumb-ap.123doks.com/thumbv2/123dok/10519168.0/83.918.526.810.103.382/figure-height-images-single-crystal-range-fired-range.webp)
Conclusions
The mechanisms responsible for binding DNA to the BGR surface are not well understood. When buffers without cation additions and buffers containing Ca(II), Cu(II), and Fe(II) were used, DNA failed to bind the BGR surfaces strongly enough to allow AFM imaging. The mechanisms by which DNA attaches to the BGR surface are not well understood but may involve the incorporation of divalent cations at the tunnel sites of the BGR intergrowths.
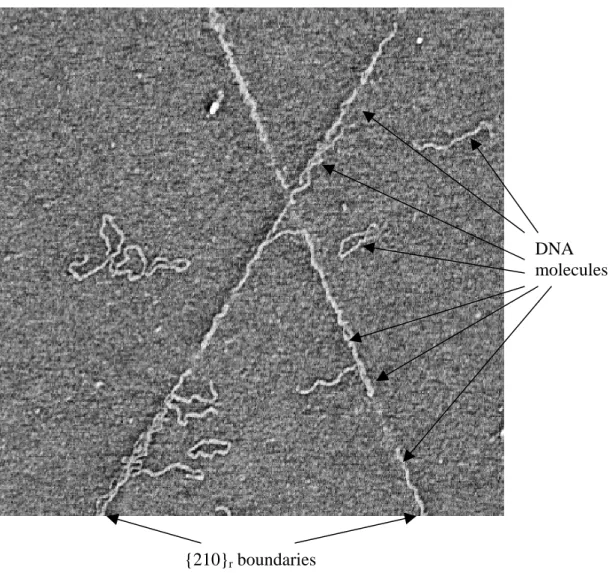
Bustamante, "Scanning force microscopy of DNA deposited on mica: Equilibrium versus kinetic trapping studied. Winding and unwinding of DNA strands under the influence of copper (II) ions," Proc. A dramatic decrease in the concentration of DNA bound to BGR surfaces was observed as the age of the DNA solution increased.
Introduction
The results suggest that DNA solution age is an important variable affecting DNA attachment to BGR surfaces. Understanding the binding interaction is key to developing controllable DNA attachment to suit a given application. The focus of this study is to investigate the influence that DNA solution age has on the attachment of DNA to BGR surfaces.
Experimental Procedure
- Synthesis of beta-gallia rutile substrates
- AFM imaging
- DNA solution preparation
- Reporting bound DNA concentration
- Gel electrophoresis
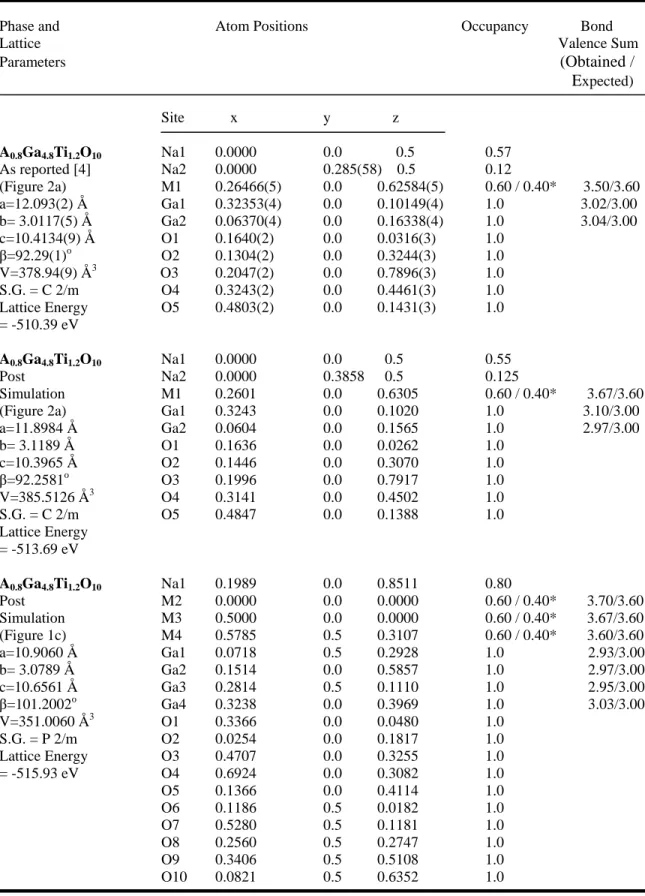
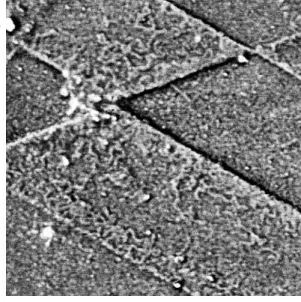
Because DNA molecules exhibit preferential attachment to {210}r intergrowth regions of BGR surfaces, it would be inappropriate to report surface DNA densities when different surface regions possess different densities of {210}r intergrowth lines. An equivalent length of random gridlines (selected via a random number generator) was applied to each image (average 10 trials/image), and was termed the linear DNA density along random gridlines.
Results and Discussion
AFM results and discussion
Average linear DNA density along {210}r intergrowth boundaries as a function of DNA solution (containing 1 mM MCl2) age. Average degree of DNA preference for {210}r intergrowth boundaries on BGR surfaces as a function of cation species and concentration. Images c and d in the presence of 5 mM MgCl2 display a high degree of preferential attachment of DNA along {210}r intergrowth boundaries. a) b).
AFM results and discussion
Conclusion
The DNA dissolution age is a critical variable affecting the binding of DNA to BGR substrates. A dramatic decrease in bound DNA concentration was observed to accompany increases in DNA solution age. The exact reason for the null result is unknown, but may be attributed to the formation and sedimentation of DNA-attractive metal hydroxides or possibly an increase in the degree of DNA network with respect to time.
A suitable planar substrate for the controllable attachment of DNA molecules is required to help advance nano-electronic, biological and mechanical technologies. The beta-gallium rutile (BGR) surface has shown preferential DNA binding at the {210}r transition boundaries in the presence of several divalent cations. From examination of the end-to-end distances it would appear that the binding strength of the DNA molecules increased with increasing cation concentration.
Introduction
This study examines the influence of cation species and concentration on DNA attachment behavior to identify how each variable can be modified to help optimize binding behavior. Previously, we reported the ability of certain divalent cations (Co(II), Mg(II), Mn(II), Ni(II) and Zn(II)) to preferentially attach DNA along {210}r intergrowth regions of beta- gallia rutile (BGR) surfaces.16 In that study, a ladder DNA solution containing many lengths of DNA molecules was used, which did not provide adequate conditions to quantify the molecular binding behavior between the different cations. The tunnel sites have a diameter of approximately 0.25 nm, sufficient for the introduction of small to medium cations.17 Research into the interaction of DNA and mica surfaces has shown that the binding between these two similarly charged surfaces is facilitated by the presence of divalent cations.5,7,8,18 It is believed that a similar mechanism exists between DNA and BGR.
Experimental Procedure
- Substrate synthesis
- DNA preparation
- AFM Imaging
- Degree of binding preference
A procedure was developed to determine preferential binding which involves comparing the DNA density for the {210}r intergrowth boundary with that of an equivalent random grid line length. A grid of 113 x 113 lines was overlaid on the images, the number of DNA molecules in contact with an equal length (up to the length of the {210}r intersection line) of the grid lines was also recorded. A value assigned as the degree of preference describes the linear DNA density of the {210} intergrowth lines divided by the linear DNA density of the lattice lines.
Results and Discussion
Strength of attachment
Molecules bound along {210}r intergrowth boundaries in the presence of 1 and 5 mM and ZnCl2 have much smaller end-to-end distances (in most cases the molecules were too entangled to measure effective distances) than those bound to rutile -rich surface areas (figure 6.7b,c). At this salt concentration, the majority of the DNA molecules appear to bind at their termini, while the remainder of the molecule is pulled toward the receding meniscus (Figure 6.8a). Solutions containing Co(II) additions appeared to follow similar trends observed in the other cation-containing solutions (Figure 6.9a-c).
Conclusion
Substrate pretreatment (with 10 mM salt solutions) was not sufficient to bind significant amounts of DNA molecules from solutions that did not contain cation additives. If saturation of DNA molecules occurs, excess divalent cations can begin to inhibit the intimate interaction required to bind the DNA molecules to the BGR surface. Of the four cations tested, solutions containing Zn(II) appeared to bind the lowest amount of DNA.
Future Directions
BGR substrate
Although the roughness of currently synthesized BGR surfaces may inhibit the identification of more intimate features of DNA structure, the substrate does succeed in providing a surface for the site-specific attachment of DNA without additional / cumbersome functionalization steps required with alternative substrates . Isolating the influence of DNA solution age significantly reduced the variance in bound DNA surface densities, but a noticeable amount of variance still remains. If the amount of bound DNA to plasmid DNA is significantly reduced, the importance of DNA termini for surface attachment can be identified.
DNA preparation
Binding mechanism