Three Experimental Studies of Reward and Decision Making
Thesis by Min Jeong Kang
In Partial Fulfillment of the Requirements for the Degree of
Doctor of Philosophy
California Institute of Technology Pasadena, California
2010
(Defended August 20, 2009)
© 2010
Min Jeong Kang
All Rights Reserved
To the memory of my father
Acknowledgments
I would like to thank my advisor and mentor Colin Camerer. I am very much indebted to him as I would not have been able to complete this long and demanding journey towards the PhD without his guidance.
He has been a ceaseless source of insights, ideas, and energy (and humor, of course). I always found him intellectually stimulating and much enjoyed his jokes in and outside the lab. Also, I admire his “mastery” of the English language and flamboyant writing style—I wish I could write like him! Despite his busy schedule, he is always easily accessible whenever I need his input academically or personally.
It is very easy for graduate students to drift away without constant reminders, checking in, and prodding. Through all these years, he has been diligent about paying attention to my progress and keeping me on track. I always felt like he cared about my work. I very much appreciate his devotion of his energy and time to advise and train me.
Of course, no thesis would be complete without a thesis committee. In this regard, I am deeply grateful to Antonio Rangel, Ralph Adolphs, and Peter Bossaerts for taking time out of their busy schedules to generously serve on my committee and for their valuable comments on my dissertation. Further thanks are due to Antonio for his contributions and guidance in the second study, on hypothetical and real choices.
Further, I would like to thank all the professors in HSS that taught me at various points in the past five years. They set a foundation for understanding and conducting research in social sciences, which was necessary and crucial for this thesis. In this regard, I gratefully acknowledge my undergraduate advisor, Youngse Kim at Yonsei University. He inspired and encouraged me to pursue a PhD in the U.S. and I am very thankful for what I learned from him in college and for all of his support. Without his guidance and encouragement, I would not have come here and this thesis would not have existed.
Throughout my graduate research, I had the good fortune of working with many skilled collaborators, to whom much thanks is due. My second chapter was coauthored with Ming Hsu, Ian Krajbich, Joseph Wang, Samuel McClure, George Lowenstein and Colin Camerer. My third chapter on hypothetical and real decisions was a collaboration with Mickael Camus and Colin Camerer. My fourth chapter on optimal timing decisions is an ongoing effort with Colin. Furthermore, Meghana Bhatt, Carmina Caringal, Noah Myung and Cary Frydman deserve acknowledgement for their help. Colin financially supported all of the research; his financial support is greatly appreciated. I am also very grateful to Mike Lipper for his generous financial support; my final year at Caltech was funded from the Lipper Family Fellowship in Neuroeconomics.
I would also like to thank the many other people who helped me over the years to complete this thesis. I thank Ming Hsu for being such a wonderful coach to get me started on fMRI analysis. I also thank Hilke Plassmann, Todd Hare, Cendri Hutcherson and Camerer and Rangel lab members for useful comments and help. Especially, I appreciate Hilke’s warm friendship and willingness to help anytime.
Many thanks go to HSS, SSEL, and CASSEL staff for administrative assistance to run experiments. I especially appreciate help from Tiffany Kim and Walter Yuan. I should not forget to mention Laurel Auchampaugh; she has been of great help all the time and I am very grateful for that.
Personally, I would like to give warm thanks to friends at the Caltech dance clubs and CKGSA for all the parties, dancing and good times. I thank Oleg Kogan and David Young for fun times dancing together and listening to my concerns. I will not forget the countless chit-chats with my classmates, Sera Linardi and Noah Myung. They have been great friends and counselors.
I would especially like to thank Daniel Holland. He deserves a big hug for his constant support. He has been of great help, both academically and personally. I will not forget his patience and support throughout this difficult time. In particular, I am grateful to him for his love, his mastery of the English language (though slightly less sophisticated than Colin’s for now), and keeping my clothes clean when I was too busy with this thesis to do it myself.
I would like to reserve my last, but biggest, thanks for my family. I appreciate all their support and love from afar. I dedicate this thesis to my late father.
Abstract
This thesis investigates reward-driven decision making using a combination of techniques such as functional neuroimaging, behavioral experiments, and pupilometry. Different aspects of reward and decision making were examined in three different studies, including the nature of curiosity, similarities and differences in hypothetical and real decisions, and optimal-timing decisions. In the study of curiosity, my colleagues and I conceptualized information as a rewarding object and curiosity as a form of reward anticipation of the rewarding information. We explored this hypothesis using a combination of functional neuroimaging, pupillometry, behavioral experiments, and memory-retrieval experiments. In the study of hypothetical and real decisions, the neural differences and similarities underlying these types of decisions were explored. We discuss potential implications of the findings on scientific practices and suggest the possibility of a new use of fMRI to improve the prediction of real choices based on hypothetical choice data. In the third study, we explore how people make timing decisions when motivation to delay trades off against the motivation to take an action immediately. We experimentally test current theory and examine how strategic decisions become sophisticated over time. We further hypothesize about psychological processes that could guide decision making under uncertainty and time pressure.
Table of Contents
Acknowledgements ... iv
Abstract ... vi
List of Figures ... x
List of Tables ... xii
1 Introduction ... 1
2 Epistemic Curiosity Activates Reward Circuitry and Enhances Memory ... 3
2.1 Introduction ... 5
2.2 Study 1: Neural Correlates of Curiosity ... 5
Experimental Design and Methods ... 5
Participants and Stimuli ... 5
Experimental Procedure ... 6
FMRI Data Acquisition and Preprocessing ... 8
FMRI Data Analysis ... 9
Behavioral Results ... 11
Curiosity is Correlated with Uncertainty P(1 − P) and Peaks around Confidence P = 0.5 ... 11
fMRI Results ... 13
Curiosity is Correlated with Activity in Reward Regions ... 13
Curiosity is Correlated with Memory-Related Regions when Incorrectly Guessed Answers are Revealed ... 15
2.3 Study 2: Curiosity Enhances Memory ... 17
Experimental Design and Methods ... 17
Participants and Task ... 17
Measures ... 18
Results ... 19
Pupils Dilate in Response to Curiosity-Piquing Questions ... 19
Initial Curiosity Enhances Subsequent Memory for Incorrectly Guessed Answers ... 21
2.4 Study 3: Curiosity as Reward Anticipation ... 24
Experimental Design and Methods ... 24
Participants ... 24
Task and Measures ... 24
Results ... 27
2.5 Discussion and Conclusions ... 31
2.6 Appendix for Chapter 2 ... 37
Bibliography ... 43
3 Hypothetical and Real Consumer Choices Differentially Activate Common Frontostriatal Brain Circuitry ... 46
3.1 Introduction ... 46
3.2 FMRI Study ... 49
Experimental Design and Methods ... 49
Participants... 49
Stimuli ... 49
Experimental Procedure and Task ... 50
fMRI Data Acquisition ... 55
fMRI Data Preprocessing ... 55
fMRI Data Analysis ... 56
Behavioral Results ... 60
Bias in Hypothetical Decisions ... 60
Correction of Hypothetical Bias ... 63
fMRI Results ... 67
Brain Areas with Higher Activation in Real Decision Making ... 67
Modulation of Brain Activity by mDV ... 68
Task-Dependent Functional Connectivity between the ACC and the mOFC ... 74
3.3 Behavioral Experiment for Hypothetical and Real Willingness to Pay ... 75
Experimental Design and Methods ... 75
Participants, Stimuli, and Experimental Procedure ... 75
Results ... 76
3.4 Behavioral Experiment for Ordering Effects ... 79
Experimental Design and Methods ... 80
Participants, Stimuli, and Experimental Procedure ... 80
Results ... 80
3.5 Discussion and Conclusions ... 81
3.6 Appendix for Chapter 3 ... 88
Bibliography ... 97
4 Optimal-Timing Decision: An Experimental Study of Multiagent Timing Game ... 102
4.1 Introduction ... 102
The Structure of the Clock Game and Theoretical Predictions ... 105
Dynamic Clock Game ... 105
Static Clock Game ... 107
4.2 Experiment Design and Methods ... 109
Participants and Stimuli ... 109
Experimental Procedure and Task ... 110
Design Considerations ... 115
4.3 Results ... 116
Descriptive Statistics ... 118
Signal Arrival Time ... 119
Success Rate ... 120
Durations ... 120
Difference in Delay between Dynamic and Static Trials ... 121
Signal Dependence of Delay ... 123
Effect of Experience on Delay ... 128
Individual Differences in Sensitivity to Signal Arrival vs. Risk Preference ... 134
4.4 Re-analyzing the BM Data ... 136
4.5 Discussion and Conclusions ... 141
4.6 Appendix for Chapter 4 ... 146
Bibliography ... 158
List of Figures
2.1 Sample questions with relatively high- and low-curiosity ratings ... 6
2.2 Experimental timeline ... 8
2.3 Distribution of curiosity rating against confidence ... 12
2.4 Differential brain activity in high and low curiosity trials ... 14
2.5 Regions which are more active in response to answers after making incorrect guesses than to correct guesses ... 15
2.6 Regions with activity correlated with novel information ... 16
2.7 Pupillary response ... 20
2.8 Memory test ... 22
2.9 Timeline of experiment in study 3 ... 25
2.10 Curiosity correlates with willingness to pay the cost ... 27
2.11 Individual logistic curves in the token condition ... 30
2.12 Individual logistic curves in the time condition ... 30
3.1 Timeline of the entire experiment ... 50
3.2 An example screen for the prescanning trials ... 51
3.3 Time structure of an individual trial in the scanning part ... 53
3.4 Histogram of willingness to pay ... 61
3.5 Distribution of decisions by trial type ... 61
3.6 Correction of biases in DV ... 62
3.7 Median estimated θ for hypothetical and real trials ... 64
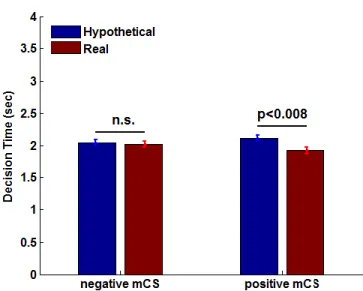
3.8 Average decision time in hypothetical and real trials by sign of mDV ... 67
3.9 Brain areas more engaged in real versus hypothetical decision making. ... 68
3.10 Modulation of mDV in real vs. hypothetical decisions ... 68
3.11 Conjunction analysis of Real*mDV and Hyp*mDV contrasts ... 70
3.12 Significantly active areas in the [Real*mDV – Hyp*mDV] contrast ... 71
3.13 Differential sensitivity to mDV in hypothetical and real trials ... 72
3.14 Time-course plots of the mOFC region ... 72
3.15 Supplementary model ... 73
3.16 PPI anlaysis ... 74
3.17 Comparison of hypothetical and real WTP for the identical object ... 77
3.18 Overreporting of hypothetical WTPs ... 78
3.19 Ordering effects on purchase percentage by trial type ... 81
4.1 A dynamic clock game trial ... 111
4.2 A message arrival ... 112
4.3 Feedback screen ... 113
4.4 A static trading round ... 114
4.5 Signal arrival period by trial type and group ... 119
4.6 Scatter plot of success rates in dynamic and static trials ... 120
4.7 Difference in average Duration between dynamic and static trials ... 121
4.8 Difference in average Delay between dynamic and static trials ... 122
4.9 Distribution of individual average Delay between dynamic and static trials ... 122
4.10 Distribution of individual average Delayuncensored in static trials ... 123
4.11 Distribution of Delay against the signal arrival period by trial type ... 124
4.12 Delay as a function of the signal arrival period ... 124
4.13 Delayuncensored as a function of the signal arrival period ... 126
4.14 Scatter plot of Delayuncensored versus the signal arrival period... 127
4.15 Delay as a function of the signal arrival period, moderated by experience ... 128
4.16 Delayuncensored as a function of the signal arrival period, moderated by experience ... 129
4.17 Scatter plot of average δ’s for the first and the last halves of the experiment ... 130
4.18 Deviation measure δ by trial type and experience ... 131
4.19 Interactions between trial type, experience, and group on deviation measure δ ... 132
4.20 Probability of early exit as a function of Signal, Condition and Experience ... 134
4.21 Risk aversion measures, + and -, versus coefficients from the individual regression models ... 135
4.22 Average Delay ... 137
4.23 Delay as a function of the signal arrival period ... 138
4.24 Scatter plot of Delay and the signal arrival time by experience ... 139
4.25 Delay as a function of the signal arrival period, moderated by experience ... 139
List of Tables
2.1 Individual regression analysis of the normalized curiosity level against P and P(1 − P) .... 13
2.2 Brain regions associated with high curiosity relative to low curiosity during the first presentation ... 15
2.3 Brain regions linearly correlated with residual curiosity during answer display when subjects initially guessed incorrectly... 16
2.4 Two-sample t-test of accuracy rate of fMRI subjects’ postscan guesses and study 2 subjects’ online guesses ... 19
2.5 Pupil dilation response regressions ... 21
2.6 Memory test regression ... 23
2.7 Group logistic regression of curiosity on decision to spend a token ... 27
2.8 Group logistic regression of curiosity on decision to wait for an answer ... 28
2.9 Summary of individual logistic regression of the normalized curiosity on decision to spend cost ... 28
3.1 Descriptive statistics for willingness to pay, decision value by trial type. ... 61
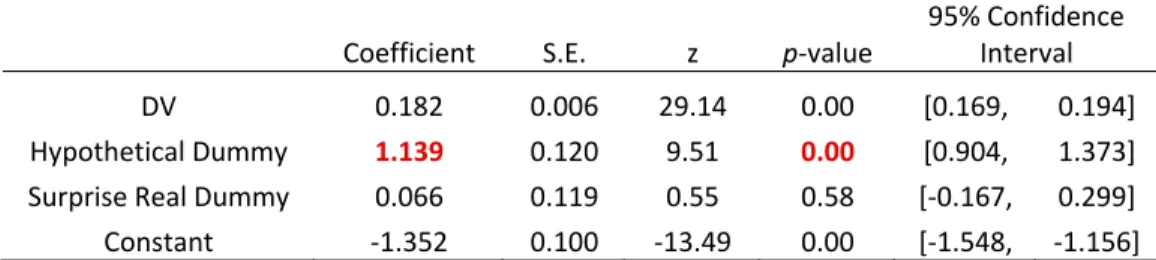
3.2 Results of random-effects logistic regression analysis for hypothetical dummy specification ... 63
3.3 Estimated θ for modifying the decision value ... 65
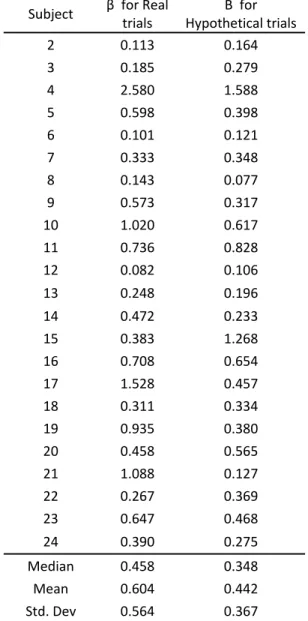
3.4 Individual differences in sensitivity of choice probability to mDV ... 66
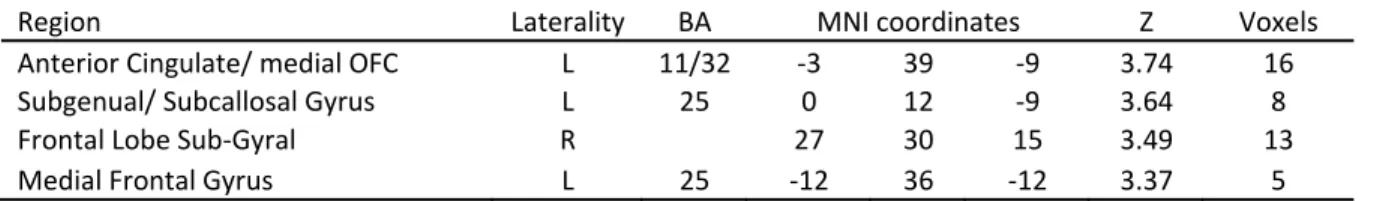
3.5 Areas showing significant activity in the contrast of real vs. hypothetical decision making ... 67
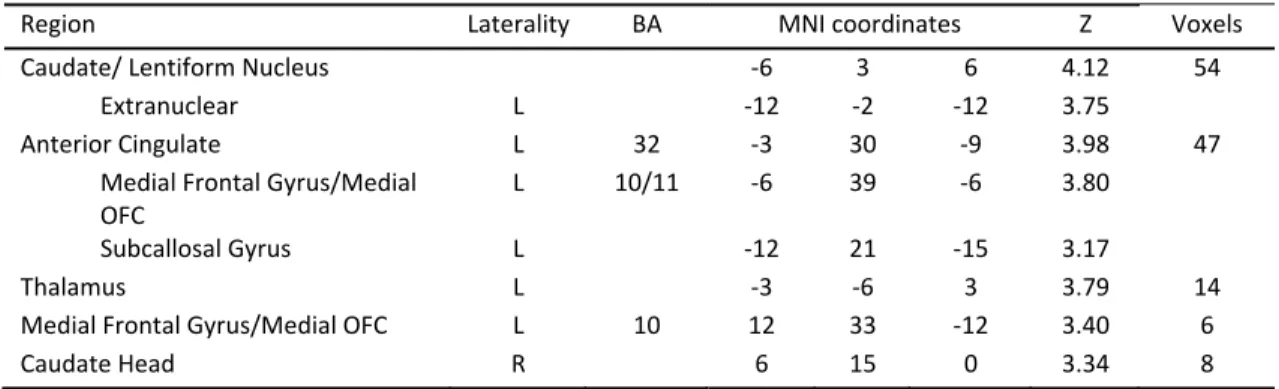
3.6 Areas showing significant activity in the contrast of the parametric regressor for real decision making ... 69
3.7 Areas showing significant activity in the contrast of the parametric regressor for hypothetical decision making ... 69
3.8 Conjunction analysis ... 70
3.9 Areas showing activity in the difference of the parametric regressors ... 71
3.10 PPI analysis ... 75
3.11 Individual differences in hypothetical bias ... 78
4.1 Percentage of trials with (un)censored Delay ... 119
4.2 Results of random-effects Tobit regression analyses for Delay censored at 0 ... 125
4.3 Results of random-effects regression analyses of Delayuncensored ... 127 4.4 Results of regression analyses of Delayuncensored on the signal arrival time and experience 129
4.5 Results of regression analyses of δuncensored on the signal arrival period and the trial number ... 133 4.6 Random-effects logistic regression of probability of early exit on the signal arrival period,
experience, and condition ... 133 4.7 Results of random-effects Tobit regression analyses of Delay on the signal arrival time . 127 4.8 Results of random-effects Tobit regression analyses of Delay on the signal arrival time and
experience ... 127 4.9 Results of random-effects regression analyses of δ on the signal arrival period and the trial
number ... 127
Chapter 1
Introduction
This thesis contains three independent experimental studies concerned with the general theme of human reward processing and decision making. In recent years, the development of brain imaging technology has enabled researchers in various disciplines to expand our understanding of decision making and valuation. This thesis continues the trend using a combination of methods such as functional imaging, behavioral experiments, and pupilometry. The studies herein contribute to an understanding of reward-driven decision making: (1) by extending a dimension of reward to include more abstract objects of higher complexity (information, consumer products); (2) by comparing different modalities of decision making (hypothetical and real) on a neural level that had not been explored previously; (3) testing decision making when different motives conflict in a complex social environment.
In the following chapter is an experimental study of curiosity itself, which has long intrigued philosophers and social scientists and has been described as an important motivator of learning. Despite its importance, the psychological and neural substrates of curiosity remain poorly understood. In the study, information has been conceptualized as a rewarding object and curiosity as a form of reward anticipation of the rewarding information. This hypothesis is explored using a combination of functional neuroimaging, pupillometry, behavioral experiments, and memory-retrieval experiments.
The second study examines the neural differences and similarities underlying hypothetical and real consumer decision making. Many studies in social sciences rely on hypothetical choice data to infer actual choices, which are often difficult to obtain.
However, studies in economics have found that hypothetical valuations of goods reflect a systematic bias compared to actual preferences. Based on this behavioral difference, we further ask if there are different neural circuitries engaged in hypothetical and real decisions, and different neural computations are carried out in the brain for hypothetical and for real decisions. We discuss potential implications of the findings on practices in imaging neuroscience and psychology and further suggest the possibility of a new use of fMRI to neurally predict real choices based on hypothetical choices.
In the last chapter, optimal timing decisions are investigated when motivation to delay trades off against motivation to take an action immediately. Current theory is experimentally tested in two different environments, and we examine how strategic decisions become sophisticated over time. We further hypothesize psychological processes that could guide decision making under uncertainty and time pressure.
Chapter 2
Epistemic Curiosity Activates Reward Circuitry and Enhances Memory
1
“The important thing is not to stop questioning. Curiosity has its own reason for existing.
One cannot help but be in awe when he contemplates the mysteries of eternity, of life, of the marvelous structure of reality. It is enough if one tries merely to comprehend a little of his mystery every day. Never lose a holy curiosity.”
−Albert Einstein
2.1 Introduction
Curiosity is the complex feeling and cognition accompanying the desire to learn what is unknown. Much as curiosity motivates other animal species to explore their environment and find sources of food, it plays a critical role in motivating learning and discovery in humans, especially by creative professionals, and is necessary for increasing the world’s store of knowledge. Apples had fallen from a tree before Newton and have done so after him, but it was his curiosity that inspired him to formulate the theory of universal gravitation out of such a seemingly inconsequential phenomenon. Einstein, once said, “I have no special talents. I am only passionately curious (Hoffmann 1972).”
Although curiosity has made great contributions to advance knowledge and technologies, curiosity has a dangerous side in its association with exploratory behaviors having harmful consequences. An ancient example is the mythical Pandora, who opened a box that unleashed misfortunes on the world. Curiosity is often accused of causing teenagers’
1 This chapter has been previously published in Kang et al. (2009) and the definitive version is available at www.blackwell-synergy.com.
thrill seeking, drug and alcohol use, and sexual experimentation. Moreover, pathological curiosity leads to behavioral disorders such as perverted voyeurism. Technology such as the Internet augments both good and bad effects of curiosity, by putting both enormous amounts of information and potentially dangerous social encounters a mouse click away.
Despite its importance, the psychological and neural underpinnings of human curiosity remain poorly understood. Philosophers and psychologists alike have described curiosity as an appetite for knowledge, a drive like hunger and thirst (Loewenstein 1994), the hunger pang of an “‘info-vore” (Biederman & Vessel 2006), and “the wick in the candle of learning” (William Arthur Ward). In reinforcement learning, a novelty bonus is used to motivate the choice of unexplored strategies (Kakade & Dayan 2002); curiosity can be thought of as the psychological manifestation of such a novelty bonus.
Our research is guided, in part, by the theory that curiosity arises from an incongruity or
“information gap”—a discrepancy between what one knows and what one wants to know (Loewenstein 1994). The theory assumes that the aspired level of knowledge increases sharply with a small increase in knowledge, so that the information gap grows with initial learning. When one is sufficiently knowledgeable, however, the gap shrinks and curiosity falls. If curiosity is like a hunger for knowledge, then a small “priming dose” of information increases the hunger, and the decrease in curiosity from knowing a lot is like being satiated by information.
In the information-gap theory, the object of curiosity is an unconditioned rewarding stimulus: unknown information that is anticipated to be rewarding. Humans (and other species, such as cats and monkeys) will expend resources to find out information they are
curious about, much as rats will work for a food reward (Loewenstein 1994). Based on this observation, we hypothesized that the striatum would be linked to curiosity, as a growing body of evidence suggests that activity in the human striatum is correlated with the level of reward signals (Hare et al. 2008; Knutson et al. 2000; McClure et al. 2004;
O'Doherty 2004).
Guided by the ideas mentioned above, we explored the neural correlates of curiosity in one study and tested the hypotheses derived from its findings in two separate studies. In all studies, subjects were presented with series of trivia questions chosen to create a mixture of high and low “epistemic” curiosity (figure 2.1).2 Subjects were instructed to read each question, guess the answer, and rate both their curiosity and how confident they were that they knew the answer (P). They were then shown the question again along with the correct answer (figure 2.2).
In the first experiment subjects read the questions during fMRI. In the second experiment they performed the same task without scanning, and their memory for answers was tested in a follow-up session 1−2 weeks later. In the third experiment, we behaviorally tested whether curiosity is indeed a form of reward anticipation.
2.2 Study 1: Neural Correlates of Curiosity
Experimental Design and Methods Participants and Stimuli
2 Epistemic curiosity refers to a desire to acquire knowledge and applies mainly to humans (Loewenstein, 1994).
Nineteen Caltech students were scanned (average age: 21.7 ± 3.5 years; 14 males, 5 females; 18 right-handed)3. They earned $20 for participation. Informed consent was obtained for all three experiments, using a consent form approved by the Internal Review Board at Caltech.
The stimuli consisted of 40 trivia-type questions, regarding various topics, chosen to measure curiosity about semantic knowledge. The questions were pre-tested to reliably evoke a range of curiosity levels across individuals (for sample questions, see figure 2.1;
for the complete list of questions, see appendix 2.7.1).
Figure 2.1 Sample questions with relatively high (left: average 5.72 out of 7) and low (right: 2.28 out of 7) curiosity ratings.
Experimental Procedure
Written instructions were provided outside the scanner (appendix 2.7.2). Once subjects understood the experimental procedure, they were put in the scanner for the task. Each experimental session consisted of 4 runs, with each run containing a set of 10 questions, which were randomly presented within each run. There was a one-minute break between runs, due to physical restrictions on the scanner. Each trial consisted of 5 epochs: (1) the
3 Initially, 20 subjects participated, but one subject was discarded because he received instructions in the scanner instead of outside, and showed odd behavioral data—his mean curiosity rating was “7,” the maximum allowed, not creating enough variation in curiosity across questions.
first presentation of a question, (2) selection of curiosity rating, (3) confidence rating, (4) second presentation of the question, and (5) display of the answer. The curiosity and confidence rating epochs were self-paced; the durations of the three presentation/display epochs were independently randomized within a set range, which is explained below and shown in figure 2.2. The task was presented to subjects through MRI compatible goggles.
Subjects were given 12 to 15 seconds to read the question, followed by a fixation screen displayed for 4 to 6 seconds, and they were instructed to silently guess the answer while reading a question. The subjects were then asked to indicate the extent of their curiosity about the correct answer as well as the level of confidence they had in their guess. The curiosity and confidence rating epochs were self-paced; the subjects moved on to the next screen by making their selection with an MRI-compatible button box. These rating screens were also followed by fixation-cross screens. After the confidence level was entered, the question was presented again for 3 to 5 seconds, and then the answer was revealed, below the question, for 4 to 6 seconds. To keep the motor requirement of the task minimal, the presentation of questions and answers was designed to not be self- paced. Each complete cycle, or trial, took about a minute, with the entire experiment lasting approximately 45 minutes. Following the scanner part, the subjects were asked to self-report their initial guesses at the correct answers to the questions and to fill out a questionnaire. This self-reporting part was conducted outside of the scanner, due to the difficulty of collecting verbal, typed, or written responses while the subject is inside the scanner tube.
Figure 2.2 Experimental timeline.
fMRI Data Acquisition and Preprocessing
Data were acquired using a 3-T Siemens (Erlangen, Germany) Trio scanner at Caltech. A set of high-resolution (0.5 0.5 1.0 mm3) T1-weighted anatomical images was first acquired to enable localization of functional images. Whole-brain T2*-weighted echoplanar images with blood-oxygenation-level-dependent (BOLD) contrast were acquired in 32 axial slices (64 × 64 voxels; 3 mm thickness and 3 mm in-plane resolution) at a repetition time of 2000 ms and echo time of 30 ms. The scan sequences were axial slices approximately parallel to the AC-PC axis. The fMRI data were preprocessed using SPM2 (Welcome Department of Imaging Neuroscience, Institute of Neurology, London, UK). Functional scans were first corrected for slice timing via linear interpolation. Motion correction of images was performed using a 6-parameter affine
transformation followed by nonlinear warping using basis functions (Ashburner &
Friston 1999). Finally, images were smoothed with a Gaussian kernel of 8 mm FWHM.
fMRI Data Analysis
The data analysis was conducted using the random effects general linear models (GLM) for event-related designs in SPM2. In all imaging data analyses, the regressors were modeled using box-car functions, convolved with a canonical hemodynamic response function. All four runs were concatenated and treated as one run and to control for the variance between sessions from concatenation, session dummy variables were included as separate regressors. Images were adjusted for both global intensity, using proportional scaling; and for low-frequency physiological drifts, using a high-pass filter of 128 seconds. Autocorrelation of the hemodynamic responses was modeled as an AR(1) process. Parameters were estimates from a ReML procedure. We initially performed 19 separate single-subject analyses: voxel-by-voxel statistical parametric maps of the t- statistic for each contrast of interest were defined for each subject. These contrast maps were then integrated to derive contrast images for second-level group T-tests and ANOVA (Ashburner et al. 1997; Friston et al. 1995; Genovese et al. 2002).
1. Curiosity Median Split Analysis. Each subject's trials were split into two conditions (high or low) according to where they fell relative to that individual's median curiosity level. Then all five epochs in each trial (first presentation, curiosity rating, confidence rating, second presentation, and answer display) were classified as being in the high- or low-curiosity condition according to the condition to which the whole trial had been assigned. Thus, there were two curiosity conditions for each epoch, resulting in a total of
10 separate regressors of interest. Each regressor was time locked to stimulus presentation. A GLM including these 10 regressors plus regressors of no interest was estimated. The 10 regressors of interest were modeled using box-car functions with the length of each epoch (e.g., the presentation time for the first answer) as the corresponding box-car duration. We then calculated contrasts to compare the effects of high versus low curiosity.
2. Curiosity interaction analysis. We also examined whether the brain activations identified in the median-split analysis increased linearly with curiosity level, rather than being associated with two levels (high or low). We estimated a GLM in which normalized curiosity was a parametric modulator for each of the five epochs.
3. Residual curiosity analysis. This analysis was performed to investigate the effect of curiosity that is dissociated from confidence level, P, and uncertainty, P(1 − P).4 To do this, we first regressed curiosity on P and P(1 − P) 5 (with a constant) and then took the residuals from this regression to construct a new variable, called the “residual curiosity.”
Further, to study the interaction between residual curiosity and correctness of guess, we divided the answer-display epochs into correct- and incorrect-guess conditions. This procedure resulted in a total of 6 conditions of interest: first presentation, curiosity rating, confidence rating, second presentation, answer display preceded by a correct guess, and
4 Uncertainty, P(1 − P), measures a subject’s uncertainty about a guess. A guess is a random variable (more specifically, a Bernoulli random variable) with two outcomes, correct or incorrect; the two outcomes have probabilities of P (confidence level) and (1− P), respectively. The uncertainty associated with the random variable (or uncertainty about which outcome will occur) is measured by the entropy, which in this case is a monotonic function of the variance P(1 − P). P(1 − P) is a quadratic function with a maximum at P = 0.5 and minima at P = 0 and 1. For example, suppose that you are 100% (or 0%) sure about your guess. In this case, your confidence level, P, is 1 (or 0). Your uncertainty about the outcome will be minimal. In contrast, if your confidence level about your guess is .5, then you are most uncertain about which outcome will occur because the two outcomes are equally likely.
5 Raw curiosity level was normalized at an individual level. See behavioral results.
answer display preceded by an incorrect guess. We then estimated a GLM in which residual curiosity, P(1 − P), and P were parametric modulators for each of these six conditions.
Behavioral Results
Curiosity is Correlated with Uncertainty P(1 − P) and Peaks around Confidence P = 0.5 Prior to all the analysis herein, raw curiosity ratings, ranging in value from 1 to 7, were normalized for each individual (subtracting each individual’s mean and dividing by each individual’s standard deviation). The information-gap theory predicts that curiosity should increase with statistical uncertainty, P(1 − P), since people who know very little have not had their curiosity piqued, and those who know a lot are satiated. Reported curiosity was indeed an inverted U-shaped function of P, reaching its maximum when P was around .50 (figure 2.3). Curiosity correlated positively with P(1 − P), r = .44, p <
0.0005. Most subjects showed this relation; estimated peak curiosity was at values of P between .45 and .55 in three-quarters of the subjects (table 2.1).
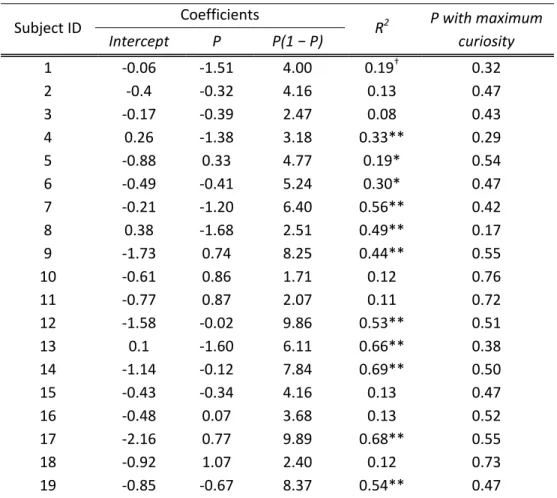
Further, at an individual level, most subjects show a quadratic relationship between curiosity and confidence level. Table 2.1 includes results from regressing fitted curiosity against a constant, P, and P(1 − P) and the confidence level that has the maximum curiosity (based on the regression estimates). Note that 12 of 19 subjects have estimated probabilities with maximum curiosity between .40 and .60.
Figure 2.3 Distribution of curiosity against confidence: The confidence scale ranged from 0% to 100% but was rescaled to range from 0 to 1. There was also a tip of the tongue (TOT) response option (Maril et al. 2001) but there were too few of these responses to analyze so they were excluded. All confidence ratings are jittered by adding a uniform random number over the interval [-0.005, 0.005]
to convey data density. Red stars indicate mean curiosity at each confidence level. The solid curve line is the regression line of curiosity against confidence P and uncertainty P(1 − P). The estimated regression is Curiosity = -0.49 – 0.39P + 4.77P(1 − P) + Residual curiosity.
Table 2.1 Individual regression analysis of normalized curiosity level against P and P(1 − P)
Subject ID Coefficients
R2 P with maximum curiosity Intercept P P(1 − P)
1 ‐0.06 ‐1.51 4.00 0.19† 0.32
2 ‐0.4 ‐0.32 4.16 0.13 0.47
3 ‐0.17 ‐0.39 2.47 0.08 0.43
4 0.26 ‐1.38 3.18 0.33** 0.29
5 ‐0.88 0.33 4.77 0.19* 0.54
6 ‐0.49 ‐0.41 5.24 0.30* 0.47
7 ‐0.21 ‐1.20 6.40 0.56** 0.42
8 0.38 ‐1.68 2.51 0.49** 0.17
9 ‐1.73 0.74 8.25 0.44** 0.55
10 ‐0.61 0.86 1.71 0.12 0.76
11 ‐0.77 0.87 2.07 0.11 0.72
12 ‐1.58 ‐0.02 9.86 0.53** 0.51
13 0.1 ‐1.60 6.11 0.66** 0.38
14 ‐1.14 ‐0.12 7.84 0.69** 0.50
15 ‐0.43 ‐0.34 4.16 0.13 0.47
16 ‐0.48 0.07 3.68 0.13 0.52
17 ‐2.16 0.77 9.89 0.68** 0.55
18 ‐0.92 1.07 2.40 0.12 0.73
19 ‐0.85 ‐0.67 8.37 0.54** 0.47
Note: Confidence ratings (0% ~ 100%) are rescaled to range from 0 to 1.
† significant at p<0.05
* p<0.01
** p<0.001
fMRI Results
In this section, we first focus on brain activity when questions were initially presented and then discuss brain activity when answers were presented. Results are reported for brain areas with significant activity at an uncorrected p-value of 0.001 and cluster size
k5 unless noted otherwise.
Curiosity is Correlated with Activity in Reward Regions
The first question-presentation epoch was associated with the high- or low- curiosity condition according to the individualized median curiosity level. We created a contrast that identified regions whose activity was greater in response to high curiosity than in response to low curiosity. Significantly activated regions include the left caudate;
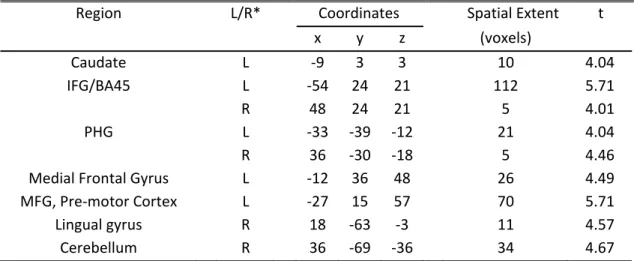
bilateral prefrontal cortex (PFC), including inferior frontal gyrus (IFG) (figure 2.4a); and parahippocampal gyri (PHG) (table 2.2). Activations in the putamen (x, y, z = 21, 9, 9), t(18) = 3.15, and the globus pallidus (x, y, z = 12, -6, 0), t(18) = 3.94, were significant at a more lenient p-value of 0.005 (uncorrected), but no activation was found in the nucleus accumbens. The area of significant activation in the left caudate overlaps with areas of significant activity identified by the models using subject-normalized linear curiosity and residual curiosity as the regressors (figure 2.4b). This finding is consistent with the view of curiosity as anticipation of rewarding information.
Figure 2.4 Differential brain activity in high and low curiosity trials during first question presentation (p<.001 uncorrected, extent threshold >5). Overlapped regions of activation in bilateral PFC (a) and the caudate (b) by curiosity from three different dependent variable models: High > Low median-split curiosity (red); linear in curiosity (yellow); linear in residual curiosity from the figure 2.3 regression (green). Note that we did not find activation in OFC regions as one might expect, but this is not surprising because our sequence was not optimized to detect OFC activations. (right) Overlapped close-up of caudate activations from the same three different models in (b).
Table 2.2 Brain regions associated with high curiosity, relative to low curiosity, during the first question presentation
Region L/R* Coordinates Spatial Extent t
x y z (voxels)
Caudate L ‐9 3 3 10 4.04
IFG/BA45 L ‐54 24 21 112 5.71
R 48 24 21 5 4.01
PHG L ‐33 ‐39 ‐12 21 4.04
R 36 ‐30 ‐18 5 4.46
Medial Frontal Gyrus L ‐12 36 48 26 4.49 MFG, Pre‐motor Cortex L ‐27 15 57 70 5.71
Lingual gyrus R 18 ‐63 ‐3 11 4.57
Cerebellum R 36 ‐69 ‐36 34 4.67
All locations are reported in MNI coordinates. * Laterality
Curiosity is Correlated with Memory-Related Regions when Incorrectly Guessed Answers are Revealed
When the answers were revealed, activations in areas linked to learning and memory were much stronger if the subject’s prior guess had been incorrect, rather than correct.
Areas differentially activated when subjects guessed incorrectly included the bilateral putamen and left IFG (Broca’s area) (figure 2.5).
Figure 2.5 Regions which are more active in response to answers after making incorrect guesses than to correct guesses:
Bilateral putamen (right: x, y, z = -24,-9,6, t(18)=4.63; left: x, y, z = 24,-9,12, t(18)=4.77), left IFG (Broca’s area, BA 44/45).
Figure 2.6 Regions having activity correlated with novel information (wrong answers × curiosity). Left IFG (left), Left PHG (right).
Table 2.3 Brain regions linearly correlated with residual curiosity during answer display when subjects initially guessed incorrectly
Region MNI Spatial Extent T statistic
L/R x y z (voxels)
Parahippocampal Gyrus L ‐24 ‐27 ‐6 19 4.69
Inferior Frontal Gyrus L ‐54 9 24 76 4.48
DLPFC/BA 9 L ‐51 15 30 4.23
Inferior Frontal Gyrus L ‐45 30 3 88 5.98
Lingual Gyrus L ‐12 ‐63 ‐6 40 5.31
Superior Temporal Gyrus L ‐60 ‐57 12 5 4.6
Superior Frontal Gyrus L ‐21 48 12 9 4.36
Medial Frontal Gyrus L ‐6 15 51 8 4.07
Cerebellum R 9 ‐72 ‐30 125 6.12
Furthermore, curiosity level modulated the activations during the answer display. After an incorrect guess, left PHG and left IFG activations during the answer display were positively correlated with residual curiosity (figure 2.6, table 2.3). Bilateral midbrain regions (left: x, y, z = -12,-24,-6, t(18) = 3.37; right: x, y, z = 12,-21,-18, t(18) = 3.97) were also activated at p<0.005 (uncorrected), as was the hippocampus (x, y, z = -27,-33,- 6, t(18)=3.2) (not shown). The identified area in left IFG was dorsal to areas identified in the analyses of the question epoch (figure 2.4a) and was part of Broca’s area, which is
important for language comprehension (Bookheimer 2002). When subjects guessed correctly, residual curiosity did not correlate with any of the identified regions.
Because memory-related regions were differentially activated in response to answers presented after incorrect guesses, and the activity was modulated by curiosity, we hypothesized that curiosity would be associated with “memory enhancement” for new information (in this paradigm, a correct answer is new information if it follows an incorrect guess). That is, we hypothesized that after guessing incorrectly, people would be more likely to remember the answer to a question if they were curious to know it.
The findings from the fMRI study suggested that curiosity is anticipation of rewarding information and that it may enhance learning of new information. We tested these hypotheses in separate experiments. We first describe the experiment that tested the memory-enhancement hypothesis and then report the experiment that tested the reward- anticipation hypothesis.
2.3 Study 2: Curiosity Enhances Memory
Experimental Design and Methods Participants and Task
Sixteen Caltech students (11 males, 5 females) participated in the first task. Fifteen subjects returned for a follow-up memory test. Two returned within 1 week and exhibited too high recall rate (over 90%) and one returned in 3 weeks—the data from these three subjects were not used for the memory analysis reported below.
The experimental procedure was very similar to that for the functional imaging study, having a few modifications: (a) the order of questions was randomized across all 40 of the question trials, (b) fixation screens were removed (these were necessary in fMRI to allow the BOLD signal to dissipate between decision epochs, but are unnecessary in a behavioral study), (c) the first presentation screen time was fixed at 10 seconds of exposure (rather than 12~15 seconds in the fMRI study), (d) a ‘count-down’ of five seconds was presented onscreen immediately before the answer was displayed in order to attract subjects’ attention and precisely quantify their pre-answer anticipation in terms of pupil size, (e) since there were few tip-of-the-tongue responses in the fMRI study, the TOT option was removed from the confidence scale, (f) between the curiosity and the confidence rating screens, a “give answer” screen was presented and subjects were asked to state their guess out loud so that an experimenter could record it.
Measures
Behavioral measures in this study included those of Study 1 (curiosity and confidence levels, guesses) with the change that subjects’ guesses were recorded during the task (as a check on post-scanner over-reporting of correct guesses in Study 1, which was minor; see table 2.4). This study included two additional behavior measures, including pupil dilation response and whether the subjects recalled the correct answers in a follow-up session.
Upon completing the (initial) task, subjects were unexpectedly asked to return within 11- 16 days for a follow-up study. Twelve returned in about 2 weeks and were used in the analysis. In the follow-up session, subjects were shown the same questions and asked to recall the correct answers (earning $0.25 for each correct answer), in addition to $15 for participation.
Pupil dilation response (PDR) was measured before and after the answer display using a Mobile Eyelink II eyetracker (SR Research, Osgoode, Ontario) at 250 Hz. Experiments were conducted and analyzed in Matlab (Mathworks, Natick, MA) using the Psychophysics Toolbox (Brainard 1997) and the Eyelink Toolbox (Cornelissen et al.
2002). In regards to the pupil dilation data, blinks were treated as missing data and removed. We focused on the time interval from 4.8 seconds before to 4.8 seconds after the onset of the answer display. After normalization, we split the pupillary data collected over this interval into groups of high-, middle-, and low-curiosity level. The data were then averaged every 400 msec across subjects (figure 2.7).
Table 2.4 Two-sample t-test of the accuracy rate of fMRI subjects’ post-scan guesses and Study 2 subjects’ online guesses (equal variances assumed)6
Study 1
fMRI subjects
Study 2 Behavioral subjects
Mean 0.31 0.27
Variance 0.01 0.01
Observations 19 15
Pooled Variance 0.01
p‐value .11
Results
Pupils Dilate in Response to Curiosity-Piquing Questions
Trials were divided into three terciles based on curiosity as measured in the initial session. On high-curiosity trials, PDR responses ramped up 1 to 2 s before the answer
6 One outlier is excluded from the subject group in Study 2. The outlier subject was a visiting international
student for the summer, who was not familiar with American cultural trivia and showed strong
underperformance (accuracy rate = 0.075). The fMRI-behavioral group difference is slightly larger (.31 vs.
.26) and slightly more significant if the outlier is included.
onset, peaked 800 ms after, and then dropped back to baseline around 2 seconds afterward (figure 2.7). Average PDR during anticipation (1 second before the answer onset) was significantly higher for high curiosity items as compared to middle curiosity items (p < 0.03, one-tailed t-test), and modestly different for middle as compared to low curiosity items (p =0.13, one-tailed t-test). When the answer appeared (0~1000 ms after the onset), the average PDR was significantly different among all three groups (p < .03 or lower, one-tailed t-test).
Figure 2.7 Pupillary response. Curiosity correlates with pupil dilation before and just after answers are revealed. The y-axis shows individually normalized pupil dilation (n=16) around the time of answer display, for different levels of curiosity: high (above the 67th individual percentile) in blue, low (below the 33rd individual percentile) in red, and middle in green. The average pupil dilation in this time interval for each subject was normalized to 100.
Ordinary least squares (OLS) regression analysis was performed to confirm the effects of curiosity on PDR, while controlling for individual fixed effects and a quadratic time trend. The regression analysis shows that an increase of one standard deviation in
curiosity level results in a 0.76% (standard error 0.34%) and 0.86% (0.35%) increase in average PDR during the anticipation and answer viewing, respectively (table 2.5).
Table 2.5 Pupil dilation response (PDR) regressions. Regress average PDR (individual mean=100) with curiosity level (CURIO), controlling for individual fixed effects (results not shown) and a quadratic time (QUESTION) trend;
standard errors in parentheses. N<640 since some PDR are missing (blinks, etc.)
Period of Interest Anticipation (‐1~0 s)
Answer viewing (0~1 s)
Drop‐off (1~2 s)
Constant 106.741**
(1.745)
107.941**
(1.721)
102.200**
(1.607)
CURIO 0.740†
(0.358)
0.738† (0.354)
0.384 (0.329) confidence P 0.089†
(0.036)
0.254**
(0.036)
0.247**
(0.033) uncertainty P(1 − P) 0.0008†
(0.0004)
0.0024**
(0.0004)
0.0027**
(0.0004)
QUESTION ‐0.398**
(0.120)
‐0.433**
(0.118)
‐0.392**
(0.110) QUESTION2 0.006†
(0.003)
0.006† (0.003)
0.005 (0.003)
N 632 639 636
F 6.79 9.809 9.476
F‐test p‐value 0 0 0
R2 0.155 0.216 0.211
Note: † t-test significant at p<0.05; ** at p<0.001
QUESTION denotes the number in which the question appeared in the temporal order to capture adaptation effects. Note that curiosity reliably increases PDR just before and after viewing the answer (second and third column results) but is insignificant in the 1-2 s after the answer presentation, while the effects of confidence and uncertainty persist.
Initial Curiosity Enhances Subsequent Memory for Incorrectly Guessed Answers
Curiosity as expressed in the initial session had a strong effect on subsequent recall of the answers to the questions that were initially guessed incorrectly (figure 2.8). The accuracy rates differed significantly between high- and middle-curiosity items; middle- and low- curiosity items; and high- and low-curiosity items (all p’s <0.05, paired one-tailed t- tests).
Figure 2.8 Percentage accuracy on the memory test for trials in which subjects initially guessed incorrectly. Focusing only on the answers initially guessed incorrectly, we divided the answers into three (high/middle/low) curiosity groups.
Then the average accuracy rate was computed for each group across subjects, by dividing the number of correct recalls by the number of total answers to be recalled.
We repeated the same procedure with the residual curiosity (as defined in Study 1).
Average accuracy rates are 56% (5.14%) for high, 51% (5.81%) for middle, and 38%
(6.40%) for low curiosity questions (standard error in parenthesis). The difference in accuracy rate between high vs. middle was in the right direction but insignificant (p=0.17, paired one-tailed t-test). However, the differences between middle vs. low and also between high vs. low were significant (p<0.04 and p<0.01, respectively, paired one-tailed t-tests). The result is a little bit weaker, but still consistent with the previous results. We also show a main effect of curiosity on recall when we repeated the analysis, including control variables P and P(1 − P). Consistent with the fMRI findings, these results support the hypothesis that curiosity activates memory regions differentially in response to surprising (incorrectly guessed) answers, resulting in greater accuracy of subsequent recall of the correct answers.
OLS and logistic regression analyses were also performed to confirm the effects of curiosity on memory enhancement. The dependent variable, correct recall in the memory test (coded as 1 for a correct recall and 0 for an incorrect recall), was regressed on curiosity level interacting with two dummy variables that indicate whether subjects initially guessed the answer correctly or not. The regression analyses also find consistent evidence that curiosity modulates the later recall rate for answers to questions that subjects initially guessed incorrectly (table 2.6).
Table 2.6 Memory test regressions: correct recall (1 = recalled the correct answer in memory test, 0 = otherwise) was regressed on confidence P, uncertainty P(1 − P), initial correctness(INI-CORRECT, 1 = initially guessed correctly, 0 = otherwise), initial ‘incorrectness’(INI-WRONG, 1 = initially guess incorrectly, 0
= otherwise), and curiosity level interacting with initial correctness (CURIO*INI- CORRECT, CURIO*INI-WRONG, respectively), controlling for individual fixed effects (fixed effect results not shown).
Regression Method OLS (s. e.)
OLS (s. e.)
OLS (s. e.)
Logit (s. e.)
Logit (s.
e.) Constant (Last subject) 0.362**
(0.075)
0.362**
(0.075)
0.386**
(0.070)
‐0.788† (0.371)
‐0.752† (0.375) CONFIDENCE P 0.474**
(0.072)
0.478**
(0.087)
0.127 (0.091)
2.686**
(0.444)
3.142**
(0.676) UNCERTAINTY P(I‐P) ‐ ‐0.017
(0.257)
‐0.083
(0.240) ‐ ‐1.573 (1.624)
INI‐CORRECT(‡) ‐ ‐ 0.452**
(0.052) ‐ ‐
CURIO*INI‐CORRECT 0.033 (0.040)
0.034 (0.042)
0.035 (0.039)
0.104 (0.232)
0.166 (0.247) CURIO*INI‐WRONG 0.072*
(0.024)
0.072*
(0.024)
0.078**
(0.022)
0.345*
(0.120)
0.350*
(0.120)
N 520 520 520 520 520
F–statistic/ LR 6.952 6.505 11.540 99.763 100.735
F‐statistic/LR‐test p‐value 0.000 0.000 0.000 0.000 0.000
R2 0.147 0.145 0.257 0.187 0.189
Note: † t-test significant at p<0.05; * p<0.01;** p<0.001.
(‡) Logit analysis including initial correctness could not be performed due to multicollinearity.
2.4 Study 3: Curiosity as Reward Anticipation
Experimental Design and Methods Participants
Participants in Study 3 were assigned to one of two conditions: a token condition (10 Caltech students, mean age = 23.4±3.3 years, 5 males, 5 females) and a time condition (20 Caltech students, mean age = 19.9±2.2 years; 12 males, 8 females).
Initially, 21 subjects participated in the time condition, but one subject was excluded for further analysis because his data showed that he was not engaged in the task—first, he did not take enough time to comprehend a question (evidenced by the fact that he spent only 2.1 seconds, which is only a third of the time that other 20 subjects spent reading a question on average) and second, his curiosity and confidence ratings were highly correlated with anchor ratings (70% and 65%, respectively)7, which means that he submitted anchor ratings instead of his own. Informed consent was obtained using a consent form approved by the internal review board at Caltech.
Task and Measures
The task and timeline were similar to the previous experiments except for two modifications (figure 2.9). First, in this experiment, subjects had to spend scarce resources—either an experimental token or waiting time—to learn answers. Second, 10 questions were added to the original 40 questions.8
7 At the start of each rating screen, a computer randomly selected an initial rating which a subject started toggling buttons from. We call this starting-point rating an anchor rating.
8 We were concerned that in the token condition some subjects might spend their tokens too quickly or too slowly, so that they would have either none left or many left before the last few questions. If so, their token choices in those later trials would not reflect their true desire for information. We therefore added 10 new questions at the end as padding and excluded them from the analysis, using only the same 40 questions