INTRODUCTION 1. Background
Research Questions
Is there an impact of size, profitability, tangibility, non-debt tax shields, operational risk and capital structure growth in non-financial business entities registered during 2007-2011 in Indonesia Stock Exchange. Among these factors, there is a dominant factor affecting the dynamic compromise capital structure (adjustment speed) in non-financial business entities registered in the period 2007-2011 on the Indonesian Stock Exchange. How the image of the existence of a dynamic capital structure trade-off for non-financial business entities registered in the period 2007-2011 Indonesia Stock Exchange.
Research Purpose and Benefits
Third, to open up opportunities for other researchers who want to develop in the field of capital structure research.
LITERATURE REVIEW AND HYPOTHESIS DEVELOPMENT
- Capital Structure
- The Theory of Capital Structure
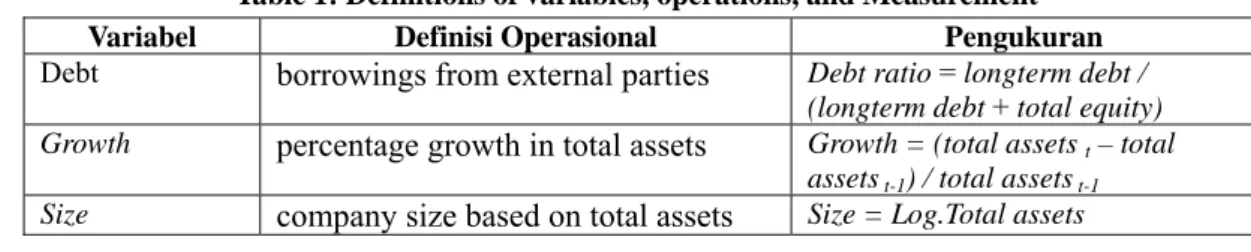
- Debt
- Growth and the Effects on Debt
- Size and the Effects on Debt
- Profitability and the Effects on Debt
- Tangibility and the Effects on Debt
- Non-Debt Tax Shield and the Effects on Debt
- The Operating Risk and the Effects on Debt
- The Process of Adjustment to the Optimum Capital Structure
The implication of this model is the existence of the target debt ratio, where the business entity always makes adjustments towards the target. This means that a pecking order theory does not explain the existence of the target debt ratio in a business entity. The use of debt can reduce the amount of taxes that must be paid by the business unit because the debt interest payments have resulted in lower pre-tax income.
Growth is the growth of a business entity to maintain its position through sales (Mazur, 2007). The definition of size according to Bouallegui (2006) is a large small business unit that can be measured by the total assets of the business unit. The larger the size of a business unit, the lower the probability of bankruptcy of a business unit (Titman and Wessels, 1988, in Bouallegui, 2006; Rajan and Zingales, 1995).
Profitability is the ability of business entities to make a profit after a reduction in revenue from business taxes (Gitman. So the business entity will use the component in addition to debt to reduce the tax burden because the use of debt increases the financial burden Business risk is the level of income volatility of business entity functionality (Abor and Biekpe, 2005).
The higher the volatility of earnings stream of a business entity, the greater the chance of a bankruptcy of the business entity. The higher the operational risk of a business entity, the greater the chance of a bankruptcy of the business entity. Any adjustment to the direction of the forecasted leverage explained that the business entity has a target debt ratio.
RESEARCH METHODS
- Research Type
- Variables and the Operational Definitions
- Populations and Samples
- Measurement Levels and Data Collection Procedures
- Data Processing Methods
- Hypothesis Testing
The characteristics of the population that are used are: (1) Publication of a financial report every year in order during the period 2007-2009 and are audited; (2) has a long-term debt; (3) not being in the process of being delisted is resuspended. The minimum samples to be taken is 30%. may be more) of the target population (whose population meets the characteristics). The ratio is used because it is the level of the unit of measurement that represents the true value in any given result or observation which means having a zero point as the origin.
Stages in these analysis techniques are as follows: (1) determine the value of the variables for each of the selected business entities during the study period; (2) Identify the symptoms of a classical assumption with the aim of preserving the regression models that can produce an unbiased penduga (invalid) made with normality test, test, test for multicollinearity, autikorelasi and test heteroskedastisitas. 3) Run the regression analysis data after determining the value of the data used in the study with the equation of linear regression analysis on double's model. Multiple linear regression was used to analyze the variables associated with the study of the dependent variable one dependency (y) against some of the other free variables (x). 4) measures the power of the free variables of variables describing the boundary. The size of the R2 is a tool for measuring how well a regression model can explain.
The coefficient of determination describes how much of the variation in the dependent variable can be explained by variation in the proportions of the independent variable. This value has the meaning as follows: when R2 = 1, which means that the proportion of the variation of the variables is not free (capital structure), which can be explained by the proportion of the variation of the free variable (tangibility, profitability, growth, size, ISBN innocent tax shield , operational risks with debt) by 100% and when R2 = 0 or close to 0, which means that the proportion of the variation of the variables is not free (capital structure) cannot be explained by the variation of the proportion of the free variables (tangibility, profitability, growth, size, tax debt-free protection, risks of dealing with debt).
With development, in addition to the relationship between free and bound variables, a dynamic picture of the existence of a compromise capital structure can be determined. Data used in this study were processed using Microsoft Excel 2007 and Eviews 7.0 for Windows. One of the purposes of the performed regression analysis is to make predictions based on the values of the obtained regression equations of the dependent variable.
RESULTS AND DISCUSSIONS
The Data View
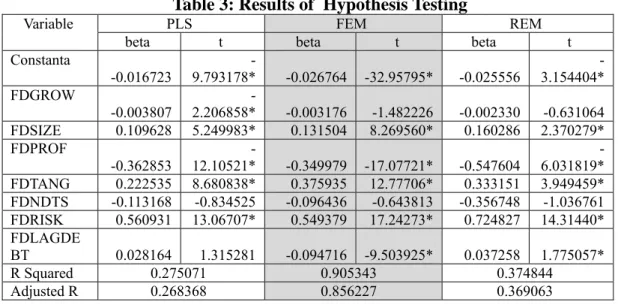
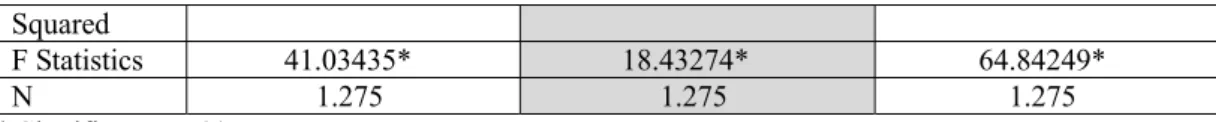
H0: β1, β2, β3, β4, β5, β6 = 0, which means tangibility, profitability, growth, size, innocent tax shield, business risks do not significantly affect capital structure. H1: β1, β2, β3, β4, β5, β6 ≠ 0, which means tangibility, profitability, growth, size, debt-free tax shield, operational risks significantly affect capital structure. Test the F criterion using a one-tailed test, if Sig <0.05, H0 is rejected and if Sig>.
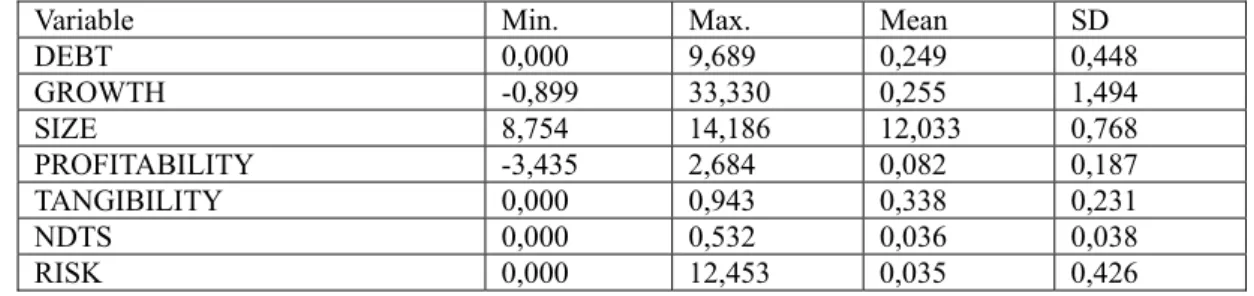
Testing was performed to test the overall comparison, if the test rejects H0, it can be concluded that the comparison is quite significant in describing the relationship between the two types of variables. If significant equation, the equation can be used to predict the variation in the dependent variable caused by variations in the independent variables. From the descriptive data shows that long-term debt on average the company has reached 25% growth rate over the past 5 years 25.5%, while the level of profitability on assets of 8%.
Importantly, during the study period, the average company using long-term debt is not too much compared to issuing shares to take advantage of significant growth opportunities. Considering that the issue of shares is more expensive, it can be seen that the average return is relatively low and amounts to less than 10%. Tangibility is on average 33.8%, which means that companies invest almost 35% of their funds in fixed assets.
Tangible fixed assets in the long-term average of the company show results of 35%, in accordance with the consumption of long-term debt of only 25%. This means that the tax savings from depreciation items are not too great for an average company depreciation of less than 4%. Operational risk, measured by volatility, shows an average income of relatively low risks below 4%.
Results and Discussion
Based on the size of the regression coefficients (beta), all independent variables affect the company's debt and variables that have the most influence are risk with a beta of 0.549379. Partly by using the t-test, the variables that significantly affect the amount of company debt are company size, profitability, tangibility, risk and debt delinquency period last year. Profitability has a significant negative effect, it means that the more profit the company used tends to decrease.
This is consistent with the pecking order theory, where the company will seek to use financial slack in the company, such as the use of marketable securities, and retained earnings to develop their business, so the higher the profitability of the company, the greater the financial slack held, the proportion of debt used will further decrease. Logical explanation of this finding is to have a large real assets, then the company can use it as collateral to borrow. The creditors will give credit more easily if the company guarantees it a real asset.
It is also supported by the results of descriptive statistics where the percentage of tangible assets reached 34%, and the company's long-term debt reached 25%. In accordance with the signaling theory, the use of debt for the company gave a positive signal indicating that the use of debt to investment companies have interesting business prospects. This means that if the debt was high in the previous period, to reduce the exposure to the business, the company will reduce the debt in the next period.
Conversely, if the debt is considered low-prior period, the company can raise debt in the current period to achieve tax savings. When seen from the results of descriptive statistics shows that the growth of the company in the period 2007-2011 is significant at 25%, but the rate of long-term debt is only 26% on average. Based on the results of the data processing, the company will over-adjust in the opposite direction to reach the optimal point.
CONCLUSION AND RECOMMENDATIONS
Conclusion
Recommendations
C., 2008, Pengaruh Kepemilikan Manajerial, Kepemilikan Institusional, Kebijakan Hutang, Profitabilitas, dan Ukuran Perusahaan terhadap Kebijakan Dividen, Jurnal Bisnis dan Akuntansi, Vol. French, 2001, Menghilangnya dividen: mengubah karakteristik perusahaan atau menurunkan kecenderungan untuk membayar?, Journal of Financial Economics, Vol.60: 3-43. Seperangkat peluang investasi dan kebijakan pembiayaan perusahaan, dividen dan kompensasi, Jurnal Akuntansi dan Ekonomi, Vol.
Hartono, J., 1997, Explaining the Agency Cost of Dividend Payments: Empirical Evidence, Working Papers, Universitas Gadjah Mada. Sami, 2004, Pool of Investment Opportunities, Director Ownership and Corporate Politics: Evidence from the Developing Market, Journal of Corporate Finance, Vol. Zorn, 1992, The Simultaneous Determination of Domestic Ownership, Debt and Dividend Policies, Journal of Financial and Quantitative Analysis, p.
Jurusan Manajemen FBE Ubaya, Pedoman Penulisan Skripsi Tahun 2009 Jurusan Manajemen Fakultas Bisnis dan Ekonomika Universitas Surabaya. A., 2002, Saling Ketergantungan antara Kebijakan Leverage dan Kebijakan Dividen: Perspektif Agency Theory, Jurnal Riset Akuntansi, Manajemen dan. Nuringsih, K, 2005, Analisis Pengaruh Kepemilikan Manajerial, Kebijakan Hutang, ROA dan Ukuran Unit Bisnis Terhadap Kebijakan Dividen: Kajian Jurnal Akuntansi dan Keuangan Indonesia Vol 2.
Nurfauziah, Harjito, DA, Ringayati, A., Gelijktijdige relatieanalyse tussen managementeigendom, risico, schuldbeleid en dividendbeleid in Agency Matters, Business and Management Studies, Vol. Suharli, M., 2007, Pengaruh Profitabilitas dan Set Peluang Investasi Terhadap Kebijakan Dividen Tunai Dengan Likuiditas Sebagai Variabel Penguat, Jurnal Ekonomi Akuntansi, Universitas Kristen Petra. Thomsen, S., 2004, Blockholder Ownership, Dividend and Firm Value on Continental Europe, Working Paper, Danish Social Science Research Council.