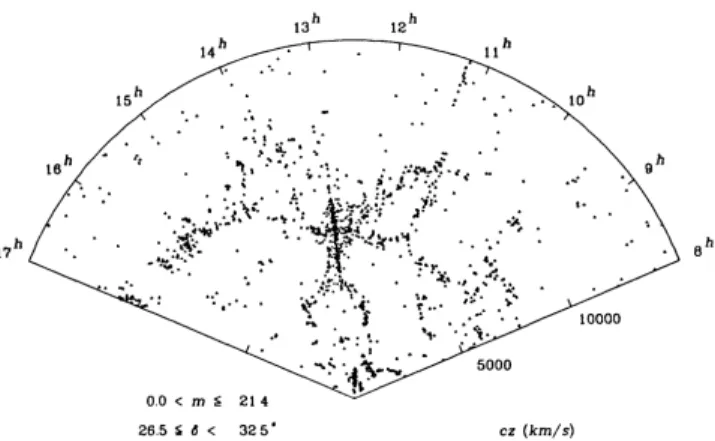
I am also grateful for all the "1-minute" conversations with him during all phases of graduate school. The universe consists of large-scale structure where galaxies form, evolve and eventually die.
An Expanding Universe in the Λ CMD Cosmological Model
This model is currently our best cosmological model for the formation and evolution of cosmic structure in the universe (Wechsler & Tinker, 2018). This model indicates that the total energy density of the universe today consists of about 70%.
Large-Scale Structure of the Universe
These disruptions to the density field led to the growth of structure in the universe, including galaxy clusters, galaxies, filaments, walls, and more. After inflation, the universe continued to expand, but at a slower rate, allowing nucleosynthesis to occur.
Observing the Universe
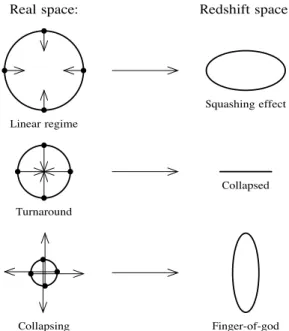
The directions of the arrows correspond to the directions of the pecular velocity vectors (Hamilton,1998). The measured redshift of galaxies is the result of a combination of the Hubble flux and the specific velocity of galaxies.
N-body Simulations and Mock Catalogs
The main cosmological simulation I use for these projects is the Large Suite of Dark Matter Simulations (LasDamas)1. LasDamas is a series of cosmological N-body simulations with the same cosmology but different initial conditions, which track the evolution of dark matter in the universe.
Summary
In the case of N-body simulations, once the simulation is complete, one can identify the particles belonging to dark matter haloes with a certain overdensity using a halo finding algorithm. The dark matter haloes are found by applying a Friend-of-Friends algorithm (Davis et al., 1985) with a bond length of 0.2 times the average separation between the particles.
Abstract
EXPLORING THE STELLAR CONTENT OF GALAXY GROUPS WITH VALUE-ADDED GROUP CATALOGS IN SDSS DR7 The following work will be submitted to the Monthly Notices of the Royal. Exploring the great content of Galaxy groups with value-added group catalogs in the SDSS DR7.
Introduction
Finally, we present and make available sets of galaxy group catalogs for three volume-limited samples of SDSS DR7. et al., 2012). Similarly, galaxy group catalogs have been used to better understand various aspects of the galaxy-halo connection, such as correlations between quenching properties of galaxies and those of neighboring galaxies (Weinmann et al., 2006;
Data and Methods
In addition, we use the catalogs of group galaxies to investigate the relationship between star and halo mass and the role of group mass in the extinction of galaxies. We assign specific star formation rates, (g−r) colors and Sérsic indices to mock galaxies by first adopting the formalism presented in Zu & Mandelbaum(2016, hereafter Z16), and then sampling from the original distributions of sSFR , (g−r). ) color and Sérsic indices of the three samples of SDSS galaxies.
Group-Finding Algorithm and Group Catalog
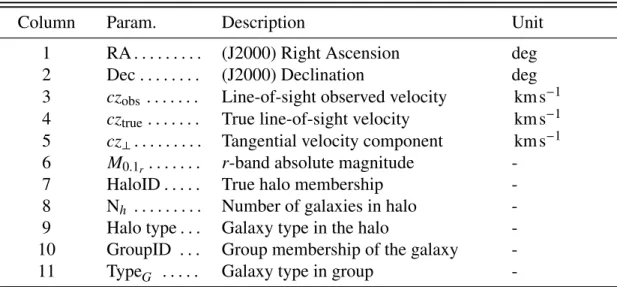
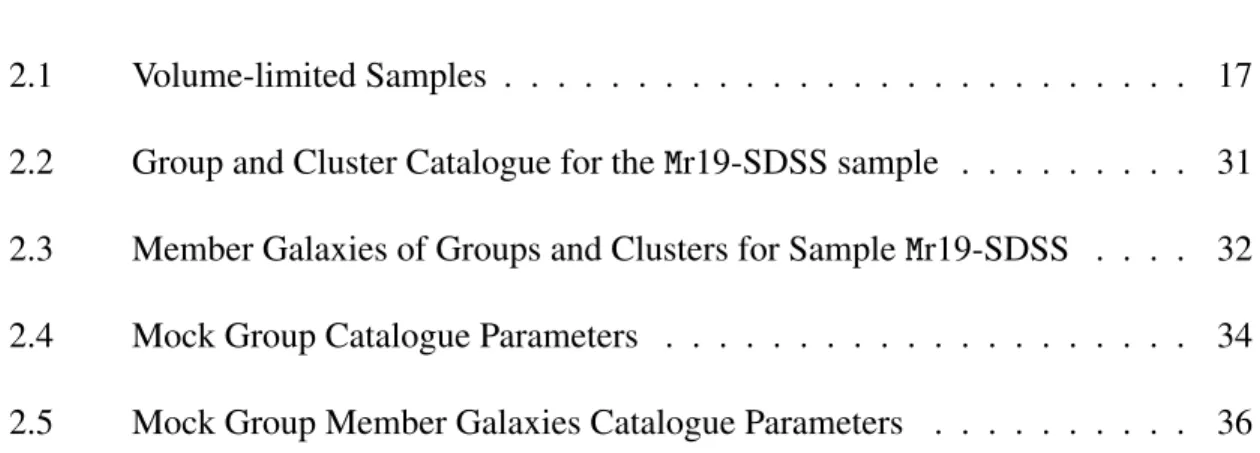
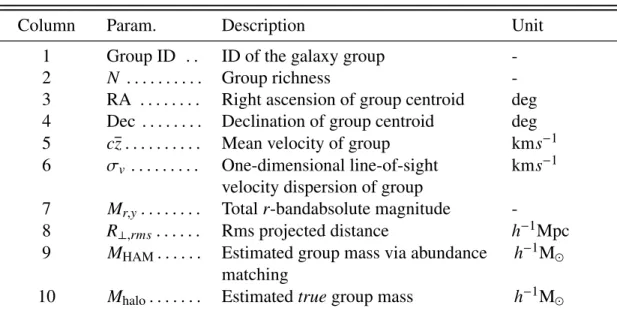
1 Group ID: This number corresponds to the group ID of the galaxies in the catalog. This number corresponds to the galaxy index in the property list from the NYU-VAGC catalog.
Group-Finding Errors
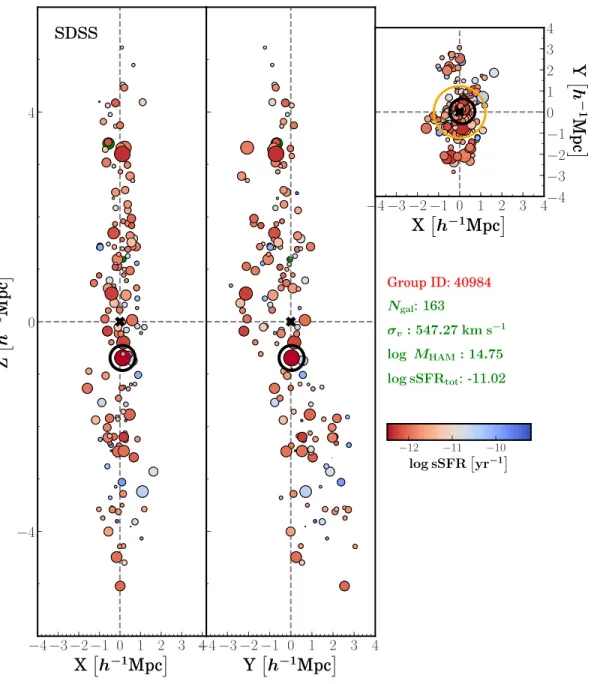
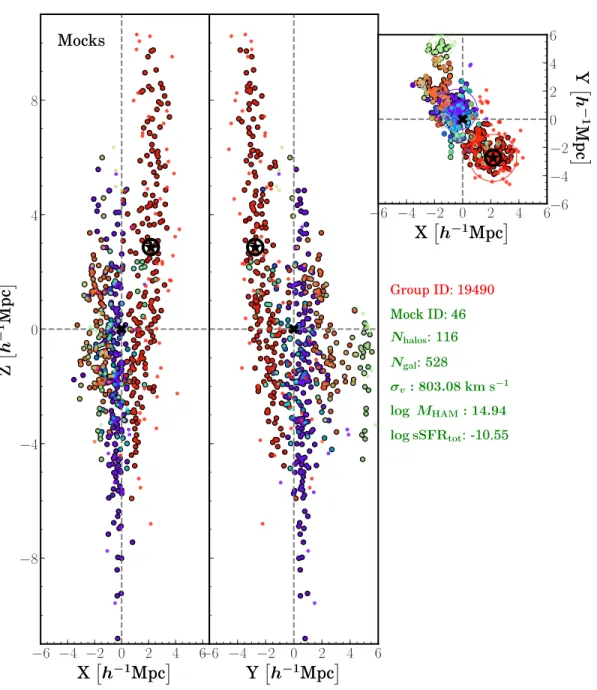
The black cross corresponds to the coordinates of the group center of gravity as defined in the berlind-fofgroup-finder. The black cross corresponds to the coordinates of the group center of gravity as defined by the group locator.
Stellar Content of Group Centrals and Group Satellites
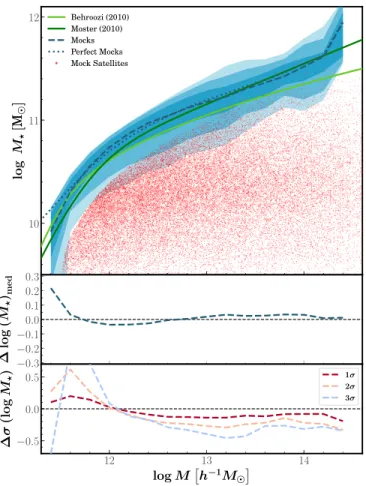
The solid blue line shows the median SHMR of group central galaxies in SDSS as a function of group mass, MHAM. The dashed blue line corresponds to the mean stellar mass ratio, M?, of the group of central galaxies as a function of group mass in the Mr19-Mock group catalogs. Finally, the red dots refer to the SHMRs of group satellite galaxies in the Mr19-Mock sample.
The solid blue line shows the mean SHMR relation of the central cluster galaxies in the SDSS as a function of the estimated cluster mass, MHAM.
Summary and Discussion
In this analysis, we perform a comprehensive analysis of the effect of group retrieval errors on several group-related statistics. Finally, we produce “full” versions of mock group catalogs that include redshift and space distortions and do not suffer from group finding errors. After defining precisely how the group-finding errors affected the inferred galaxy group statistics, we investigate the SHMR of the galaxies and calculate a correction factor that removes the effects of the group-finding errors.
Finally, we investigate the dependence of group mass on the quenching state of galaxies as a function of galaxy stellar mass, sSFR−M?, and investigate how it is affected by group finding errors.
Introduction
Finally, Knobel et al. (2015) used the group catalog of Yang et al. (2012) in SDSS DR7 to study the degree of coherence of the central satellite. 2015) used the isolation criteria in the UKIDSS (Lawrence et al., 2007) Ultra Deep Survey DR8 to investigate the redshift evolution of the correlation between the SFRs of central galaxies and satellite galaxies at intermediate to high redshifts (0.4 < z < 1, 9). Son et al. (2017, hereafter S17) performed a similar analysis and argued that isolation measures in K13 could potentially v-.
The work of Campbell et al.(2015) exposed the dangers of using cluster catalogs to study 1-halo conformation.
Data and Methods
This choice of linker lengths was optimized by Berlind et al. (2006) to identify galaxy systems living within the same dark matter halo. To this end, we produce a collection of 100 realistic mock catalogs based on the Large Suite of Dark Matter Simulations (LasDamas)3 project (McBride et al., 2009). Dark matter haloes were identified with the FoF algorithm (Davis et al., 1985) using a link length of 0.2 times the mean separation between particles.
Specifically, we use the CLF version of Cacciato et al. (2009) but slightly modified to match our accepted cosmological model (Van den Bosch, private com- .
Galactic Conformity Results
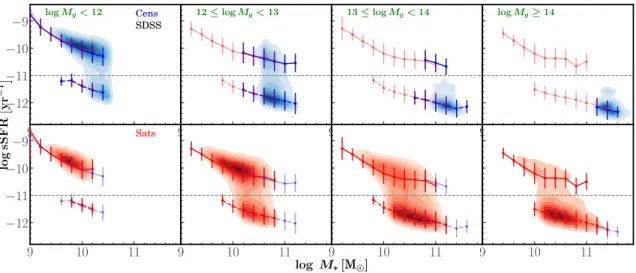
First we normalize using the average of all central galaxies or satellite galaxies in the same bin of Mgroup. The three columns show results for (g − r) color (left column), sSFR (middle column), and Sérsic index (right column), as measured in the Mr19-SDSS sample and the mock catalogs. The black lines in the upper portions of each panel show the ∆fq as a function of the projected separationrp, while the hatched contours show the 1σ, 2σ and 3σ ranges of ∆fq, an example of the 100 mock catalogs of each galaxy property.
As a result, the statistical significance of the conformity signal continues to increase with scale, because the dispersion in the apparent distribution decreases with scale.

Summary and Discussion
However, the marked correlation function is a more sensitive statistic for detecting 2-halo conformity as demonstrated by the much higher statistical significance of the weakly observed signals in the case of color and sSFR. Thus, we do not detect 1-halo conformity by the M(rp) statistic in any of the. However, we find a highly significant 2-halo conformation signal for Sérsic index in low mass groups of logM group < 12.4.
This result calls into question whether any study has actually detected a 1-halo coherence in the SDSS data.
Abstract
Finally, we apply the trained model to a galaxy and group catalog from the SDSS DR7 and present the resulting halo masses.
Introduction
Calderon et al.(2018) applied the Berlind et al.(2006) algorithm to the SDSS and used HAM to estimate halo masses, based on the integrated luminosities of the clusters. Moffett et al.(2015) did the same for the REsolved Spectroscopy of a Local Volume (RESOLVE;Eckert et al.,2015) and the Environmental Context catalog (ECO;Moffett et al., 2015). For the case of HAM, Campbell et al. 2015 ) compared three different FoF-based group finding algorithms by applying them to a realistic mock galaxy catalog where the halo masses are known.
More recently, ML algorithms have been used to measure cluster masses using a combination of dynamical and X-ray data (Armitage et al., 2019), and more complex.
Data and Methods
The center of the cluster is calculated as the center of the cluster member galaxy positions. 7 Luminosity ratio: Ratio between the r-band luminosity of the brightest and second brightest galaxies in the group. 8 Total brightness,Mr,to: The total band brightness of the group is the sum of the-.
9 Total specific star formation rate,sSFRG: Logarithmic value of the total specific star formation rate of the group.
Training and Testing ML algorithms
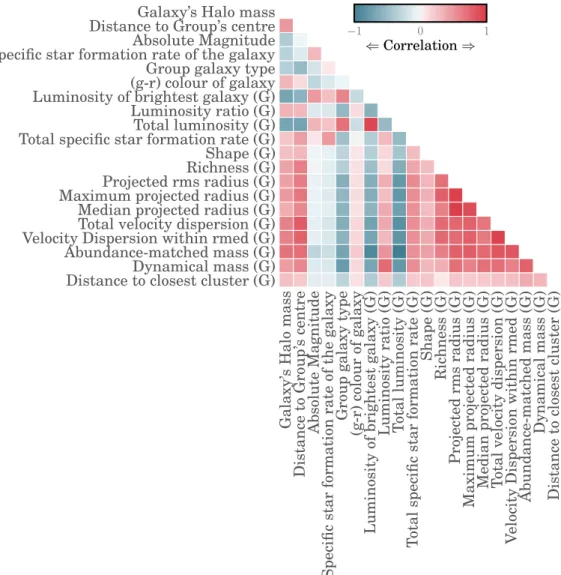
Distance from cluster center Absolute magnitude Specific star formation rate of galaxy Cluster galaxy type (g-r) Galaxy color Luminosity of brightest galaxy (G) Luminosity ratio (G) Total luminosity (G) Total specific rate of star formation (G) Shape (G) ) Richness (G) Projected rms radius (G) Projected maximum radius (G) Projected mean radius (G) Total velocity dispersion (G) Within-rmed velocity distribution (G ) Abundance-matched measure (G) Dynamic measure (G) Distance to nearest cluster (G). This figure conveys the point that the mass of the dark matter halo is closely related to almost all the features we consider for training various ML algorithms. For the rest of the analysis in this paper, we will exclusively use this set of features to train the different ML algorithms and evaluate their performance in accurately predicting halo masses.
Now that we have a final list of nine input features, we can proceed with training and testing the ML algorithms.
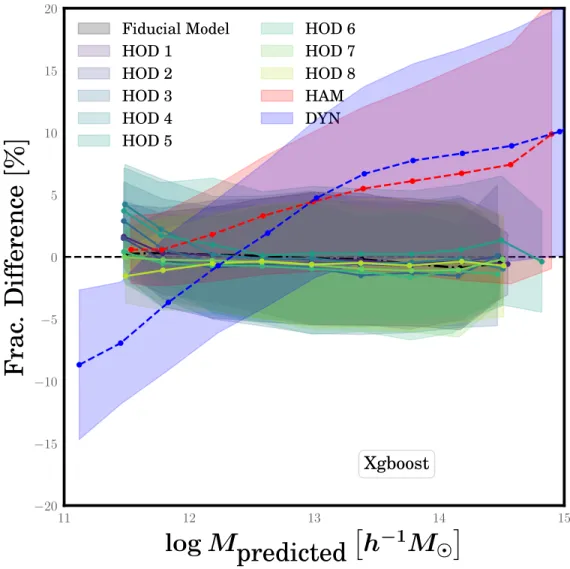
Are Mock-Trained Models Universally Applicable?
We then run the previously trained ML algorithms on these new test mock catalogs to investigate how much performance we lose by changing the HOD model in the test phase. The true amount of this spread in the real universe is most likely close to ~0.2, where our trained ML algorithms perform quite well. In the fiducial model, satellite galaxies are assigned the positions and velocities of randomly selected dark matter particles in their haloes.
Within the CLF model, the key parameter that controls the strength of the correlation between the mass of a halo and the luminosity of its central galaxy is σlogL, which is the log distribution of the luminosities of central galaxies of fixed halo mass.7 In the fiducial model we used to trained ML algorithms, the value of this distribution is σlogL=0.142.
Application to SDSS Galaxies
The x-axis shows mass estimates for galaxies via HAM (left panel) and DYN (right panel). The concern with using these masses is of course the possibility that the real universe does not look like our training data in some critical way and thus the predicted SDSS masses contain a large systematic error. While this is certainly possible, it is not likely because the fake catalogs are constructed in such a way that they have several statistical properties that are consistent with the SDSS data.
We are therefore reasonably confident that our ML halo masses are the best available measurements of the halo environments of galaxies in the SDSS and are safe to use.
Summary and Discussion
We determine the set of nine features (out of the 19 features from §4.4.1) that contribute most to the prediction of the halo mass of a galaxy. Of the nine features, we find that the two strongest features are the absolute magnitude of the galaxy in the band and the absolute magnitude of the brightest galaxy in the group to which the galaxy belongs. Spectrophotometric properties of galaxies and their groups, dynamical properties of the groups, and large-scale environments all correlate with halo mass in different ways.
In this dissertation, I have presented several different but related analyzes on various aspects of the galaxy-halo connection.
Cosmic web In the CfA Galaxy Survey
Schematic of Redshift-Space Distortions (RSD)
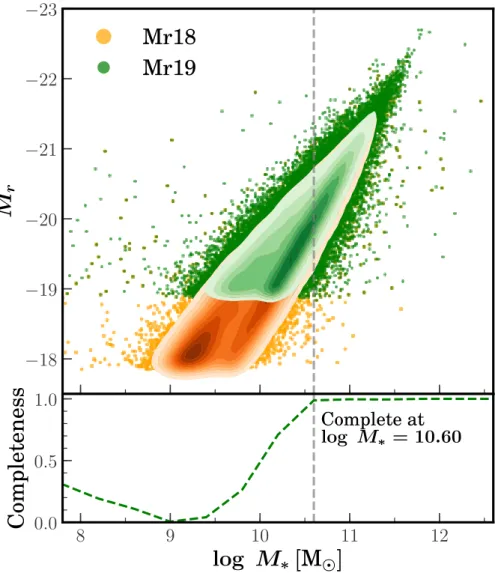
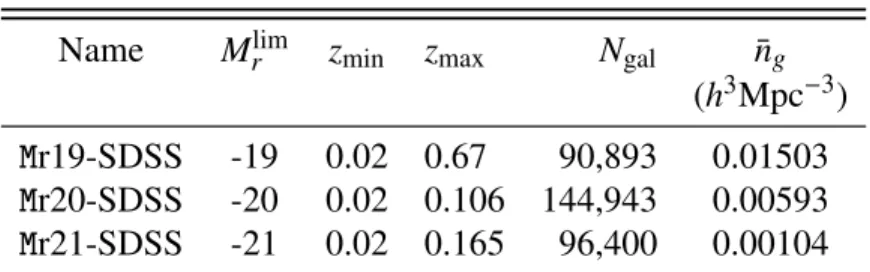
Sample Completeness of Mr19-SDSS
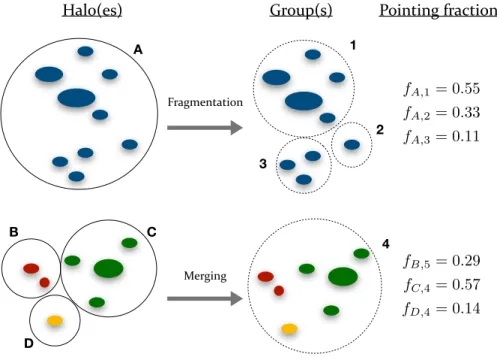
Illustration of Fragmentation and Merging of DM haloes
Schematic of 2nd Largest Galaxy Group in SDSS
Schematic of 2nd Largest Galaxy Group in Mock Catalogs
Purity and Completeness of Galaxy Group Catalog
Mass Comparison Among Di ff erent Types of Galaxy Groups in Mocks . 48
Stellar-Halo Mass Relation in SDSS
Correlation Matrix of Galaxy- and Group-related Features