Tujuan dari penelitian ini adalah untuk mengamati pengaruh perbedaan konsentrasi SnCl2.2H2O terhadap struktur kristal, morfologi, sifat optik dan elektrik film tipis ATO sehingga dapat digunakan sebagai lapisan konduktif transparan pada perangkat optoelektronik. Pengaruh penambahan doping antimon 2 wt% dan pengaruh konsentrasi SnCl2.2H2O terhadap struktur kristal, morfologi, sifat optik dan elektrik film tipis ATO sehingga dapat digunakan sebagai lapisan konduktif transparan pada perangkat optoelektronik.
Roadmap Penelitian
Film ATO dengan resistivitas serendah 1,121x103 Ωcm dan transmisi 80% pada panjang gelombang 550 nm dapat diproduksi menggunakan prekursor SnCl4.5H2O, dopan SbCl3 yang dilarutkan dalam metanol (5% mol Sb). Mereka berhasil menghasilkan film tipis ATO dengan resistivitas orde 104 Ω cm dan transmisi 75% di wilayah cahaya tampak.
METODE PENELITIAN
Diagaram Alir
Proses sintesis film tipis ATO langsung diendapkan pada substrat kaca menggunakan metode pirolisis semprot berbantuan ultrasound. Proses penumbuhan lapisan tipis SnO2 doping Sb (ATO) pada substrat kaca (2 cm x 0,1 cm) yang dipanaskan di atas hot plate pada suhu 450 o C Jarak antara nozzle dan permukaan media adalah 3 cm dengan menggunakan ultrasonik komersial nebuliser (1,7 MHz).
Karakteriasasi
Bahan awal yang digunakan adalah SnCl2 2H2O (Merck) dengan konsentrasi O25, 0,5 dan 1 M yang berbeda dan doping antimon dijaga konstan pada 2% berat SbCl3. Proses ini dilakukan dengan waktu konstan 30 menit kemudian dilakukan beberapa kali proses annealing untuk mendapatkan kondisi optimal bagi penumbuhan film tipis ATO yang berkualitas tinggi.
HASIL DAN PEMBAHASAN
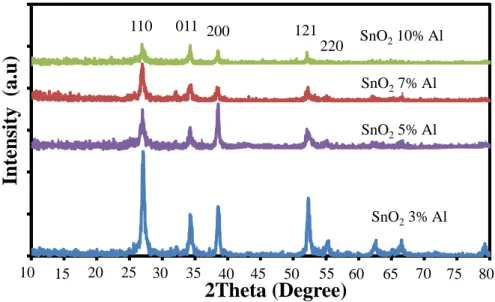
Hasil Analisis Difraksi XRD
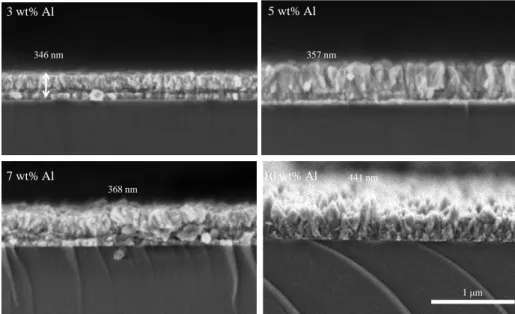
Analsisi Morphology
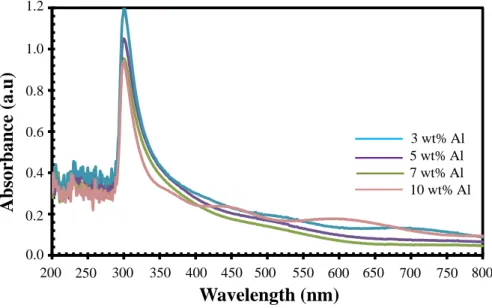
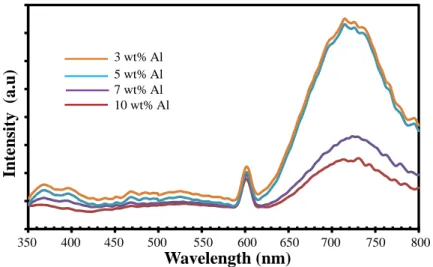
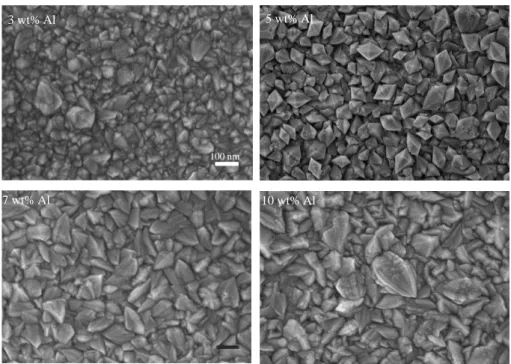
Pada konsentrasi yang lebih tinggi, doping Al yang berlebihan dalam larutan prekursor menyebabkan peningkatan energi permukaan biji-bijian, yang akan menyebabkan biji tumbuh dengan mudah dan menggumpal. Peningkatan yang luar biasa dalam intensitas puncak terkait cacat dengan peningkatan tingkat doping Al diamati.
KESIMPULAN DAN SARAN 5.1 Kesimpulan
LUARAN YANG DICAPAI
IDENTITAS JURNAL
IDENTITAS SEMINAR
IDENTITAS HAK KEKAYAAN INTELEKTUAL
RENCANA TINDAK LANJUT DAN PROYEKSI HILIRISASI
Saleem, Correlation between structural and optoelectronic properties of tin-doped indium oxide thin films, Optik-Int, J. Davar, Synthesis, characterization and optical properties of tin oxide nanoclusters prepared from a novel precursor via thermal decomposition route, Inorg. Ma, Effect of Sb doping on structural, electrical and optical properties of epitaxial SnO2 films grown on r-cut sapphire, J.
Kaskel, Optical and Thermal Properties of Infrared-Blocking Antimony-Doped Transparent Tin Oxide Thin Films e159. Zhang, Properties of Sb-doped SnO2 transparent conductive thin films deposited by radio frequency magnetron sputtering, Thin Solid Films e288. Luo, Preferred orientation, microstructure and functional properties of SnO2:Sb thin film: effects of post-growth annealing, Appl.
Zhao, Effect of annealing temperature on the crystal structure, growth behavior and properties of SnO2:Sb thin films prepared by radio frequency (RF)-magnetron sputtering, J. Ramola, Effect of electronic excitation on the structural, optical and electrical properties of undoped and tin oxide thin films, antimony doped thin solid films e42.
Metal doped ZnO nanorods decorated with carbon nanodots as an efficient photocatalyst for degradeation of Methyl Blue Solution
EXPERIMENTAL DETAIL 1. Materials
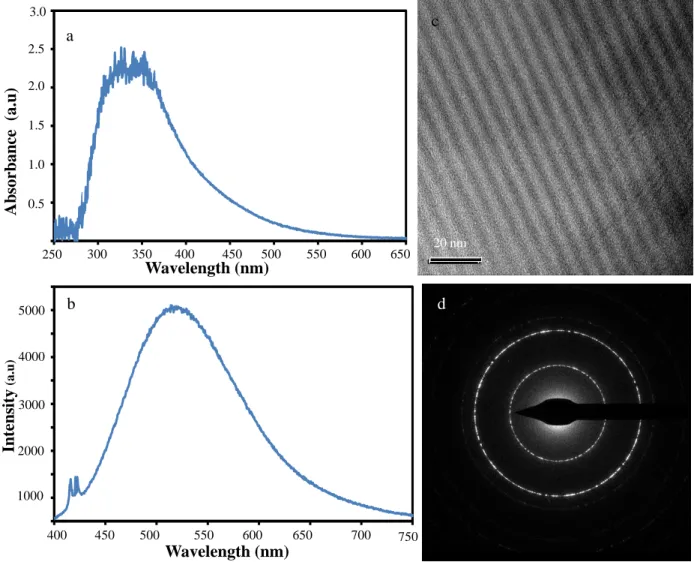
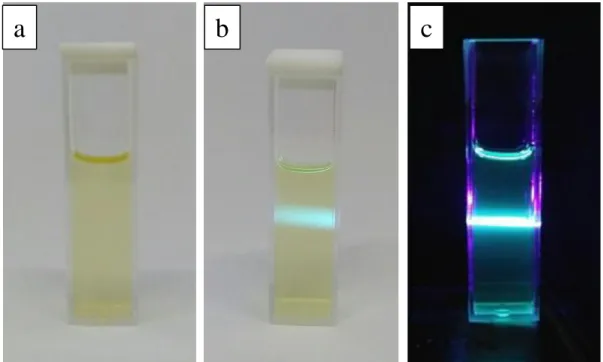
In a typical synthesis process, heterostructure ZnO/C-dots composite was prepared by two-step spin-coating process for 6 seconds at 500 rpm and followed for 30 seconds at 1000 rpm by 20 μl of C-dots dispersed solution on 1 × 1.5 cm the surface of the sample of ZnO nanorods. The transmission electron microscope (TEM) images of C-dots dispersed solution were recorded using a FEI Tecnai G2 20S-Twin, 200Kv electron microscope. The physical appearance of the C-dot dispersed solution prepared from cassava peels under visible light and irradiated with a 405 nm UV laser is shown in Figure 1.
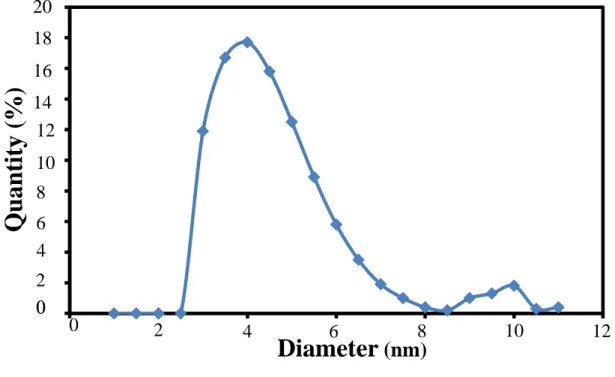
The absorption and photoluminescence emission spectrum of cassava husk C-dots in absolute ethanol is shown in Figure 2(a) and (b), respectively. It has been found that absorption peaks of C-dot dispersed solution appear in broad absorption peaks at the wavelength of 260 to 550 nm. It can also come from impurities containing functional groups on the surface of C-dots sample [22].
The lowest of PdI indicates the particle size distribution of C-dots dispersed solution almost identical. Meanwhile, the absorption peaks of ZnO sample coated with 4 layers of C dots have continuous broad absorption in the visible light region.
Diameter (nm)
This result proved the formation of C dots, as the material can be classified as carbon dot nanomaterial if their particle size is in the range of 2-10 nm and shows unique photoluminescence properties under UV light. The optical absorption spectra of ZnO/C-dots heterostructure with different C-dots layers can be seen in Figure 4. The absorption spectra at the wavelength around 320 to 390 nm are related to the characteristics of ZnO band gap energy, where the sample absorbs more photons in the UV light region and excites then the electrons from the valence band to the conduction band of ZnO.
The continuous absorption peaks in the visible light region due to the adhesion of C-dot particles to the ZnO surface corresponds to the electronic transition n-π* and assigned to the C = O bond of the carbon core of the C-dot sample and the π-π* transition of the C=C conjugate bond of carbon surface of C-dots sample [23]. UV-Vis optical absorption spectra of ZnO/C-dot heterostructure in the presence of different C-dots. It was observed that the optical bandgap of samples of ZnO nanorods was found to be 3.245 eV.
The attachment of the C-dots to the surface of ZnO's heterostructure slightly narrows ZnO's energy bandgap. The reduction of the optical bandgap of the ZnO/C-dots sample indicates the existence of C-dots particles in the surface of ZnO nanorods.
Wavelength (nm)
The Tauc plots for the optical band gap determination of the samples are presented in Figure 5. This condition changes in increasing the charge separation efficiency of its electron-hole pairs which significantly improves the visible light photocatalytic activity of sample. Therefore, it can be recommended to use prepared sample as an effective photocatalyst in the visible region.
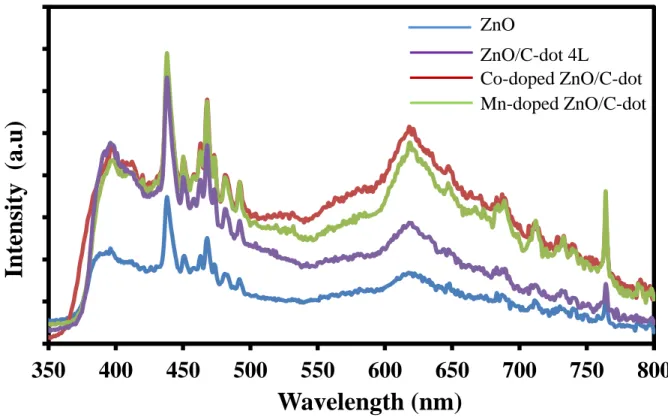
The photoluminescence (PL) spectrum of heterostructured ZnO/C-dots sample shows strong emission peaks in UV light region at 435 nm, two small peaks at 396 and 473 nm and broad emission peaks at 650 nm in visible light spectrum. The emission peaks at 396 nm demonstrate that the sample has a high degree of crystalline phase due to the free recombination of exciton in the band gap of ZnO.
The existence of 4 layers of C-dot particles on the ZnO/C-dot heterostructure surface increases the emission intensity in the UV and visible light spectrum. It is found that all samples of the ZnO/C-dot heterostructure exhibit broad green fluorescence centered at 628 nm. Photoluminescence spectra of ZnO/C dots and metal-doped ZnO/C dots in the presence of 4 dots of C layers.
The intensity of the peaks in the (002) plane of the ZnO nanorods is greater than the peaks of the ZnO/C droplet sample. This may be due to the interaction between C dots and the formation of ZnO nanorods. From the figure, it is also clear that the XRD pattern of the ZnO sample changed gradually with the appearance of new diffraction peaks centered at 29.98o as the C dots dispersed the solution loaded ZnO nanorods.
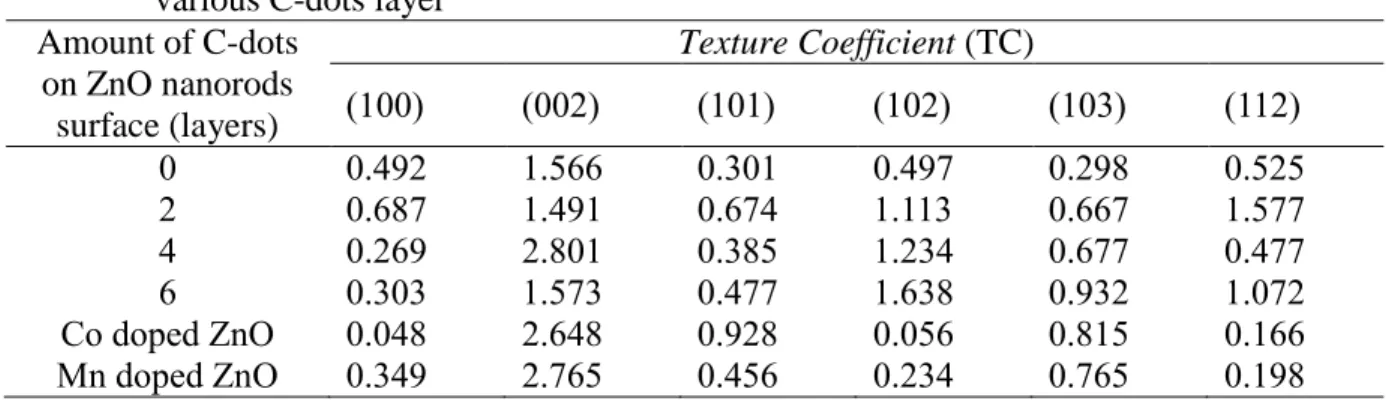
Further analysis to quantitatively identify the preferred growth orientation of ZnO/C-dots with different C-dot layers was performed by calculating the texture coefficient (TC) parameter. TC parameter of the sample taken from hkl for the six diffraction peaks of the samples using the equation described in [18].
2Theta (Degree)
Furthermore, the 2-layer solution-dispersed ZnO/C-dot heterostructure with C dots exhibits the lowest TC value of the (002) crystal plane. FESEM micrographs showing the morphology of the heterostructure of ZnO and ZnO/C-dots with different layers of C dots are shown in Figure 8. A similar type of morphology is also clearly observed in the ZnO/C-dot composite that was prepared by adding C .-the droplet-dispersed solution.
FESEM micrograph of ZnO nanorods and heterostructure of ZnO/C dots with different C-dot layers; (a) Pure ZnO (b) 2 layers (c) 4 layers and (d) 6 layers. Energy dispersive spectroscopy spectrum of ZnO nanorods and ZnO/C-dot heterostructure sample with different layers of C dots. Meanwhile, co-doped ZnO/C-dot heterostructure nanocomposite reveals the presence of Zn, O, C and Mn element .
It also shows that the sample contains mixed carbon materials and ZnO nanorods. a) FESEM micrograph and (b) Energy Dispersive Spectroscopy spectra of heterostructure Mn-doped ZnO/C dots and Co-doped ZnO/C dots with 4 layers of C dots. Photodegradation rate of methyl blue under UV light in the presence of heterostructured ZnO/C dots with several layers of C dots.
Time (Minute)
The photocatalytic activities of ZnO nanorods and heterostructure ZnO/C-dots samples with various number of C-dots layers provide the information of the best content of C-dots to prepare the ZnO/C-dots heterostructure sample with good photocatalytic property to organic to break down pollution. The enhancement of photocatalytic activity of Geko-doped ZnO/C-dots is attributed to the incorporation of 4 layers of C-dots that created favorable bonding with Geko-doped ZnO nanorods, which subsequently enhanced the efficient transfer of photogenerated charges on the surface of ZnO encourage monster. . Photodegradation rate of Methyl blue under UV light in the presence of Geco-doped ZnO/C dots and Mn-doped ZnO/C dots heterostructure with 4 layers of C dots.
The electronic interaction by chelation between ZnO and C-dots in the heterostructure of ZnO/C-dots was found to be essential to enhance the photodegradation rate of methyl blue solution. The absorption spectrum of UV-Vis analysis shows that confirmation of the C-dots on the surface of the ZnO/C-dot heterostructure slightly narrows the energy bandgap of ZnO. The C-dot dispersed solution was coated on the surface of ZnO nanorods to form ZnO/C-dot heterostructure and then used as good photocatalysts to degrade methyl blue under UV light illumination.
The photocatalytic activity of Co-doped ZnO/C-dots heterostructure covered with 4 layers of C-dots particles has the highest efficiency in degradation of methyl blue solution. Kansal, “N doped ZnO/C patches nanoflowers as visible light driven photocatalyst for the degradation of malachite green dye in aqueous phase,” J.
Effect of Deposition Temperature on The Structural and Optical properties of ZnO /Au Nanocomposite for Photocatalytic Application
Roza 1,2 , Annisa Citra Dwicahya 1 , Vivi Fauzia 1*
- INTRODUCTION
- EXPERIMENTAL DETAIL
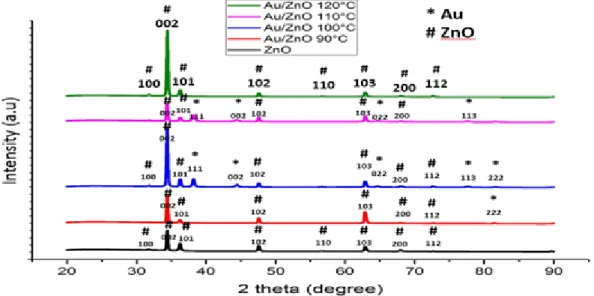
The XRD patterns of the ZnO nanorods and Au/ZnO nanocomposite prepared with various Au deposition temperatures are shown in Figure 1 . Au/ZnO heterostructure with deposition temperature 100oC possesses the highest peak intensity than other sample at (002) plane. Shows the optical absorption spectra of ZnO nanorods and Au/ZnO heterostructure taken at room temperature.
UV-Vis diffuse reflectance spectra of the Au/ZnO heterostructure with different Au deposition temperatures are shown in Figure 7. It shows the photoluminescence (PL) spectra of the Au/ZnO sample prepared with different deposition temperatures taken at room temperature. The sample of pure ZnO nanorods possesses the highest photoluminescence peak, followed by Au/ZnO heterostructure prepared with deposition temperature and 120 oC.
Absorbance spectra of methyl blue (a) without ZnO photocatalyst (b) with pure ZnO nanorods and (c) Au/ZnO heterostructure with different Au deposition temperatures. The absorption spectra were then used to calculate the degradation efficiency of the ZnO nanorods and the Au/ZnO heterostructure. These results showed that the Au/ZnO heterostructure prepared with a deposition temperature of 110 oC has the fastest degradation rate.
Photodegradation efficiency of methyl blue under UV light by ZnO nanorods and Au/ZnO heterostructures with different Au deposition temperatures.