This thesis entitled “Inventory Planning Design for Stochastic Demand in Apparel's Label Industry, Cikarang” prepared and submitted by Indah Dwidayanti Putri in partial fulfillment of the requirements for a degree in the Faculty of Engineering has been reviewed and found to satisfy requirements requirements for a thesis that is eligible for review. Given a collection of models for the data, AIC assesses the quality of each model relative to each of the other models. One of the industries affected by the evolution of the fashion business is the labeling and packaging business.
According to Coyle et.al. 2003) effective management of the flow of supplies in supply chains is one of the key factors for the successful operation of a company. Not only that, one of the challenges for. 5% of the customer's order is lost and 30% of the order is diverted to PT.
X Indonesia, the company desperately needs to design the best inventory planning that fits the characteristics of the RFID product, especially for HM-RT01.
INTRODUCTION
Problem Background
Problem Statements
Objectives
Scopes
Assumption
Research Outline
LITERATURE STUDY
Demand
Demand Management
- Characteristics of Demand
- Dependent and Independent Demand
Forecasting
- Definition and Basic Concept of Forecasting
- Principle of Forecasting
- Forecast Methods
- Forecast Error
Time Series Analysis
- Definition
- Time Series Analysis
Box-Jenkins Method
- Autoregressive (AR) Model
- Moving Average (MA) model
- ARIMA (Autoregressive Integrated Moving Average) Model
- SARIMA Model
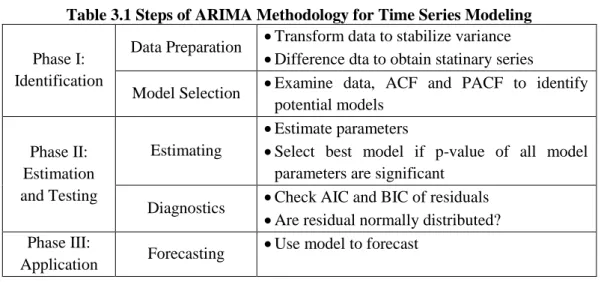
- Step of ARIMA model
- Identification
- Parameter’s Estimation
- Model Verification
- Forecast Result
Inventory Planning
- Quantity Decisions
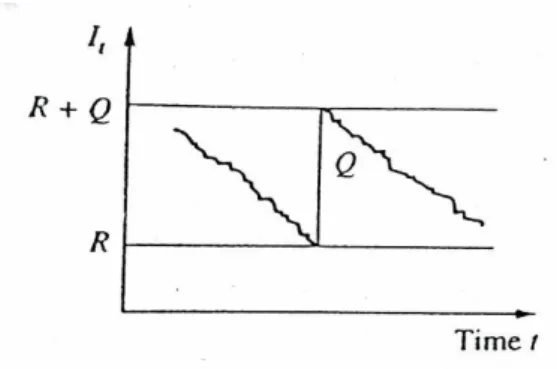
- Continuous Review Systems (Q,R) Policy
- Periodic Review (S,T) Policy
- Safety Stock
- Reorder Point
- Total Inventory Cost
RESEARCH METHODOLOGY
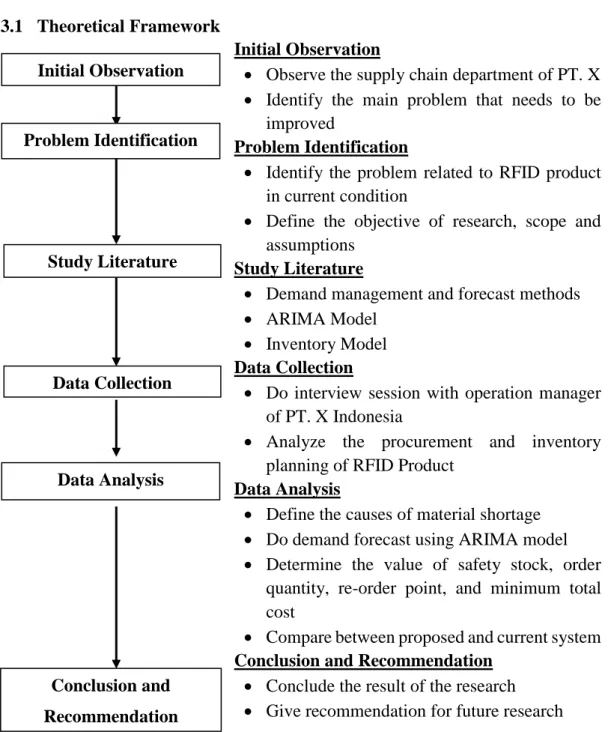
Theoretical Framework
- Initial Observation
- Problem Identification
- Literature Study
- Data collection
- Data analysis
This is the first step of this research by analyzing the supply chain department specifically focusing on the RFID product, especially for item HM-RT01 on PT. The initial observation is done by interviewing the people involved in RFID, such as operations manager, production manager, inventory planner, people who are responsible for procurement and people who are responsible for export-import to get in-depth knowledge and understanding regarding the RFID product. This is one of the phases in this research which was carried out to identify the main problem in the current system at PT.
An important aspect is to identify the problem at the beginning of the process. The problem that arose in this research is related to the inventory management of item HM-RT01, which is RFID for the Swedish clothing industry at PT. In the problem identification process, the aspect that acts as a cause of material shortage is inaccurate demand forecast data.
The focus of this research is to increase the accuracy of demand forecasting so that inventory costs and other losses will be reduced. Determine the optimal forecasting model that improves the current demand forecast using the ARIMA model. X Indonesia starts from August 2015 to October 2017, assuming no other restrictions for this research.
By using multiple references such as journals, books, and websites, a literature study can be used to support the theory in this research. After obtaining the problem and relevant data, the next step is to analyze the data based on it. Implement and analyze the Box-Jenkins method to get better demand forecasting data.
Design of the new inventory management model for RFID products based on the prediction data obtained from the Box-Jenkins method (SARIMA model). Compare the result of the current inventory management and the proposed inventory management by considering the total costs as a parameter.
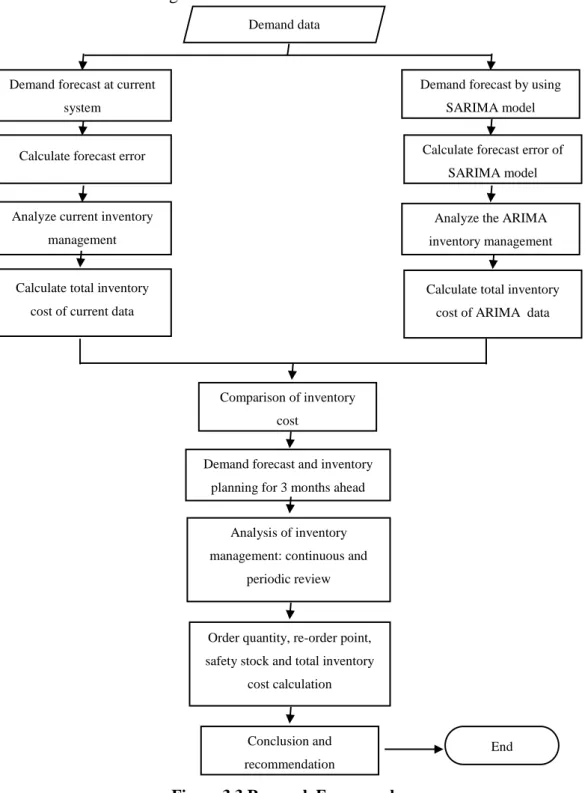
Box-Jenkins Methodology
Reserach Framework
DATA COLLECTION AND ANALYSIS
Data Collection
- Product Description
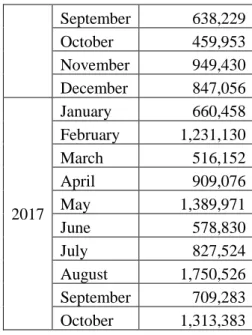
- Demand Data of the Product
- Current Forecast Data and Calculation Of Forecast Error
- Ordering Cost
- Holding Cost
- Route Cost
- Current Inventory Planning
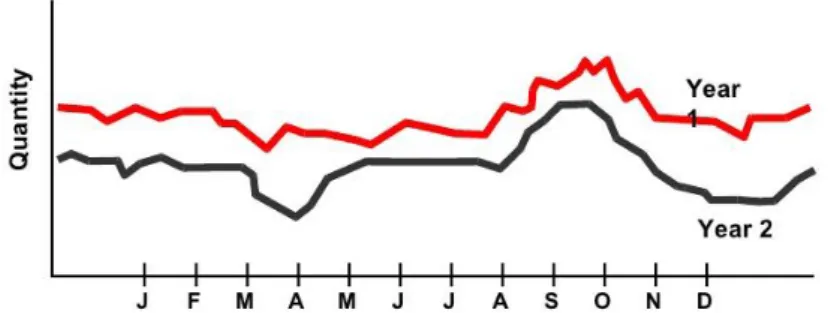
The chip and all the information related to the product has already been inserted by the supplier. Therefore, it can be concluded that the demand data of RFID product will be similar to the material request to the supplier, which means that one piece of finished goods of RFID will be equal to one piece of material of RFID. According to the Figure 4.2 above, the demand data of the product is volatile and has a positive trend over time.
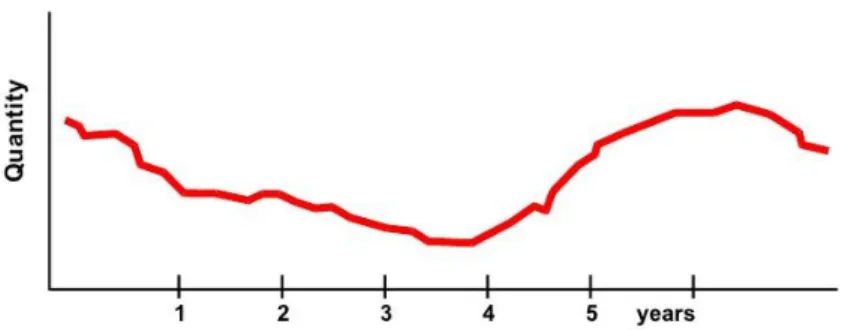
According to Figure 4.3 above, it can be estimated that the data is non-stationary with the positive trend over time. The forecast data will be shared directly to the warehouse planner at each location responsible for producing RFID, then the information sharing is only between the global planner and the local warehouse planner. Order costs are all the expenses incurred when the company wants to place an order with the supplier, which was the case since the company created a purchase requisition to get goods available.
These costs are virtually the same as the costs for outsourcing. The difference is that the product is not returned to the company, but is shipped directly to the customers. The cost incurred for this activity is twice the purchase price per unit of RFID or equal to IDR 4,000 per piece, and the additional cost for delivering the item to the customer, which is the average delivery cost, is IDR 2,000,000. X Indonesia, the service quality level is always below 70%, it was measured based on PT.
The next is the total order completed, which means that the number of customer orders processed in that week matches the number of supplier inventory balances and materials already ordered in the previous period. There are two days on which the company can place an order with the supplier, namely Monday and Thursday. Since the lead time from company to customer is only 4 days, this means that there will be a late delivery if the company places an order on Thursday.
The total material ordered from the supplier is quite similar to the total demand forecast. X Vietnam, which means the company will pay more to complete the customer's order corresponding to the cost of the route and also experience delivery delay to the customers.
Proposed Forecast Method
- Data Analysis Using the ARIMA (Box-Jenkins method)
- Model Identification
- Parameter’s Estimation of Seasonal ARIMA Model
- Model Validation and Verification
- Forecast Result
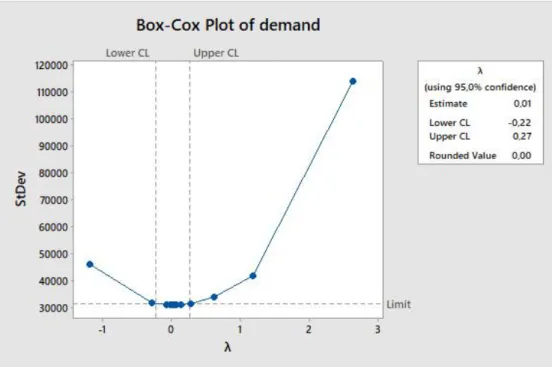
To have a data series that will be stationary with respect to variance (constant variance), the data must be transformed. In addition, to have a data series that will be stationary towards the mean (constant mean), the data must be differentiated. This means that the data is non-stationary to variance and should be transformed.
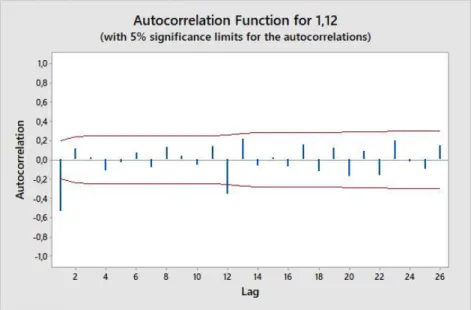
In the second transformation process, the data has the optimal rounded value which is. It can be concluded that the data has an optimal rounded value at the second transformation, then this data will be checked to mean stationarity. Not only that, but also the data series that have a non-stationary pattern will have the value of the first layer is very close to one.
This means that the data is seasonal, with the number of lags equal to 12. The last is Figure 4.6c, which is the (1st, 12th) differenced data or data series that has been differenced after the first and seasonal differencing process. The graph of the data appears to be stable because the graph is close to zero values that are parallel to the x-axis.
50 ARIMA model is (p,d,q), but if the data was detected as a seasonal trend, the equation would be (p,d,q) x (P,D,Q)(lag number). The primary tools in the analysis of the order value are the autocorrelation function (ACF) and the partial autocorrelation function (PACF). Not only that, but the autocorrelation test will show the value of correlation between the data series. If the P-value of the order < 0.05, then it can be concluded that the order is significant and will be chosen to be the ARIMA model.
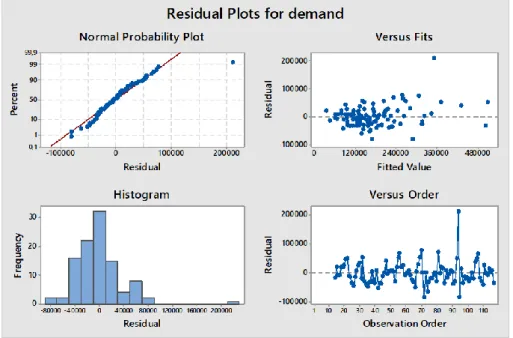
The purpose of this phase is to ensure that the model chosen fits the data series. Therefore, it can be concluded that the data forecast is good at estimating the actual value of the demand.
Inventory Planning Analysis
- Safety Stock
- Total Inventory Cost of Period 115 until 126 (year 2017)
- Inventory Cost by Using Current Forecast Method
- Inventory Cost by Using ARIMA Forecast Method
- Comparison Between Current and Proposed Forecast Method 64
- Demand Forecast
- Inventory Cost Comparison Among Inventory Model
CONCLUSION AND RECOMMENDATION
Conclusion
The goal of the research is to find an optimal solution that can be implemented in PT. Based on the calculation and data analysis that was done in the previous chapter, it can be concluded that the objectives of this research have been achieved. The reason for the material shortage is the lack of forecasting data and inventory planning for the RFID product.
The accuracy of demand forecasting for RFID products is successfully improved by using Seasonal ARIMA (SARIMA) model. This approach was chosen due to this model being suitable for the characteristics of RFID product which are seasonal and non-stationary. The inventory management calculation for next season in 2018 comes with the lowest total inventory cost presented by (Q,R) model with optimization approach, which is IDR using ocean shipping mode compared to the other model.
Recommendation
Ouwehand, How to use aggregation and combined forecasting to improve seasonal demand forecasting, International Journal of Production Economics, 2004, pp. Ghiani, Gianpaolo, Gilbert Laporte and Roberto Musmanno, Introduction to Logistics Systems Planning and Control, John Wiley & Sons, Ltd. ., England, 2004. Jennings and Murat Kulahci, Introduction to Time Series Analysis and Forecasting 2nd Edition, John Wiley & Sons, Inc., New Jersey, 2015.
Pankratz, Alan, Forecasting with Univariate Box - Jenkins Models: Concepts and Cases, John Wiley & Sons, New York, 1983. Anwar Ashek, Stochastic Demand Forecasting and Inventory Management of a Seasonal Product in Supply Chain System, Dissertation, The Interdepartmental Program in Engineering Science, Lousiana State University, Lousiana, 2008. Kumar, Sathianandan, T.V., Sharma, A.P., Modeling and Forecasting of Marine Fish Production in Odisha Using Seasonal ARIMA Model, National Academy Science Letters, vol.
Octora, Metta, Kuntoro, Perbandingan Metode ARIMA (Box Jenkins) dan Metode Winter dalam Peramalan Jumlah Kasus Demam Berdarah Dengue, Jurnal Biometrik dan Populasi, vol.2, 2013, hal.
APPENDIX A
APPENDIX B
The next step is to find the corresponding R1 by using the standardized normal distribution to find the value of F(z). The next step is to calculate the maximum backorder level, from the unit normal linear loss integral table, the value of L. 100 The next step is to find the corresponding R0 by using the standardized normal distribution to find the value of F(z) to find. ).