To achieve this commitment, Indonesia and the Kingdom of Norway agree to continue the partnership to further promote the implementation of REDD+ and to protect the remaining natural forests as well as the carbon-rich peatlands in Indonesia, which are part of the Letter of Intent (LoI) between the Government of Indonesia and the Government of Kingdom of Norway signed in 2010. Since the start of the LoI, both countries show strong commitments in addressing the issue of climate change mitigation action and in particular the support of the readiness of REDD + implementation in Indonesia. Various grants from the Government of Norway have been granted to support initiatives in improving capacities and developing systems for implementation of REDD+ and peatland management in Indonesia.
Furthermore, in 2018, Indonesia submitted the Technical Annex of BUR to UNFCCC, which presents the results of Indonesia's emissions reduction. As part of the 3rd phase of Indonesia-Norway LoI, both countries have developed the agreed MRV protocol that outlines further mechanism of the result-based payment specifically for the implementation of Indonesia-Norway REDD+. The protocol was developed under mutual relationship and common goals to contribute to the international climate agreement by reducing emissions from tropical deforestation, forest degradation and peatland management.
As the next steps, Indonesia develops the baseline for the results-based payment, as agreed in the MRV protocol, and submits the emission reduction report from the avoided deforestation and forest degradation to the Indonesia-Norway partnership. We acknowledge the contributions of relevant institutions and team of experts during the preparation and development of the RBP baseline and emission reduction report for the Indonesia-Norway partnership.
INTRODUCTION
RESULT BASED PAYMENT BASELINE INDONESIA-NORWAY PARTNERSHIP
- Definitions Used
- Forest
- Deforestation
- Forest Degradation
- Baseline for Result Based Payment
- Area, Activities and Pools Covered Results
- Area Covered
- Activities Covered
- Pools and Gases
- Data
- Activity Data
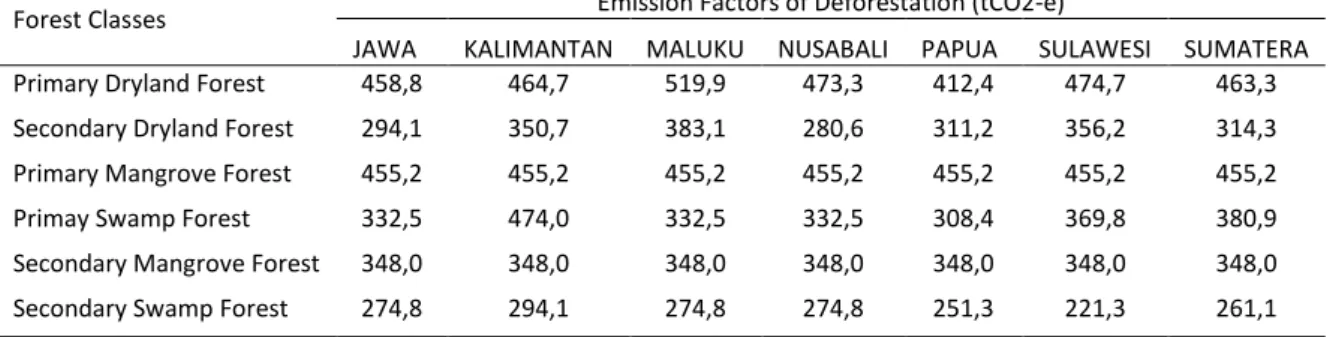
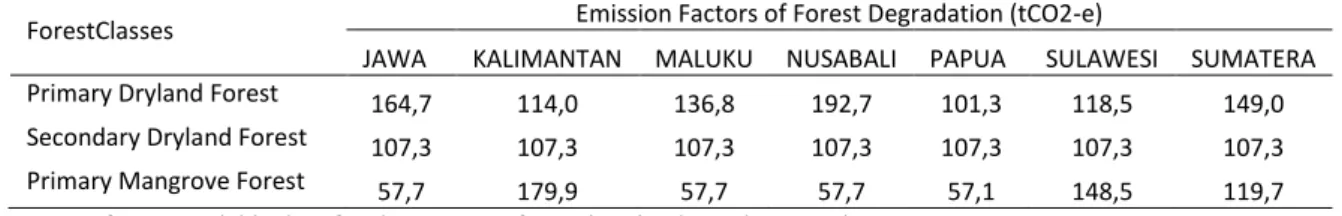
- Emission Factors
- Methodology and Procedures
- Forest Cover Change Analysis
- Reference Period
- RBP Baseline Calculation
- Results of the Construction of RBP Baseline
- Estimates Emission from Deforestation
- Estimates Emission from Forest Degradation
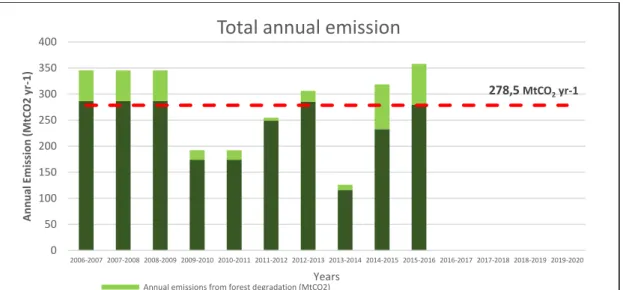
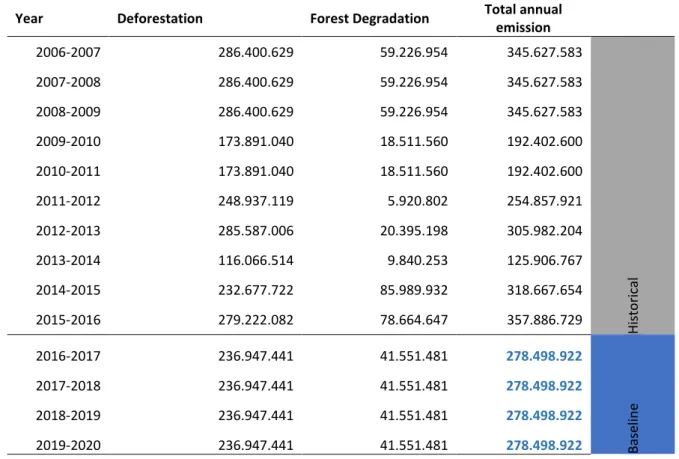
- Constructed and Projected RBP Baseline
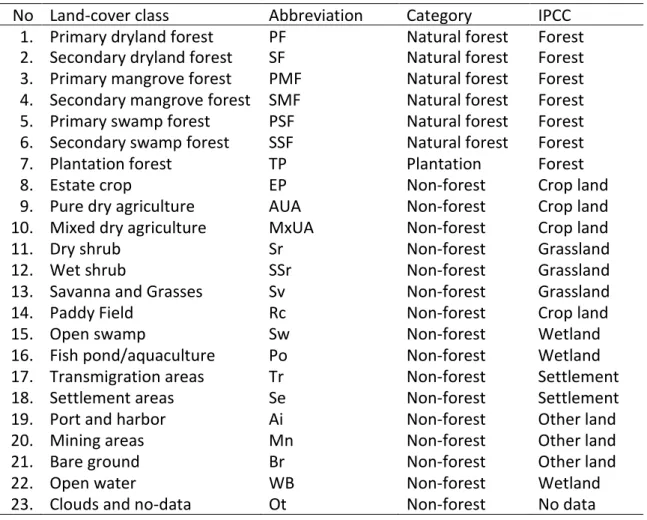
Forests used as the basis for the calculation refer to natural forests, according to the classification of the land cover map of the Ministry of Environment and Forestry (Table 1) and used in the Forest References Emissions Level. Deforestation is defined as the one-time conversion of natural forest cover to other land cover categories that occurred in the same area. This means that the deforestation took place in regenerated forests, which have previously been deforested, are not included in the calculation.
Forest degradation is defined as a transition from primary forest classes, including primary dryland, primary mangrove, and primary swamp forests, to secondary forest classes, which reduce carbon stocks due to human activities. RBP baseline calculation considers above-ground biomass (AGB) as the main carbon pool and reports the greenhouse gas emissions of carbon dioxide (CO2). The RBP baseline calculation uses the emission factors identical to those used in the 1st Indonesian FREL.
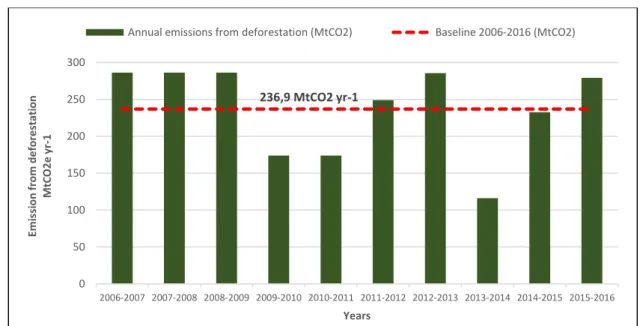
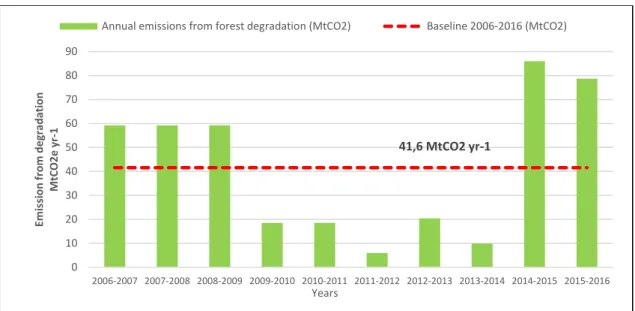
Forest degradation is the change from primary forests to grades of secondary forests in the following year. Baseline emissions from deforestation and forest degradation are generated based on annual emissions in the period 2006/2007 to 2015/2016.
RESULTS
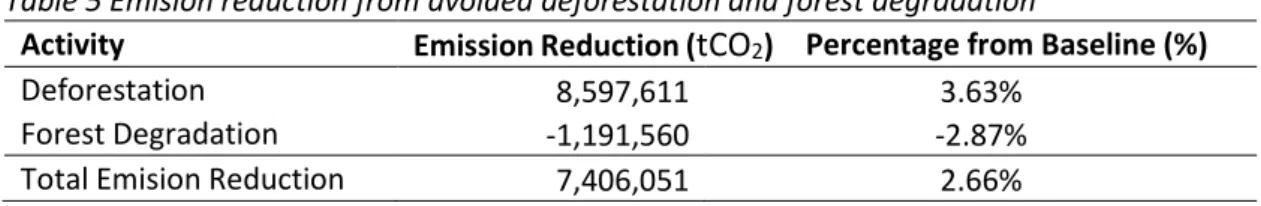
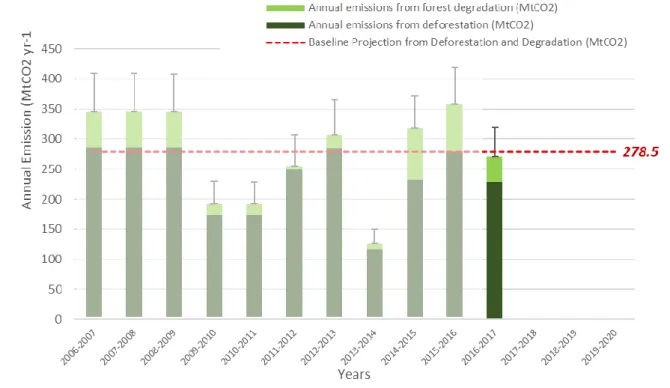
In 2017, Indonesia reduced the emission of 7,406,051 tCO2 from both avoided deforestation and forest degradation (See Table 5 and Figure 4).
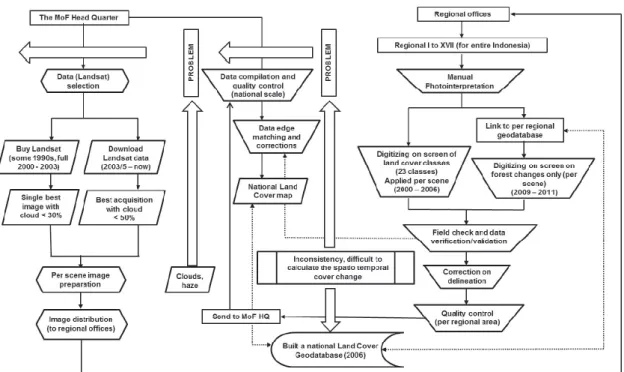
DESCRIPTION OF THE NATIONAL FOREST MONITORING SYSTEM (NFMS) AND
In a tropical area like Indonesia, clouds and haze are the main problems when using optical remotely sensed data, including Landsat. Unfortunately, unlike Brazil, Indonesia does not have a cloud-free seasonal window that offers the opportunity to capture cloud-free images [Broich et al 2011 in Margono et al., 2016]. Limited cloud-free image coverage and budget constraint limit data availability for the system.
However, since 2008, given the change in Landsat data policy, the United States Geological Survey (USGS) has made Landsat data freely available over the Internet [Wulder et al, 2012, Roy et al 2010]. While most of the data is available online around 2009, the policy gives Indonesia significant opportunity and advantage to increase the data available to the system. The total Landsat data for all of Indonesia within the selected annual interval was approximately 218 scenes.
At the end of 2014, the NFMS established MoU with the National Space Agency (LAPAN), especially in Landsat data provision to ensure the data sustainability of the NFMS. Although the names of land cover classes blend to some extent with land uses, such as forest plantation or estate crops, object identification over the imagery is purely based on existing appearance, not likely cover or land uses. Recommended maximum scale for classification process is 1:100,000 for using only multispectral bands (eg band 5-4-3) and 1:50,000 for using panchromatic band for data registration.
At the moment, the national land cover map of Indonesia is made available at the minimum scale of 1:250,000. QC/QA for the land cover data was performed using ground truth points distributed throughout Indonesia. In addition, the assessment of land cover change uncertainty uses reference data generated using a set of 10,000 30x30m grids corresponding to time series of Landsat satellite image pixels.
There are problems due to complex and sometimes conflicting definitions for land cover classification, including the definition of forest and deforestation. The NFMS in a portal aims to integrate internet capabilities and forest information system into two-way (two ways) media information exchange: a step towards good forest management, through transparency. The current NFMS provides a facility to benefit from public participation in updating, correcting or simply commenting on the uploaded land cover map.
DEMONSTRATION THAT METHODOLOGIES ARE CONSISTENT WITH RBP
NECESSARY INFORMATION THAT ALLOWS FOR THE RECONSTRUCTION OF
UNCERTAINTY AND BIAS (TEDDY R)
PROPOSED RESULT BASED PAYMENT
Where GEij = CO2 emissions from deforested or forest-degraded area-i in forest change class-j, in tCO2e. Emissions from the change of forest change class-j to non-forest classes are calculated using equation (1). For example, to calculate emissions from deforestation from primary dryland forests (class code 2001) (GE2001) in tCO2e, we used equation (3).
Emissions from deforestation of other forest classes use a similar equation with corresponding emission factors. For example, emissions after the initial disturbance are inherited from one to the other and the total emission from peat degradation is the accumulation of peat emissions from 1990. Serious and continuous activities must be undertaken to reduce emissions from peat degradation.
Calculation of emissions from peatland degradation in a given year at the time of deforestation and forest degradation used the same basis as that used to calculate emissions from deforestation and forest degradation with the inclusion of legacy emissions. As mentioned above, this is because when deforestation and forest degradation occurred in peatland forests, there would be emissions from the loss of ABG at the time of conversion as described above, and additional subsequent emissions from peatland degradation at the time of deforestation and forest degradation. In addition, the deforested and degraded peat forests will release additional CO2 emissions in the following years, known as legacy emissions from peat vein degradation.
In accordance with deforestation and forest degradation activities, the emissions from peat decomposition were calculated from 2013 to 2017. The emissions from peat decomposition are progressive, due to inherited emissions from previous degraded peatlands. The emissions from peat decomposition will never decrease unless the degraded peatlands are turned into forests, which is unlikely to happen in this period of assessment.
In the first FREL paper, we developed linear equations from regression analysis using annual peat emissions from historical data. Emissions from peatlands experiencing more than one fire event are assumed to be halved compared to that of the first burn, e.g. The results of the calculation of emissions from burnt peat are presented in Figure Appendix 3.4.
Emissions from peat fires in 2017 dropped dramatically, due to massive law enforcement and moratorium policies on new peat and old-growth forest permits. This indicates that an accurate estimation of emissions from peat fires should also take into account the frequency of fires in an area and use emission factors adjusted accordingly. With the above conditions and a high level of uncertainty of all parameters involved (detection of hot spots, estimation of burned area size, fire frequency, depth of burned peat, mass of fuel available for combustion), this FREL document did not include emissions from peat fires .